Core inflation communication in practice

Using a large language model to read central bank publications, we uncover patterns in how central banks communicate about core inflation. Two findings stand out. First, references to core inflation have become more frequent. This probably reflects its greater relevance when low and stable inflation means that headline movements are mostly driven by relative price changes, as in the pre-pandemic period. Second, the range of core inflation metrics cited has broadened. Central banks have avoided selecting a preferred gauge and instead relied on a suite of indicators to identify underlying price pressures. This expansion may introduce new communication challenges, as explaining additional measures can make messaging more complex.
JEL classification: E31, E52, E581
Although inflation targets are defined in terms of headline inflation – a measure intended to capture changes in the cost of the full consumption basket for the average household – central banks routinely refer to core inflation measures in their communications. The purpose of these measures is to identify underlying price pressures. Over time, core inflation metrics have evolved from the long-established approach, which excludes food and energy from headline inflation, to more sophisticated methodologies.
Core inflation measures can help central banks look beyond relative price changes and focus on the persistent forces that are likely to determine the future path of inflation. Indeed, because monetary policy works with lags, central banks commonly focus on where inflation is heading rather than where it stands today.2 Reading underlying price pressures in a timely manner and communicating them clearly is crucial in a shock-prone world. Recent difficulties in gauging the implications of price pressures – stemming from trade tensions and the ongoing conflict in the Middle East – are a case in point.
Against this backdrop, this article documents how the use of core inflation measures in central bank communications has changed over time, what measures central banks use and what influences the choice between them. While we do not study how core inflation enters into monetary policy decisions or the role it plays in central banks’ justification of such decisions, the analysis sheds light on how they refer to this pivotal variable in their publications. We use a large language model to analyse around 8,000 monetary policy statements, meeting minutes and monetary policy (or inflation) reports from 24 economies since 2006, recording the inflation measures central banks allude to and how often they do so. The systematic reading of the documents shows how communication about core inflation has evolved.
- A review of central bank publications over the past two decades using a large language model reveals more frequent mentions of core inflation and communication of a wider range of core inflation metrics.
- Low and stable inflation before the pandemic may have increased the focus on core inflation, as it aims to remove the effects of the changes in relative prices that mostly drove headline inflation movements.
- The proliferation of core inflation measures presents new communication challenges, underscoring the need for clear and tailored messaging for different audiences.
We find that central banks have come to refer to core inflation more frequently over the past two decades: they are more likely to discuss it in statements and minutes, and they mention it more often in monetary policy reports. This pattern may be a response to the environment of low and stable inflation that prevailed before the Covid-19 pandemic. Indeed, when inflation is low and stable, headline inflation largely reflects changes in relative prices and core inflation becomes more relevant for the reading of underlying price pressures. The pandemic interrupted this trend, as central banks had to explain generalised price pressures.
Central banks have also widened the range of core inflation metrics they cite, rather than focusing on a single preferred gauge. Confronted with metrics that exhibit offsetting strengths and weaknesses which reflect trade-offs between ease of communication and statistical properties, central banks assemble a portfolio of indicators instead of selecting one. A broader set of metrics can convey more information or give confidence about the robustness of the reading about underlying price pressures. However, it also raises communication challenges: central banks might be asked which measures receive more weight in the analysis, or what they would do if the measures sent conflicting signals. This widening of the range of metrics used suggests that the question of how best to identify underlying price pressures remains unresolved – perhaps because there is no straightforward answer.
The article proceeds as follows. The next section documents the trend of the increasing use of core inflation in central bank publications. The section that follows turns to the metrics they cite. A final section concludes.
References to core inflation in central bank publications
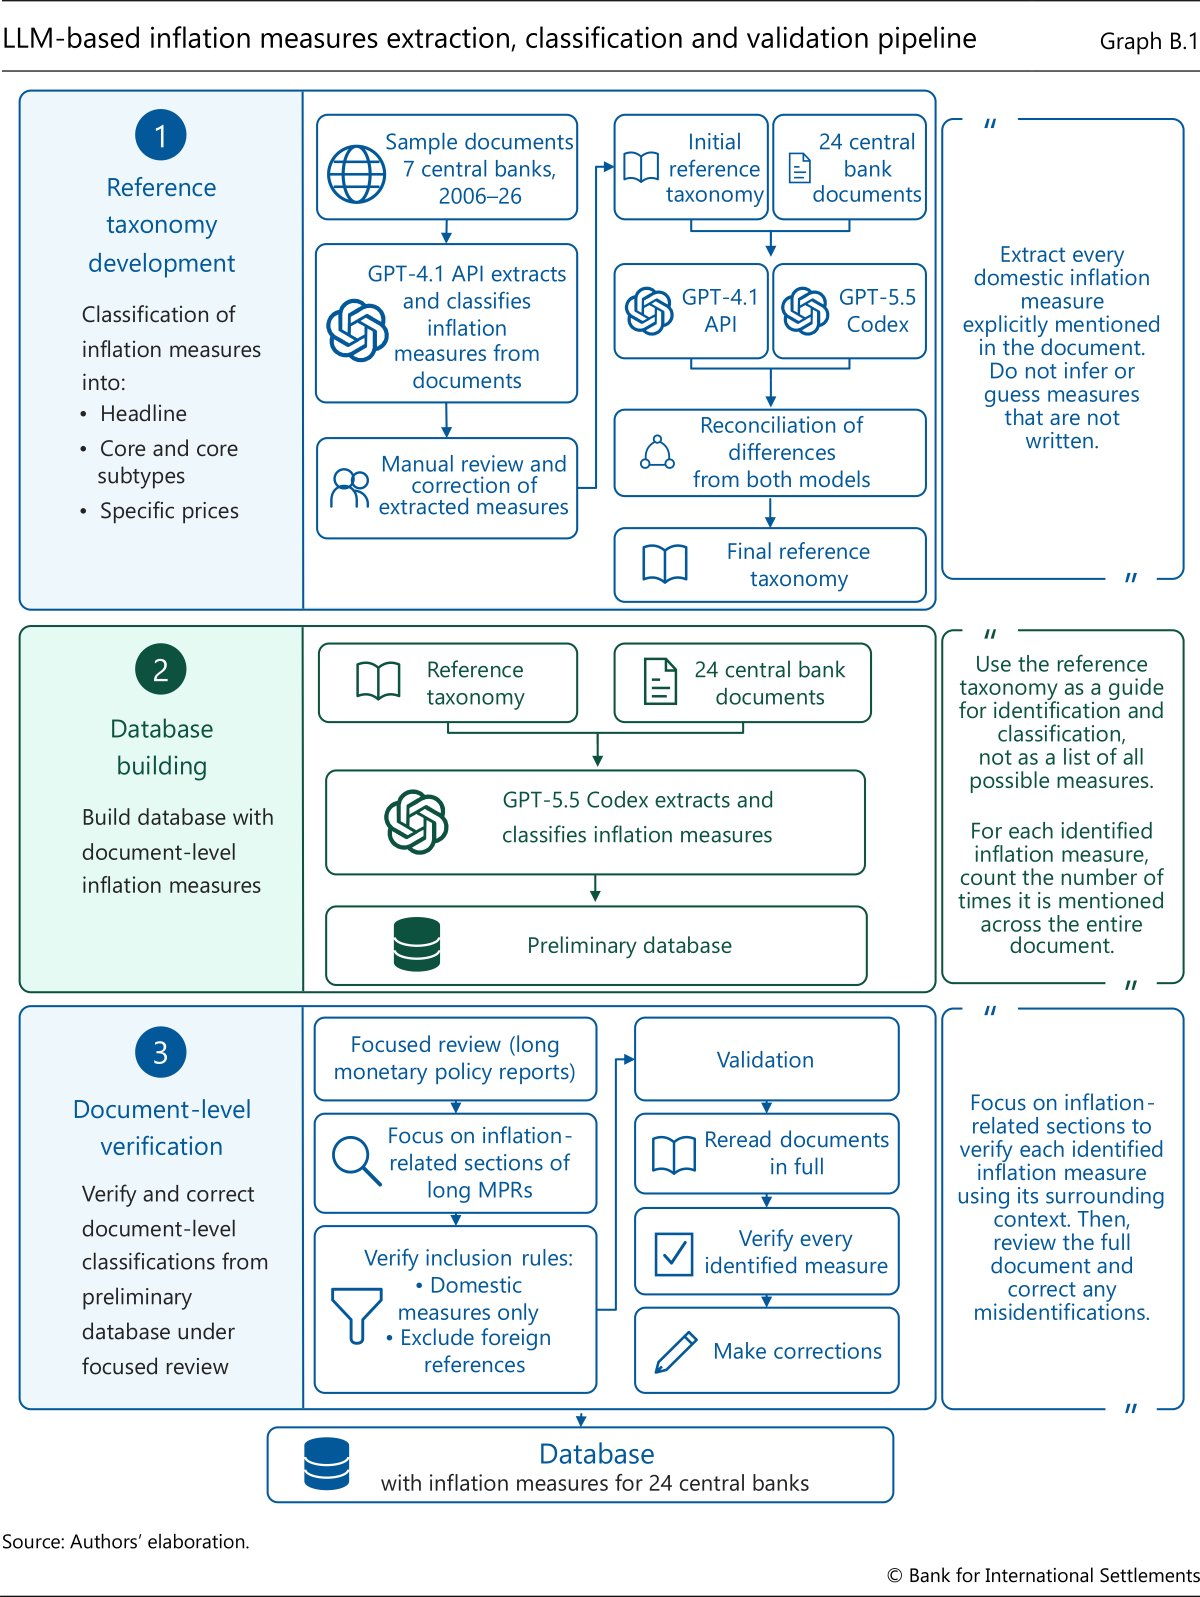
To analyse how central banks have communicated about core inflation, we employ a large language model to systematically review their publications. The body of text includes monetary policy statements, meeting minutes (timely public versions, not transcripts) and monetary policy (or inflation) reports of central banks in 24 economies, consisting of 11 major advanced economies (AEs) and 13 major emerging market economies (EMEs), published since 2006 – around 8,000 documents in total.3 For each document, the model identified every reference to a measure of inflation – headline and core – and to specific items of the consumption basket (eg energy, food, rent) and recorded the frequency of each.4 This process (see Annex B) yielded a comprehensive panel at the central bank-document-date level that is used for the analysis below.
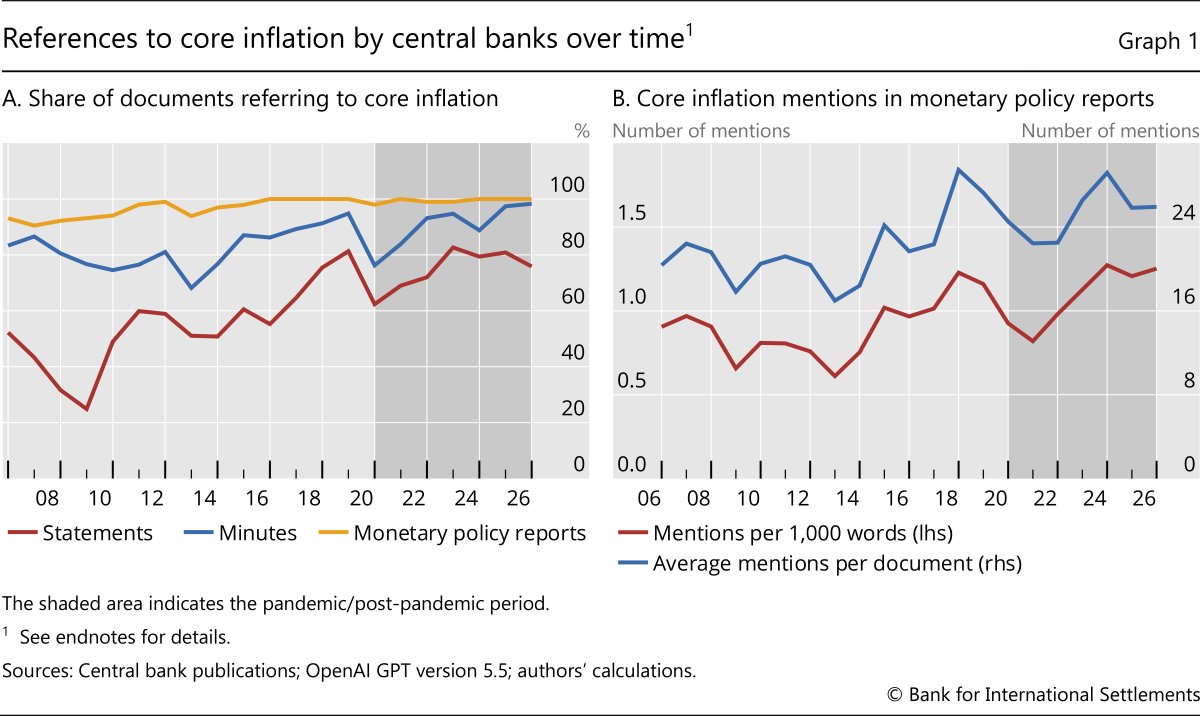
The data reveal that central banks have increased the frequency with which they refer to core inflation in their official documents. The proportion of monetary policy statements and of minutes that mention core inflation has risen steadily since 2006 (Graph 1.A). The number of references to core inflation in each monetary policy report has also expanded (Graph 1.B).
The pandemic interrupted the upward trend in references to core inflation in central bank communication. In 2020, the share of statements and minutes mentioning core inflation declined markedly (Graph 1.A), and reports included fewer references (Graph 1.B). The exceptional nature of the disruption and the extraordinary developments central banks faced may account for this change. The levels of those indicators remained relatively low in 2021 and 2022, when inflation was peaking. Core inflation regained prominence in the subsequent disinflationary phase, when central banks relied on it to communicate about the persistence of inflation.
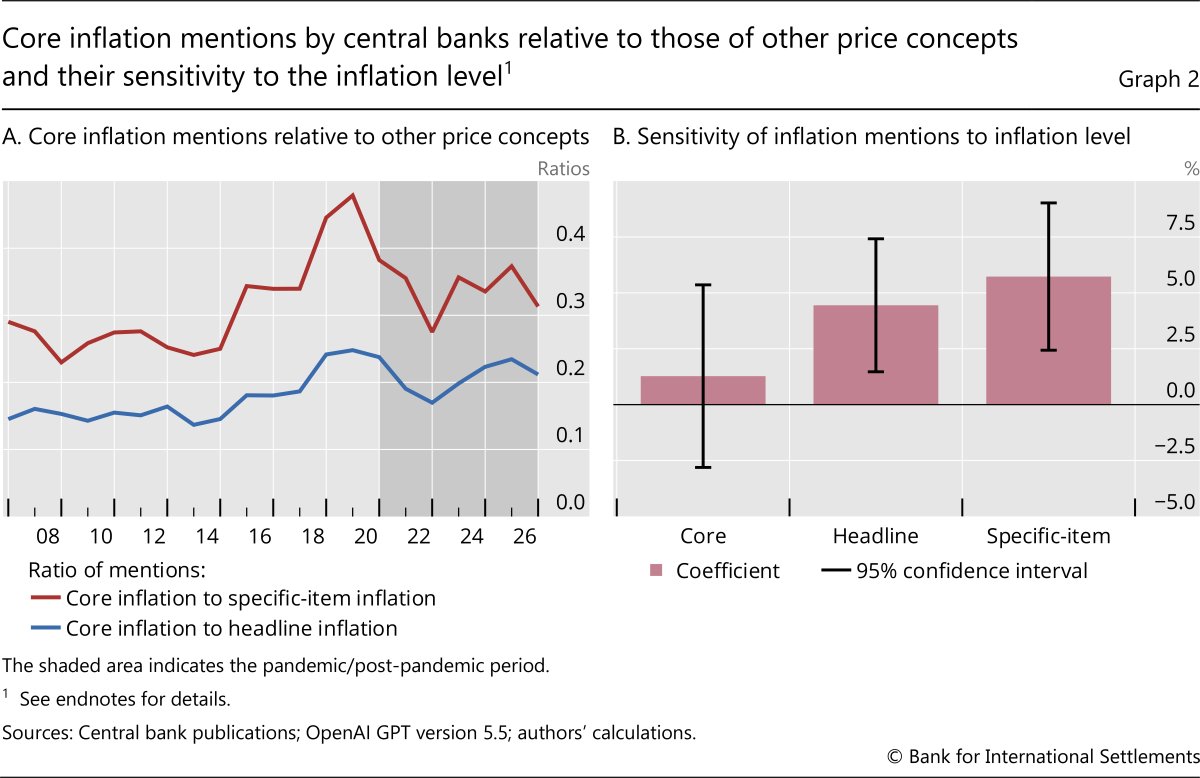
A possible explanation for the rise in references to core inflation is that central banks were adapting their communication to the environment of low and stable inflation prevailing pre-pandemic. Concerns about below-target inflation were specific to AEs, but the period was also one of relative inflation stability for EMEs (Americo et al (2025)). When inflation is low and stable, movements in the aggregate price index largely reflect changes in relative prices (BIS (2022)). Headline inflation may then move around for reasons unrelated to underlying price pressures. Consequently, a measure that tries to abstract from relative price changes – a core inflation metric – then becomes more informative and may receive increased attention.5 Indeed, we find that core inflation references increased relative to headline inflation mentions and to explanations of specific-item inflation in the pre-pandemic period (Graph 2.A).
Further reading
• Inflation: a look under the hood
• Moving targets? Inflation Targeting Frameworks, 1990-2025
• Monetary policy decision-making and communication under high uncertainty
Core inflation mentions would not be expected to strongly co-move with the prevailing level of inflation in a low and stable inflation environment. This is precisely because core inflation is not useful for explaining the changes in relative prices that mostly drive inflation under such conditions. Instead, if inflation increases at the margin, central banks would be pushed to explain more about the price dynamics of the specific items in the consumer basket driving the changes in relative prices and the implications for headline inflation. Our analysis of monetary policy reports points to patterns in that direction (Graph 2.B). Central banks might also say more about headline inflation for accountability reasons, given the inflation target. Each inflation indicator thus plays a distinct role: headline inflation anchors the target, so centra banks report on it for accountability; core inflation diagnoses underlying price pressures; and item-level gauges account for the relative price changes.
Central banks also explain developments in specific items of the consumption basket to address households’ concerns about price increases in salient items, such as food and energy (Box A). This effort to explain is justified: many studies find that inflation expectations are disproportionately shaped by particularly salient and frequently purchased items (eg Dietrich (2024)). Central banks therefore cannot rely on core inflation alone when these items are driving price increases.
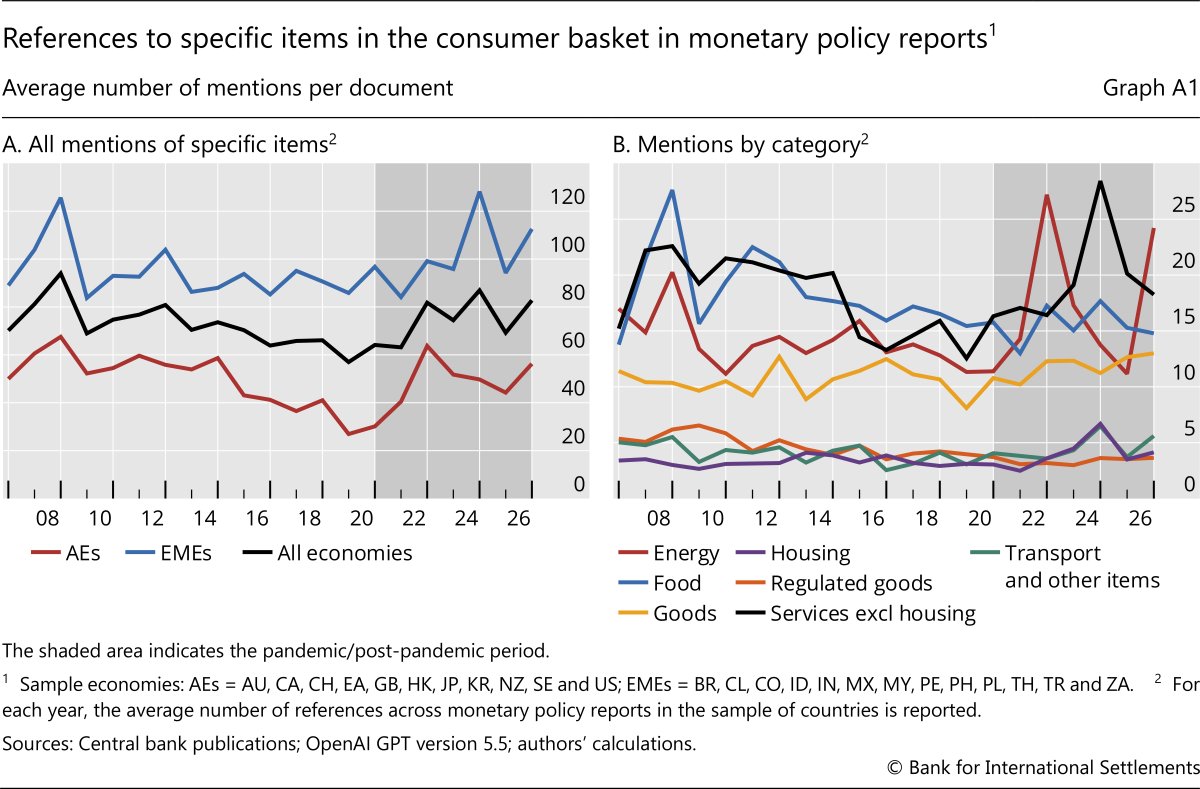
One of the findings of this article is that central banks increase references to specific items in the consumption basket when explaining increased inflation. The Covid-19 pandemic was an extreme case: mentions of specific items in monetary policy reports (MPRs) rose markedly (Graph A1.A), as institutions sought to account for prominent relative price movements alongside elevated headline inflation. This box examines which items central banks mention more often in their communications.
Two findings stand out. First, food and energy are especially salient in the discussion (Graph A1.B). This is perhaps natural, as the most common core inflation measure is constructed by excluding those two categories from the headline indicator. Yet their frequent mention suggests that they remain key sources of relative price changes – especially evident for energy (red line) at the start of the war in Ukraine in 2022 and the Middle East conflict in 2026. Second, central banks also frequently refer to services excluding housing (black line), a measure often seen as more closely linked to domestic cost dynamics and persistence. Indeed, attention to both services and housing intensified during the pandemic inflation surge.
Taken together, these patterns are consistent with the view that central banks complement their communication on headline and core inflation with item‑specific discussion to explain contemporaneous inflation dynamics.
Two additional forces could also have contributed to the growing prominence of core inflation in monetary policy reports: the strengthening of monetary policy frameworks and peer effects in central bank communication. Regarding the first factor, inflation targets became more precisely specified over the period, even as the frameworks around them retained some flexibility (Borio and Chavaz (2025)). At the same time, central banks have sought to become more transparent (Dincer et al (2022)). A central bank held to a more precise objective and required to explain itself more fully has reasons to give more weight to its communication. As the need to explain inflation dynamics beyond the behaviour of headline inflation increased, central banks might have responded by referencing core inflation more frequently in their publications. Regarding the second factor, practices adopted by one institution often spread to others, in both communication and other aspects of central banking (Horvath (2020)). For instance, if some central banks start reporting more extensively on underlying price pressures, others may follow, either because it is deemed valuable or because straying from an emerging practice could prove costly.
The core inflation measures central banks cite
Having established that central banks are communicating more about core inflation, we turn to the question of which core measures they use. Because the properties of each metric involve trade-offs (eg between ease of communication and statistical sophistication), it is not possible to know, a priori, which one central banks would prefer. We thus again rely on the large language model. It classified each cited core measure into one of six categories and recorded the frequency of each measure.
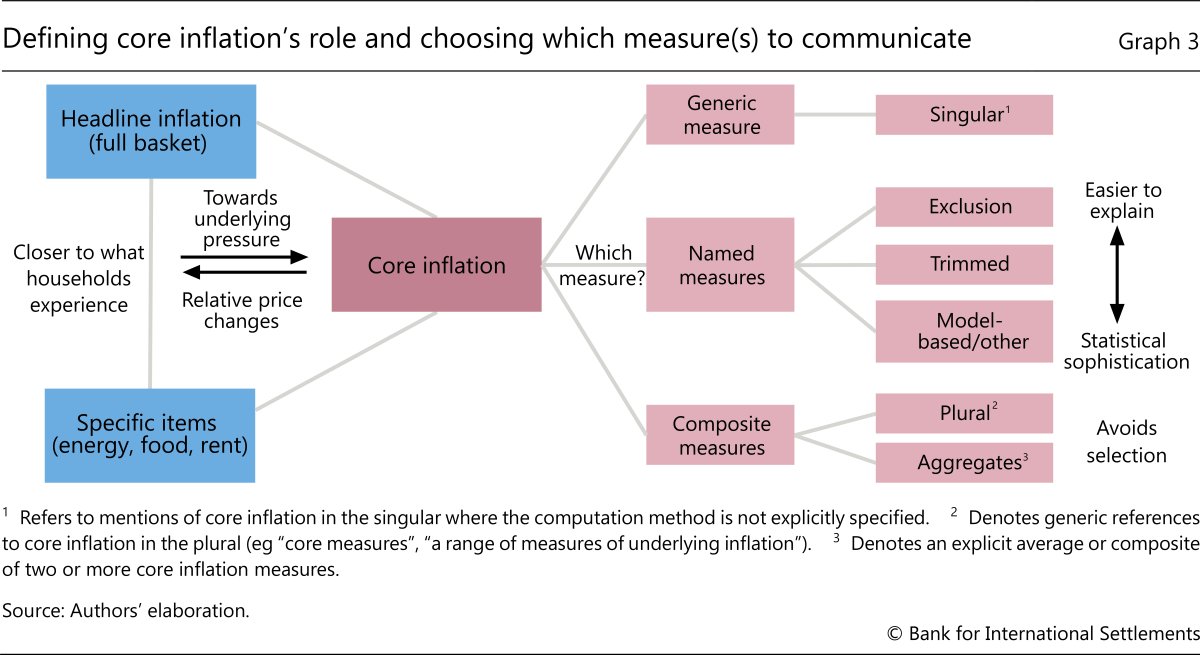
The six core inflation categories are as follows (Graph 3): (i) generic core inflation in the singular – references to core inflation that do not specify a particular computation method; (ii) exclusion-based measures – headline inflation excluding pre-set items (typically but not necessarily food and energy); (iii) trimmed indicators – measures that remove the largest price changes in each period (the share of the consumption basket removed as each central bank considers appropriate); (iv) “other” measures – those not included in the previous two groups (eg double-weighted indices or principal component-based measures); (v) aggregates of core indicators – explicit composites of multiple core metrics (eg average of core inflation metrics); and (vi) generic core in the plural – references to a range or suite of core measures without detailing specific methods.6
During the pre-pandemic period of 2010–19, central banks progressively broadened the range of core inflation measures referenced in their communications. They assembled a portfolio of measures instead of selecting a single preferred indicator. This broader adoption shows in two dimensions: the increased proportions of central banks citing core measures across categories (Graph 4.A and 4.B), and the diversification across categories within monetary policy reports (Graph 4.C). While exclusion-based measures remained the principal gauge throughout the period, the use of trimmed means increased considerably. From a low base, aggregates of core indicators gained a more visible foothold in central bank communications. In parallel, references to core inflation in the plural became substantially more prevalent.
The predominance of exclusion-based measures is unsurprising because, apart from being the first core inflation metric to be introduced, they are relatively simpler to compute and communicate. The search for an indicator insulated from the pronounced fluctuations in energy and food prices of the 1970s led to the measure that excludes those two categories (Gordon (1975)), and it has remained the reference point ever since.7 The measure has probably persisted in communication because it is transparent to readers and does not change with new incoming data. However, it may still fluctuate in response to the volatility of the items it does include. Central banks have the flexibility to decide which categories to exclude, typically focusing on those considered most volatile when the measure is established. However, once this choice is made, it becomes fixed: the excluded categories remain unchanged, even if a different included category emerges as the primary source of relative price volatility.
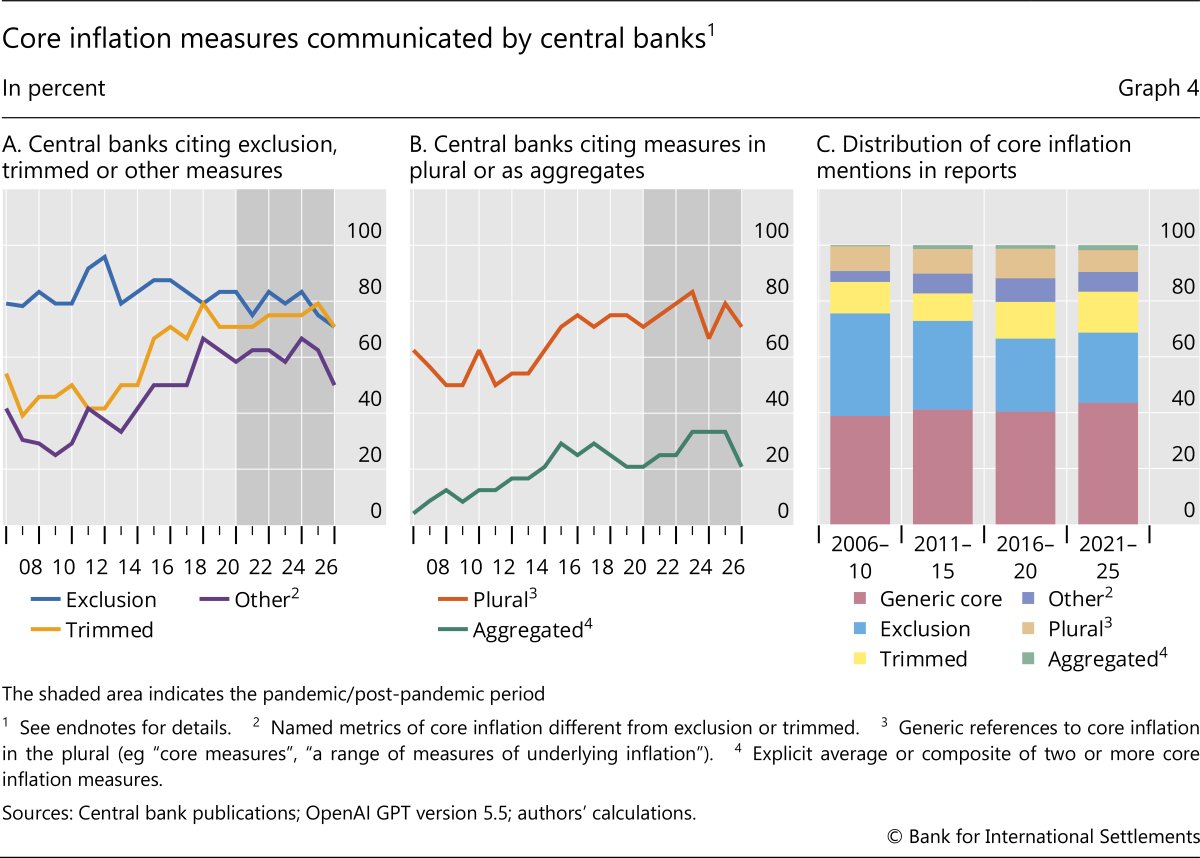
The main drawback of exclusion-based measures – that they remove only a set of items fixed in advance – could have driven central banks to rely more on trimmed means. A trimmed mean, introduced in the literature much later than exclusion-based metrics, removes the largest price changes of each period, rather than fixing the exclusions in advance (Bryan and Cecchetti (1994)). It therefore adapts as new sources of relative price change emerge. Once the largest price changes are removed, those of the remaining items can be interpreted as a measure of generalised price movements. However, a trimmed mean is harder to explain, precisely because the omitted items change every month.
The search for better estimates of underlying price pressures may have led central banks to broaden their indicator sets to include more statistically sophisticated measures (our “other” category).8 However, their presence is still limited in central bank publications, probably reflecting a drawback that matters more for communication than for analysis: explaining their construction is often not straightforward, and historical readings can be substantially revised as new data become available (see Sullivan (2022) for an example using Canadian data). The accumulation of core inflation measures can be understood as a response to a fundamental identification problem: underlying price pressures are not directly observable, and a wider set of metrics may offer more information about or greater confidence in how those pressures are behaving. Concordant readings across metrics increase confidence that the message is robust. But this accumulation brings its own communication challenges. Metrics can send conflicting signals, leaving open the question of how a central bank should interpret them. It also raises the question of which measure the central bank prioritises, and why. If that emphasis shifts over time, it may be seen as cherry-picking, at the cost of credibility. And where central banks aggregate multiple metrics into a single composite – whether to simplify communication or to pursue desirable statistical properties (Carlomagno et al (2023)) – the result can become a black box for the audience. While specialist audiences are better equipped to interpret a broader set of indicators, central banks will need to reframe their messages for the public to be more direct and streamlined.
The increase in the use of core inflation in central banks’ communication documented in this article raises the question of what purpose it serves.
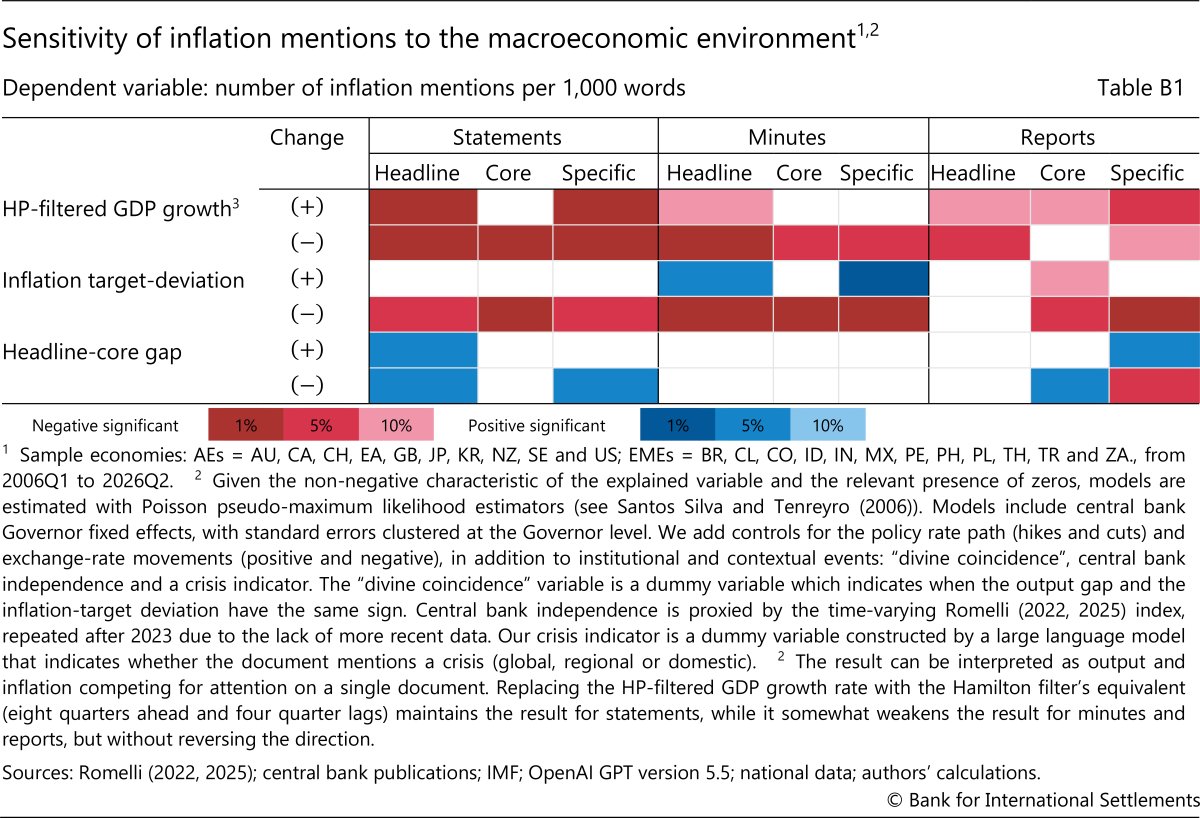
In the econometric exercise, for each document type we estimate the intensity with which it mentions headline, core and item-specific price variations on average. We employ regression models with quarterly data from the first quarter of 2006 to the second quarter of 2026 and central bank Governor fixed effects to control for changes in communication style. The dependent variable is the quarterly average number of mentions to each inflation concept divided by the respective document’s word length. Key explanatory variables include the deviation from potential output growth rate, that of inflation from target and the gap between headline and core inflation (defined here as excluding food and energy from the overall basket).
Results show that communication responds to macroeconomic conditions (). In particular, stronger deviations from the potential growth rate (up or down) reduce the relative space devoted to the discussion of inflation. In contrast, inflation deviations from target exhibit asymmetric effects depending on their sign and the document type: when inflation increases above target, minutes contain more emphasis on headline inflation and item-level price changes; when inflation falls below target, overall inflation discussion tends to decrease – strongly so in statements and minutes, across all three measures, and for core and item-level price changes in monetary policy reports (MPRs). This suggests that central banks are inclined to reduce mentions of inflation in their communication when it drifts further below target.
Divergence between headline and core inflation influences which measure central banks prioritise. When headline inflation rises above target, statements place greater emphasis on the headline measure, and MPRs expand item-level discussion – consistent with using components to explain the volatility behind elevated headline readings. Conversely, when core inflation exceeds headline inflation and the gap between the two measures widens, MPRs increase their focus on core inflation and reduce item-level detail, while statements raise headline and item-level emphasis. This indicates that larger divergences in either direction heighten the importance of inflation in statements, while prompting measure-specific shifts in MPRs.
Overall, the econometric exercise shows that the emphasis central banks place on inflation in their communications evolves with macroeconomic conditions. Additionally, depending on whether headline inflation deviates above or below the target, there is notable asymmetry. This may reflect the contrast between negative supply shocks driving inflation higher and structural economic weaknesses pushing it lower – two forces that suggest fundamentally different origins and solutions for inflation. Finally, as the absolute size of the headline-core gap increases, so does the frequency with which inflation metrics are mentioned, confirming the influence that core inflation (or food and energy shocks) has on inflation communication by central banks.
Conclusion
The review of central bank communications about core inflation presented in this article reveals two clear trends. First, references to core inflation have become increasingly prevalent. Second, the set of core measures under discussion has broadened. These developments indicate that central banks regard communication on core inflation as valuable.
However, the expanding suite of core inflation indicators comes with a range of communication challenges. Instead of providing a straightforward diagnostic, central banks risk conveying an overly complex message. Specialist audiences are well equipped to engage with more technical communication, and the depth and rigour of such analysis are important for institutional credibility. Nonetheless, these audiences need to be addressed with precise definitions, transparent methodologies and a clear articulation of how signals are interpreted. The broader public, by contrast, may benefit from concise messages anchored in the headline target and the central bank’s mandate. Explanations of the principal drivers of high inflation outcomes, especially in salient goods and services items, remain essential.
In a world more prone to shocks, core inflation becomes even more important (Mendes (2025)). Price dynamics will always be subject to disturbances, which appear to have become more frequent (Maechler (2024)), as witnessed during the Covid-19 pandemic, the rise in geopolitical tensions from the war in Ukraine, the return of trade tariffs and the Middle East conflict. These shocks triggered repeated supply side disruptions, which will continue to test the clarity of central bank communication on inflation and its drivers.
Identifying underlying price pressures is inherently uncertain, which makes continued innovation in core inflation measures both unavoidable and desirable. Hence, renewed focus on communication on core inflation could be warranted, particularly on how inflation is explained to different audiences. Improved communication can, in turn, strengthen central bank credibility and help to achieve policy objectives.
Annex A: Country heterogeneity in core inflation measures
Annex B: reading the documents via the large language model (LLM)
1 The views expressed in this article are those of the authors and not necessarily those of the Bank for International Settlements, its member central banks, the Federal Reserve Bank of Dallas or the Federal Reserve System. We thank Matthieu Chavaz, Gaston Gelos, Marco Lombardi, Benoît Mojon, Richhild Moessner, Fernando Perez-Cruz, Daniel Rees, Frank Smets, Taejin Park and Andreas Schrimpf for helpful comments. Brian Roque and Pablo Tomasini provided excellent research assistance. The authors acknowledge the use of artificial intelligence in research assistance and editorial refinement. Responsibility for all errors remains with the authors.
2 The proliferation of core inflation measures may reflect that price pressures relevant for the medium-term path of inflation are not directly observable, and that there is no generally accepted model for computing core inflation. One argument central banks use to justify the selection of a particular core inflation metric over others is its superior predictive power for headline inflation. Nevertheless, central banks typically base their inflation forecasts on more sophisticated multivariate models. Core inflation measures may serve as an interim guide to where headline inflation is heading.
3 The 11 AEs are Australia, Canada, the euro area, Hong Kong SAR, Japan, Korea, New Zealand, Sweden, Switzerland, the United Kingdom and the United States. The 13 EMEs are Brazil, Chile, Colombia, India, Indonesia, Malaysia, Mexico, Peru, the Philippines, Poland, South Africa, Thailand and Türkiye.
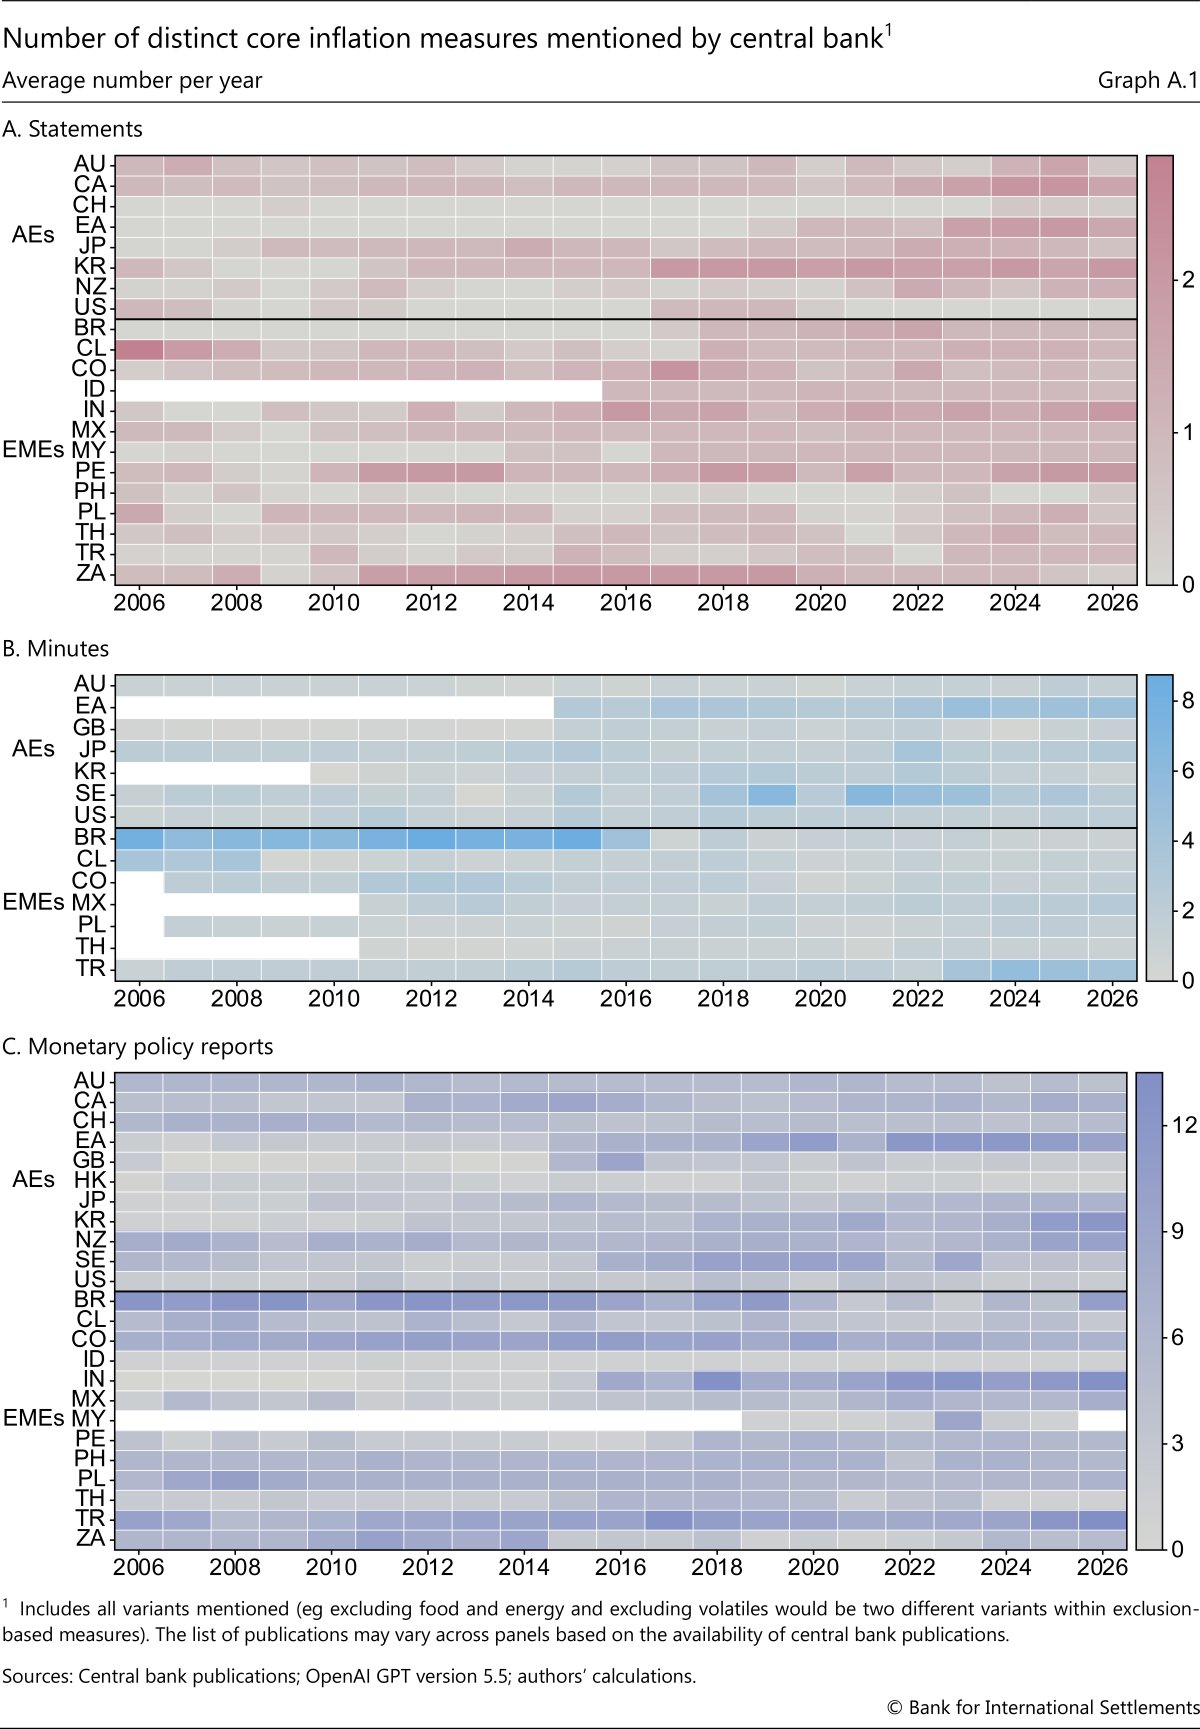
4 Annex A shows the number of distinct core inflation measures mentioned by each central bank.
5 The fact that core inflation is more closely linked to domestic factors that central banks can influence may have further increased their focus on such indicators (Auer et al (2024)).
6 We do not infer the method if it is not explicitly stated where the reference to core inflation is found in the document. Such references are classified as generic core, in either the singular or the plural.
7 Conceptually, when the most volatile prices adjust quickly, excluding them yields an index that better tracks the sticky part of inflation. In models with heterogeneous price stickiness (eg Aoki (2001)), the welfare‑optimal policy is to stabilise inflation in the sticky price sector and let flexible prices absorb relative shocks – providing a rationale for exclusion‑based core inflation measures.
8 The academic literature and central bank analysis have sought to guide the selection of core inflation measures by properties such as smoothness, convergence of headline inflation and predictive power for future headline inflation (see eg Ehrmann et al (2018)). The appropriate criterion remains debated. In particular, if forecasting headline inflation is the sole objective, more sophisticated methods that utilise broader information sets tend to outperform traditional core measures (Wynne (2008)). Fundamentally, there is no economic theory prescribing how core inflation should be calculated, nor can any approach be deemed definitively correct (Wynne (2008)).
Amaral, E, T Ehlers, I Shim and A Tombini (2025): “Monetary policy decision-making and communication under high uncertainty: insights from a survey of central banks in the Americas and beyond”, BIS Papers, vol 163.
Americo, A, D K G de Araujo, J Damp, S Nilsen, D Rees, R Schmidt and C Schmieder (2025): “Inflation cycles: evidence from international data”, BIS Working Papers, no 1264.
Aoki, K (2001): “Optimal monetary policy responses to relative‑price changes”, Journal of Monetary Economics, vol 48, no 1.
Auer, R, M Pedemonte and R Schoenle (2024): “Sixty years of globular inflation: a post GFC update”, BIS Working Papers, no 1189.
Bank for International Settlements (BIS) (2022): “Inflation: a look under the hood”, Annual Economic Report 2022, Chapter II.
Borio, C and M Chavaz (2025): “Moving targets? Inflation targeting frameworks, 1990–2025”, BIS Quarterly Review, March.
Bryan, M and S Cecchetti (1994): “Measuring core inflation”, in N Mankiw (ed), Monetary Policy, University of Chicago Press.
Carlomagno, G, J Fornero and A Sansone (2023): “A proposal for constructing and evaluating core inflation measures”, Latin American Journal of Central Banking, vol 4, no 3.
Dietrich, A (2024): “Consumption categories, household attention, and inflation expectations: implications for optimal monetary policy”, Journal of Monetary Economics, vol 147, 103594.
Dincer, N, B Eichengreen and P Geraats (2022): “Trends in monetary policy transparency: further updates”, International Journal of Central Banking, vol 18, no 1.
Ehrmann, M, G Ferrucci, M Lenza and D O’Brien (2018): “Measures of underlying inflation for the euro area”, ECB Economic Bulletin, issue 4.
Gordon, R (1975): “Alternative responses of policy to external supply shocks”, Brookings Papers on Economic Activity, no 1.
Horvath, R (2020): “Peer effects in central banking”, IMF Economic Review, vol 68.
Maechler, A (2024): “Monetary policy in an era of supply headwinds – do the old principles still stand?”, speech at the London School of Economics, London, 2 October.
Mendes, R (2025): “Underlying inflation: separating the signal from the noise”, speech at the Ivey Business School, London, Ontario, 2 October.
Romelli, D (2022): “The political economy of reforms in central bank design: evidence from a new dataset”, Economic Policy, vol 37, no 112.
——— (2025): “Trends in central bank independence: a de-jure perspective”, in E Farvaque and P Stanek (eds), Are central banks still conservative?, Edward Elgar Publishing.
Santos Silva, J M C and S Tenreyro (2006): “The log of gravity”, Review of Economics and Statistics, vol 88, no 4.
Sullivan, E (2022): “Examining recent revisions to CPI-common”, Bank of Canada Staff Analytical Note, no 2022-15.
Wynne, M (2008): “Core inflation: a review of some conceptual issues”, Federal Reserve Bank of St Louis Review, May/June.
Graphs 1, 2 and 4: The sample covers of 24 economies. AEs = AU, CA, CH, EA, GB, HK, JP, KR, NZ, SE and US. EMEs = BR, CL, CO, ID, IN, MX, MY, PE, PH, PL, TH, TR and ZA.
Graph 1.A: For each year, the lines represent the percentage of documents in the sample of countries that cited at least one core inflation measure.
Graph 2.A: For each year, all mentions of core inflation by central banks in monetary policy reports are divided by all corresponding references to headline inflation, and all core inflation citations are divided by all item-specific inflation mentions.
Graph 2B: Sensitivity calculated as the β coefficient in yc,q = αc + βInflationc,q + εc,q, where αc is a central bank fixed effect and y is the log of mentions of inflation; information at the central bank-quarter level. Calculated for monetary policy reports between 2006 and 2025, excluding MY and TR.
Graphs 4.A and 4.B: For each calendar year, the lines represent the percentage of central banks that cited at least one core inflation measure from the specified group in at least one statement, minutes document or monetary policy report.