Capital and liquidity regulations
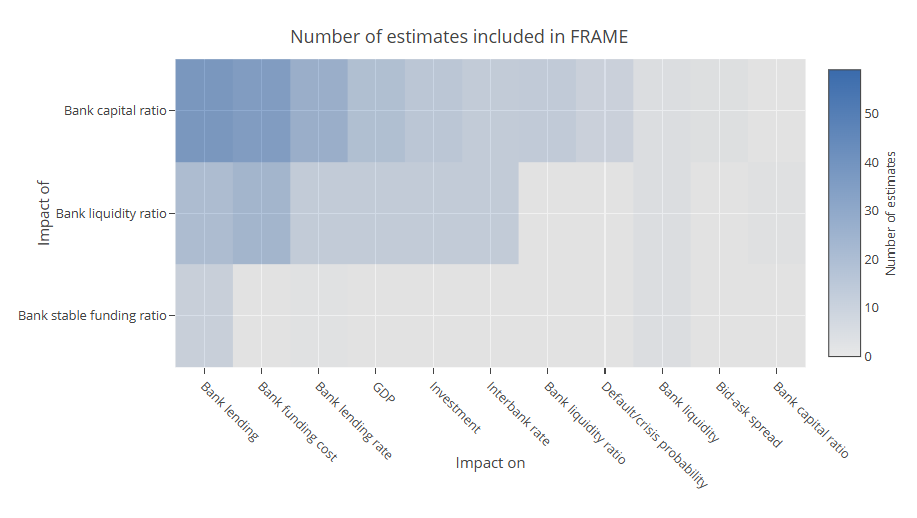
FRAME records quantitative impact estimates of Basel III capital and liquidity regulations (including those affecting banks' liquidity coverage and stable funding) on more than 10 economic and financial variables (see chart). The number of records ranges from less than 10 for the effects of stable funding regulation on GDP to more than 50 for the effect of capital regulation on bank lending. The repository also includes the references and hyperlinks to the studies underlying the estimates.
See the BIS Quarterly Review special feature "Impact of financial regulations: insights from an online repository of studies".
Number of estimates included in FRAME
By Frederic Boissay, Stijn Claessens and Alan Villegas.
The views expressed in the studies referenced in FRAME are those of their authors and do not necessarily reflect ours or those of the BIS. We are nonetheless responsible for any error or omission in the reporting of those studies.

Literature and impact estimates
Documents & notes
| Terms and items | Notes |
|---|---|
| Regulatory ratio | Refers to the bank's balance sheet ratio subject to the regulatory requirement (eg capital ratio, liquidity ratio, stable funding ratio) of which the study assesses the impact. |
| Long-term impact versus transition | The estimate corresponds to the transition towards higher regulatory standards when the impact estimate is that of a change of the regulatory ratio (ie a flow effect). In the case of capital regulation, for example, this would be the impact of banks raising their capital ratio by 1 percentage point. Such an estimate is typically derived from the time series dimension of the data. The estimate is a long-term impact when it is that of a higher level of the regulatory ratio (ie a stock effect). In the case of capital regulation, for example, this would be the impact of the banks' capital ratio being 1 percentage point higher. Such an estimate is typically derived from the cross-sectional dimension of the data. |
| Regulatory ratio - detail | In the case of an empirical regression, this would be the explanatory/independent variable of interest, as it appears on the right-hand side. In a macro-model, this is typically the regulatory parameter. If the effect is that of a transitory change (shock), a variation (eg D Regulatory ratio) is reported. If it is a permanent change, a level is reported (eg Ln(Regulatory ratio)). |
| Target | Refers to the economic variable on which the study assesses the impact. |
| The target is a level/growth rate | In the case of a linear regression, the target is a growth rate if the dependent variable on the left-hand side is a log variation (eg D Ln(Target)), or a level if the dependent variable is a level (eg Ln(Target)). If the Target is a growth rate, the impact is reported as a variation of the growth rate, in percentage points. If it is a level, the impact is reported as a growth rate, in per cent. |
| Target - detail | In the case of an empirical regression, this is typically the dependent variable, as it appears on the left-hand side of the regression. |
| Actual or minimum regulatory ratio | Refers to the type of regulatory ratio considered in the study. It is a minimum regulatory ratio if the study is on the effects of (a change in) minimum regulatory requirements, and an actual regulatory ratio if the study is on the effects of (a change in) the actual/observed regulatory ratio (or a proxy thereof). |
| Mean of the regulatory ratio | This is the mean of the regulatory ratio over the estimation sample. As the estimates are local and correspond to marginal effects/elasticities, this information gives a sense of how the marginal effect varies with the level of the regulatory ratio. |
| Statistical significance | This is a breakdown of the impact estimates, depending on whether they are statistically significant (ie their t-stat is above 2 in absolute value) or not. The t-stat is computed using the impact estimate and standard deviation, whenever available. It is _N/A_ otherwise. |
| Regime | This is determined by the (sub-)sample period over which the impact has been estimated, ie crisis or normal times. For example, "crisis times" corresponds to the impact estimated on a sample period that coincides with a crisis. In a linear regression, this would be the case if, for example, the regulatory ratio were interacted with a crisis dummy. Otherwise, this would be "normal times". |
| Country | Country or group of countries the study is about. |
| Bank size | Size may be relative, and sample-dependent. |
| Firm size | Size may be relative, and sample-dependent. |
| Methodology | This is the methodology used in the study (eg estimation, calibrated model, theory). |
| Equilibrium type | In most cases, micro-empirical studies would be classified as partial equilibrium. Macro-empirical studies and estimates from general equilibrium macro models would be classified as general equilibrium. |
| Source | This is determined by the editor of the publication, not by the affiliation of the authors. For example, the study is considered academic if it has been published in an academic journal, even if the authors are from a central bank. |
| Peer review | Indicates whether the study has been peer-reviewed, ie published in an academic journal, or not. |
| Horizon | In the case of an empirical regression, this is the average lag of the independent variable. In the case of the steady state analysis of a macro model, this would be a "permanent impact". |
| Year of publication | Year only. |
| Data type | This refers to the structure of the data set used for the analysis. |
| Disclosure statement | Indicates whether the authors of the study had relevant or material financial interests that relate to their analysis (eg research sponsored or commissioned by lobbying groups). |
| Reference within the paper | Indicates where the original impact estimate can be found in the study/paper (table row/column, place in the text, chart, etc). This is for the sake of transparency, and to facilitate users' feedback on possible misreporting. |
| Standardised estimate | This is the outcome of the standardisation formula. This is the impact estimate, as reported in the tab "Distribution of impact estimates". |
| Original estimate | This is the non-standardised impact estimate, as it appears in the study/paper. In the case of a linear regression this is the estimated coefficient. In the case of a non-linear regression, this is the marginal effect. |
| Standardisation | This is the trickiest part of the reporting. It is meant to make the findings of the various studies as comparable as possible. The standardised impact estimate corresponds to the effect of: (i) either a 1 percentage point increase in the regulatory rati" ("transition" option) or (ii) of the regulatory ratio variable being 1 percentage point higher ("long-term impact" option). The difference between (i) and (ii) is that (i) captures a flow - or a transition - effect (eg of an increase in banks' capital ratio), whereas (ii) captures a stock effect (eg of banks' capital ratio being higher). (ii) is typically estimated by exploiting the cross-sectional heterogeneity of the data, whereas (i) is typically estimated by exploiting the time series dimension of the data. The formula is meant to standardise the impact estimates reported in FRAME so that they can be compared. Depending on the target, the effect on the target may be in percentage points (pp), eg in the case of an interest rate or a growth rate; or in per cent (%), eg if the target is a (log-) level. In addition, the impact estimate is annualised whenever possible. In the case of a finite horizon, this means that the impact original estimate (in pp or in %) is simply divided by the adequate length of the horizon (number of years or quarters) to obtain the average annualised impact over the horizon. In the case of an infinite horizon ("permanent effect", eg from a steady state analysis in a macro model), the impact estimate is not annualised, and reported as is. This standardisation formula also holds for the standard error of the impact estimate. |
| Beginning of the sample | Year only. |
| End of the sample | Year only. |
| Standard deviation of the regulatory ratio in the sample | This is the standard deviation of the regulatory ratio over the estimation sample, reported in percentage points. |
| Standardised standard error of the impact estimate | This is the outcome of the standardisation formula. Standardised standard errors give a sense of whether the impact estimates are statistically significant. They can be used in the context of a meta-analysis of the FRAME data (see, eg, Boissay, Cantu, Claessens, and Villegas (2019): "Impact of financial regulations: insights from an online repository of studies", BIS Quarterly Review, March. |