Global systemically important banks (G-SIB): assessment methodology and the additional loss absorbency requirement
The Basel Committee's assessment methodology for G-SIBs requires a sample of banks to report a set of indicators to national supervisory authorities. These indicators are then aggregated and used to calculate the scores of banks in the sample. Banks above a cut-off score are identified as G-SIBs and are allocated to buckets that will be used to determine their higher loss absorbency requirement. The scores and bucket allocations represent the outcome of the mechanistic elements of the G-SIB methodology and include the exercise of supervisory judgement. In the latter case a bank may be in a bucket despite its score being above or below the relevant threshold.
G-SIB dashboard
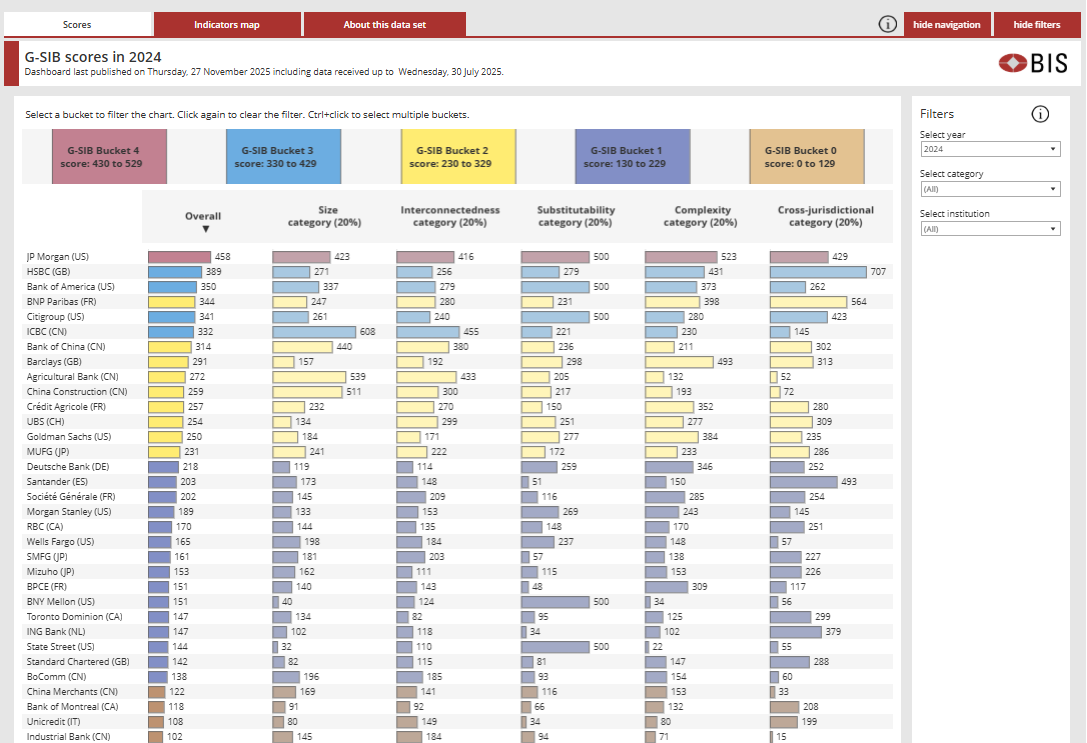
The G-SIB dashboard shows the scores and components for global systemically important banks since 2014.
Updated 27 November 2025
Denominators used to calculate the scores of sample banks
The denominators for the G-SIB exercises are set out in the table below. For the full time series of denominators, see this spreadsheet.
Unit is EUR billions for all denominators.
| Category | Individual indicator | End-2024 | End-2023 | End-2022 | End-2021 | End-2020 | End-2019 | End-2018 | End-2017 | End-2016 | End-2015 | End-2014 | End-2013 |
|---|---|---|---|---|---|---|---|---|---|---|---|---|---|
| Size | Total exposures as defined for use in the Basel III leverage ratio | 112,282 | 104,258 | 102,639 | 98,475 | 85,114 | 81,321 | 75,921 | 73,020 | 75,901 | 72,858 | 73,847 | 66,313 |
| Cross-jurisdictional activity | Cross-jurisdictional claims | 26,525 | 25,716 | 25,129 | 23,708 | 20,515 | 20,445 | 19,128 | 18,208 | 18,678 | 17,759 | 17,235 | 15,801 |
| Cross-jurisdictional liabilities | 21,778 | 21,289 | 21,068 | 20,357 | 16,703 | 16,552 | 16,019 | 15,977 | 16,375 | 15,884 | 15,673 | 14,094 | |
| Interconnectedness | Intra-financial system assets | 11,305 | 10,184 | 10,123 | 9,428 | 7,763 | 7,755 | 7,318 | 6,936 | 7,834 | 8,099 | 7,869 | 7,718 |
| Intra-financial system liabilities | 11,117 | 10,306 | 10,298 | 9,848 | 9,048 | 8,675 | 8,230 | 8,113 | 8,847 | 8,899 | 8,868 | 7,831 | |
| Securities outstanding | 20,204 | 17,419 | 16,084 | 15,441 | 13,340 | 14,694 | 13,084 | 13,510 | 13,337 | 12,499 | 12,214 | 10,836 | |
| Substitutability/ financial institution infrastructure | Assets under custody | 227,864 | 198,624 | 194,784 | 208,572 | 172,492 | 161,345 | 142,327 | 142,600 | 139,936 | 128,342 | 116,181 | 100,012 |
| Payments | 3,448,906 | 3,191,949 | 3,111,952 | 2,798,025 | 2,490,539 | 2,311,955 | 2,141,072 | 2,041,830 | 2,156,974 | 2,262,439 | 2,132,306 | 1,850,755 | |
| Values of underwritten transactions in debt and equity markets | 9,105 | 7,206 | 6,534 | 8,733 | 8,186 | 6,481 | 5,685 | 5,934 | 5,999 | 5,952 | 5,319 | 4,487 | |
| Trading volume fixed income | 242,670 | 234,140 | 217,034 | 184,219 | |||||||||
| Trading volume equities and other securities | 250,876 | 201,144 | 222,946 | 246,644 | |||||||||
| Complexity | Notional amount of over-the-counter (OTC) derivatives | 715,872 | 663,814 | 610,812 | 577,787 | 521,928 | 555,174 | 529,824 | 502,645 | 530,406 | 556,827 | 637,191 | 639,988 |
| Level 3 assets | 756 | 727 | 679 | 624 | 524 | 514 | 464 | 387 | 501 | 586 | 658 | 595 | |
| Trading and available-for-sale securities | 4,445 | 3,872 | 3,616 | 3,705 | 3,389 | 3,431 | 3,120 | 3,281 | 3,442 | 3,255 | 3,281 | 3,311 |
Cut-off score and bucket thresholds (fixed at end-2012)
The cut-off score used for the G-SIB designation is 130bps and the bucket sizes are 100bps. The resulting bucket thresholds are set out in the table below.
It should be noted that banks' scores are an average of the five category subscores with substitutability / infrastructure capped at 500 bps, and that these scores are rounded to the nearest whole basis point before banks are allocated to buckets.
| G-SIB Buckets | |
|---|---|
| Bucket 5 (+3.5% CET1) | 530-629 |
| Bucket 4 (+2.5% CET1) | 430-529 |
| Bucket 3 (+2.0% CET1) | 330-429 |
| Bucket 2 (+1.5% CET1) | 230-329 |
| Bucket 1 (+1.0% CET1) | 130-229 |
High level indicator values and disclosures
The indicator values for each bank in the main sample since 2013 can be found here (unit is in euros). Please note that the G-SIB assessment and data quality review is performed from June to August, and final data used to compute the annual G-SIB scores in August may therefore be submitted by banks after they have disclosed the indicator values, resulting in potential discrepancies. Typically, any differences in the data disclosed by banks and used in the G-SIB calculations have not been material enough to affect the bucket allocations of banks in the G-SIB sample. Nonetheless, it is important to note that data corrections affect not only the score of the reporting bank, but all banks in the sample, given the relative nature of the framework as each bank's values contribute to the denominator. Against this backdrop, the G-SIB assessment methodology requires banks to disclose the accurate figures in the financial quarter immediately following the finalisation of the Committee's G-SIB score calculation (see SCO40.34).
The additional sample includes all banks with a leverage ratio exposure measure greater than €200 billion that are not included in the main sample. These banks do not contribute to the global denominators and are not part of the scoring exercise.
For more information on sample selection, please see the G-SIB assessment methodology set out in chapter SCO40 of the Basel Framework.
G-SIB assessment reporting instructions
The Basel Committee's assessment methodology for global systemically important banks requires a sample of banks to report a set of indicators to national supervisory authorities. These indicators are then aggregated and used to calculate the scores of banks in the sample. Banks above a cut-off score are identified as G-SIBs and are allocated to buckets that will be used to determine their higher loss absorbency requirement.
Set out below are the reporting instructions and reporting templates used to collect data from banks, as well as the year-end and average exchange rates to be used in the calculation of indicator amounts.
This table was last updated on 9 April 2026.
| G-SIB assessment exercise | Reporting instructions | Reporting template | Year-end and annual average exchange rates* |
|---|---|---|---|
| End-2025 | PDF (59 pages) | XLSX | XLSX |
| End-2024 | PDF (60 pages) | XLSX | XLSX |
| End-2023 | PDF (61 pages) | XLSX | XLSX |
| End-2022 | PDF (65 pages) | XLSX | XLSX |
| End-2021 | PDF (57 pages) | XLSX | XLSX |
| End-2020 | PDF (58 pages) | XLSX | XLSX |
| End-2019 | PDF (58 pages) | XLSX | XLSX |
| End-2018 | PDF (56 pages) | XLSX | XLSX |
| End-2017 | PDF (54 pages) | XLSX | XLSX |
| End-2016 | PDF (58 pages) | XLSX | XLSX |
| End-2015 | PDF (45 pages) | XLSX | XLSX |
| End-2014 | PDF (38 pages) | XLSX | XLS |
| End-2013 | PDF (33 pages) | XLS | XLS |
| End-2012 | PDF (29 pages) | XLS | XLS |
* These files should be used as a source of year-end or annual average exchange rates when rates are required to calculate an indicator.