The report sets out the impact of the Basel III framework, including the December 2017 finalisation of the Basel III reforms and the January 2019 finalisation of the market risk framework.
Dashboards now provide an interactive visualisation of the results for credit, market, operational, counterparty credit and credit valuation adjustment risks. These and all other Basel III monitoring dashboards are compiled on a dashboards page.
- As of the end of 2025, Basel III risk-based capital and leverage ratios remained stable for large internationally active banks compared with June 2025.
- The average Liquidity Coverage Ratio (LCR) of Group 1 banks improved slightly, while the Net Stable Funding Ratio (NSFR) decreased slightly.
- The average impact of the Basel III framework on Tier 1 minimum required capital (MRC) for Group 1 banks is +2.2%.
To assess the impact of the Basel III framework on banks, the Basel Committee on Banking Supervision monitors the effects and dynamics of the reforms. For this purpose, a semiannual monitoring framework has been set up for the risk-based capital ratio, the leverage ratio and liquidity metrics, using data collected by national supervisors on a representative sample of institutions in each country. Since the end-2017 reporting date, the analyses have also captured the effects of the Basel Committee’s finalisation of the Basel III reforms.1 This summary is based on aggregate results using data as of 31 December 2025 and compares them with the previous reporting period (June 2025). The Basel Committee believes that the information contained in this summary and the related dashboards will provide relevant stakeholders with a useful benchmark for analysis.
Information considered in the analysis was obtained from voluntary and confidential submissions of data from individual banks and their national supervisors. At the jurisdictional level, there may be ongoing mandatory data collection, which also feeds into this report. Data were included for 149 banks, including 106 large internationally active (“Group 1”) banks, among them 29 global systemically important banks (G-SIBs), and 43 other (“Group 2”) banks.2 Members’ coverage of their banking sector is very high for Group 1 banks, reaching 100% coverage for some countries, while coverage is lower for Group 2 banks and varies by country.
In general, these analyses do not consider any transitional arrangements such as grandfathering arrangements. Rather, the estimates presented assume full implementation of the Basel III requirements based on data as of 31 December 2025. No assumptions have been made about banks’ profitability or behavioural responses, such as changes in bank capital or balance sheet composition, since this date or in the future. Furthermore, the report does not reflect any additional capital requirements under Pillar 2 of the Basel III framework.
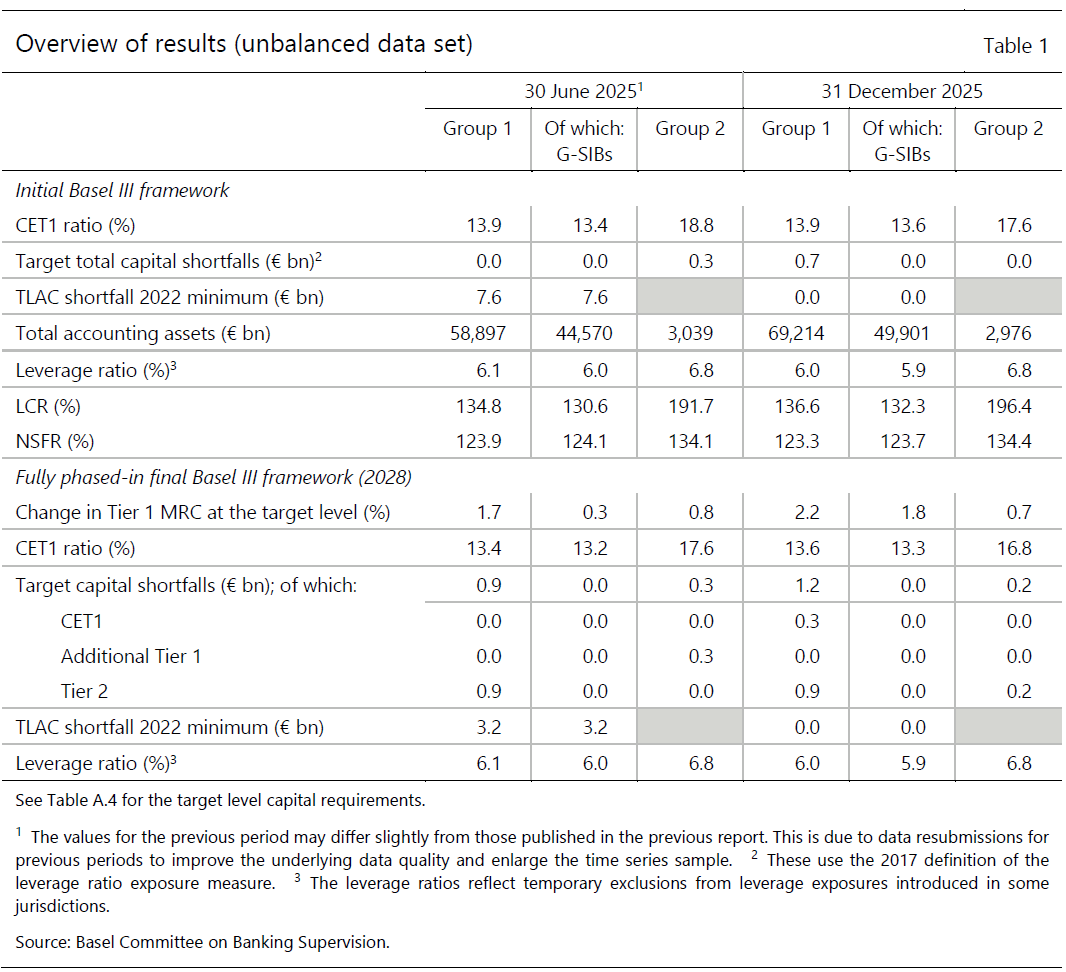
- Compared with June 2025, the average Common Equity Tier 1 (CET1) capital ratio under the current Basel III framework remained stable at 13.9% for the unbalanced sample of Group 1 banks.
- The average impact of the Basel III framework on the Tier 1 minimum required capital (MRC) was 2.2% for Group 1 banks and 1.8% for G-SIBs. The impact of final Basel III standards on Group 1 banks is slightly higher compared with the previous exercise, driven by a bigger sample of banks.
- In contrast, Group 2 banks show an increase of only 0.7% which reflects the fundamental difference in balance sheet composition, business models and regulatory sensitivities relative to their larger, internationally active counterparts.
- Banks in the H2 2025 sample show a cumulative capital shortfall of €1.4 billion under the final Basel III framework.
- The average Liquidity Coverage Ratio (LCR) of Group 1 banks improved slightly by 1.7 percentage points compared with June 2025, due to a contraction in net outflows compared with the previous period. The average Net Stable Funding Ratio (NSFR) decreased slightly (–0.6 percentage points) in the same period because of a smaller decrease in required stable funding (RSF) compared with available stable funding (ASF).
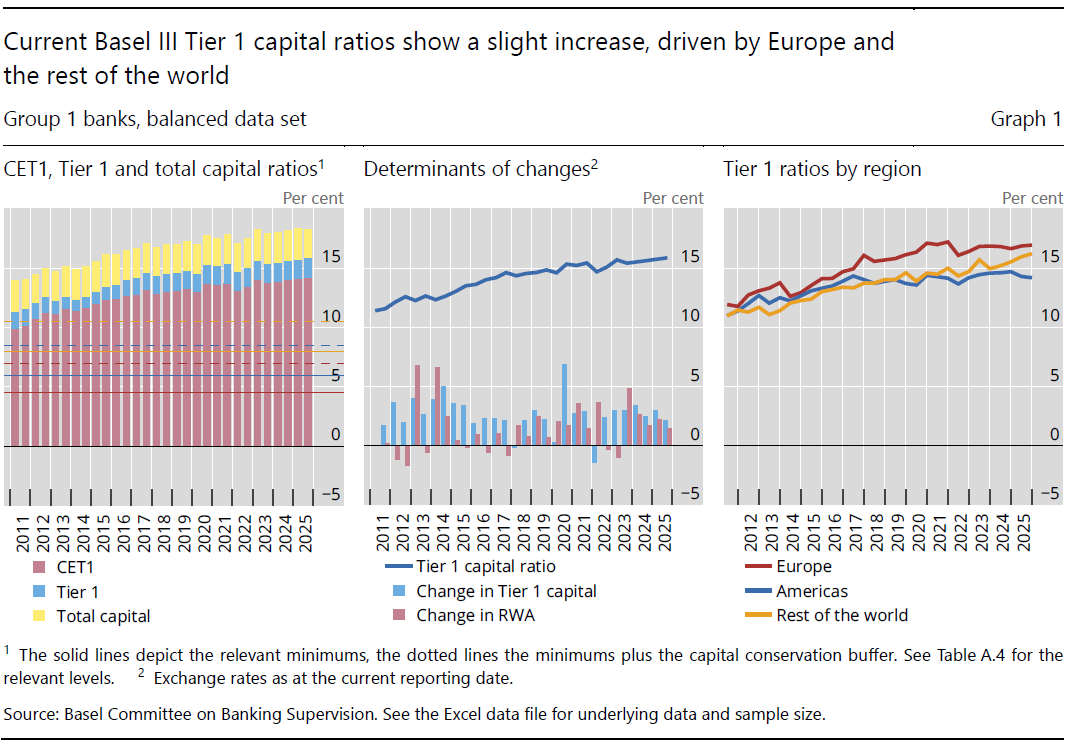
- The balanced data set for Group 1 banks showed a marginal decrease (–0.2 percentage points) in current Basel III total capital ratios in December 2025 in comparison with June 2025, while Tier 1 capital ratios increased slightly in Europe and the rest of the world. This increase was driven by a growth in Tier 1 capital which was outpacing the increase in risk-weighted assets (RWA). The overall CET1 capital ratio for Group 1 banks in the balanced data set was 14.2% in December 2025.
- Europe currently maintains the highest Tier 1 capital ratios relative to the Americas and the rest of the world. Between December 2024 and December 2025, Tier 1 capital ratios in the rest of the world showed an upward trend, while the Americas exhibited the opposite trend over the same period.
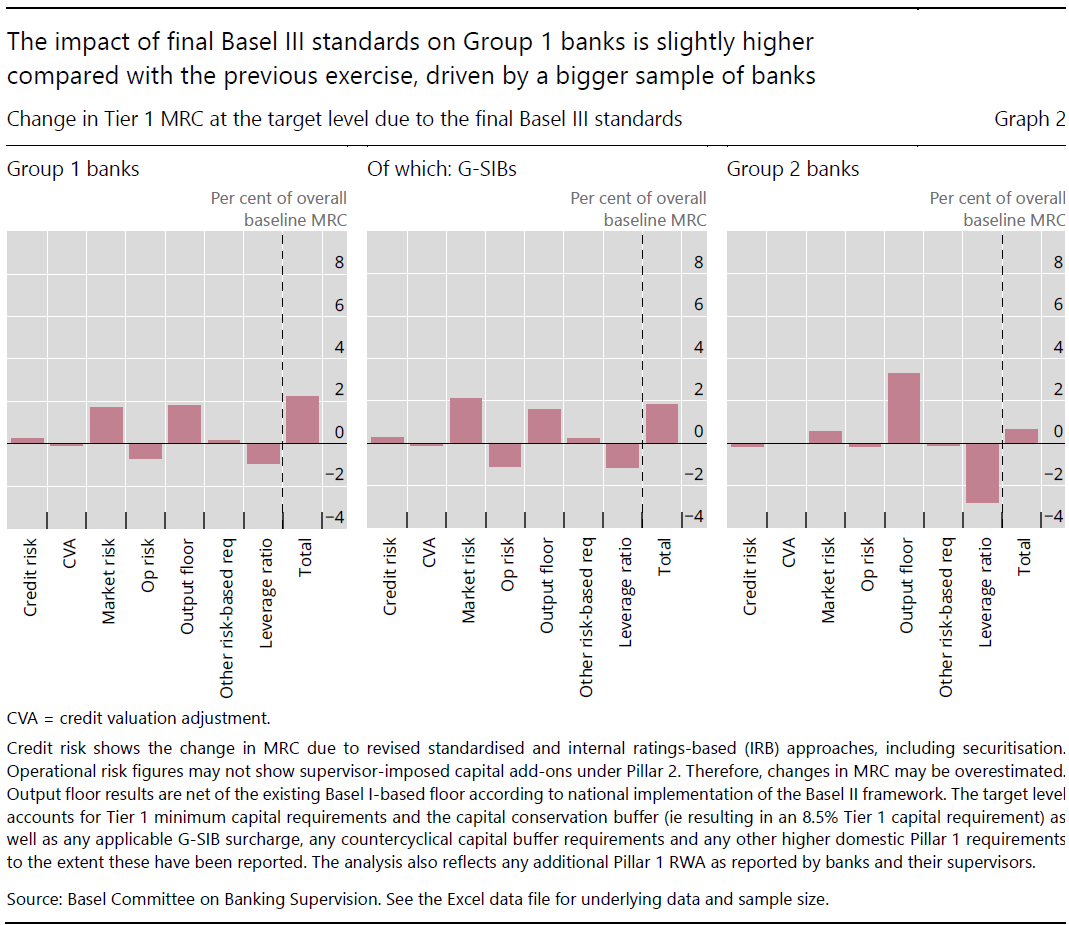
- For Group 1 banks, Tier 1 MRC would increase by 2.2% following the full phase-in of the final Basel III standards. The increase in MRC is underpinned by the incremental impact of the risk‑based requirements of 3.2%, offset by the reduction in leverage ratio requirements by
–1.0 percentage points. The increase in risk-based components is mainly driven by the output floor (+1.9%) and market risk (+1.7%). - The impact on MRC across regions varies for Group 1 banks. There is a low impact for European banks (+0.8%) and the Americas (+1.2%) while the rest of the world exhibits a greater impact (+3.6%).
- For Group 2 banks, the overall 0.7% impact on Tier 1 MRC is driven by a 3.5% increase in the risk‑based measures, stemming mainly from the output floor (+3.3%), which is partially offset by a reduction in leverage ratio MRC (–2.8%).
- This is the second period in which banks in the European Union reported results under their national final Basel III standards for all risk types but market risk. Banks with full implementation of the final Basel III standards for all risk types may still contribute to the change in MRC shown in the impact analysis due to any remaining phase-in arrangements, for example regarding the level of the output floor. Considering the overall report sample of 106 Group 1 banks for the December 2025 reporting period, 102 banks (of which 34 banks for Europe, 16 banks for the Americas and 52 banks for the rest of the world) were included in the Group 1 banks’ impact analysis.
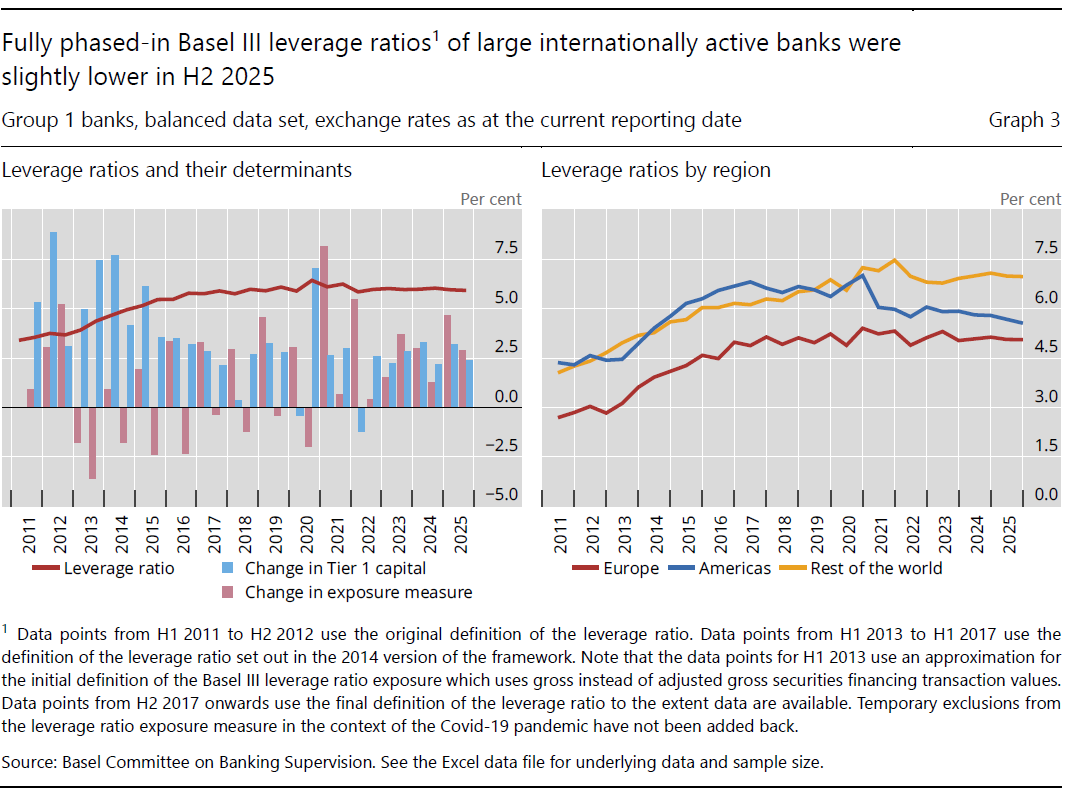
- For the balanced data set of Group 1 banks, leverage ratios have remained flat over the past two years in Europe and the rest of the world, while those in the Americas have gradually declined since peaking in Q4 2020.
- Leverage ratios for Group 1 banks are still lower in Europe (5.1%) than in the Americas (5.6%) and the rest of the world (7.0%).
- For the unbalanced data set at the end-December 2025 reporting date, the average fully phased-in final Basel III Tier 1 leverage ratios are 6.0% for Group 1 banks, 5.9% for G-SIBs and 6.8% for Group 2 banks.
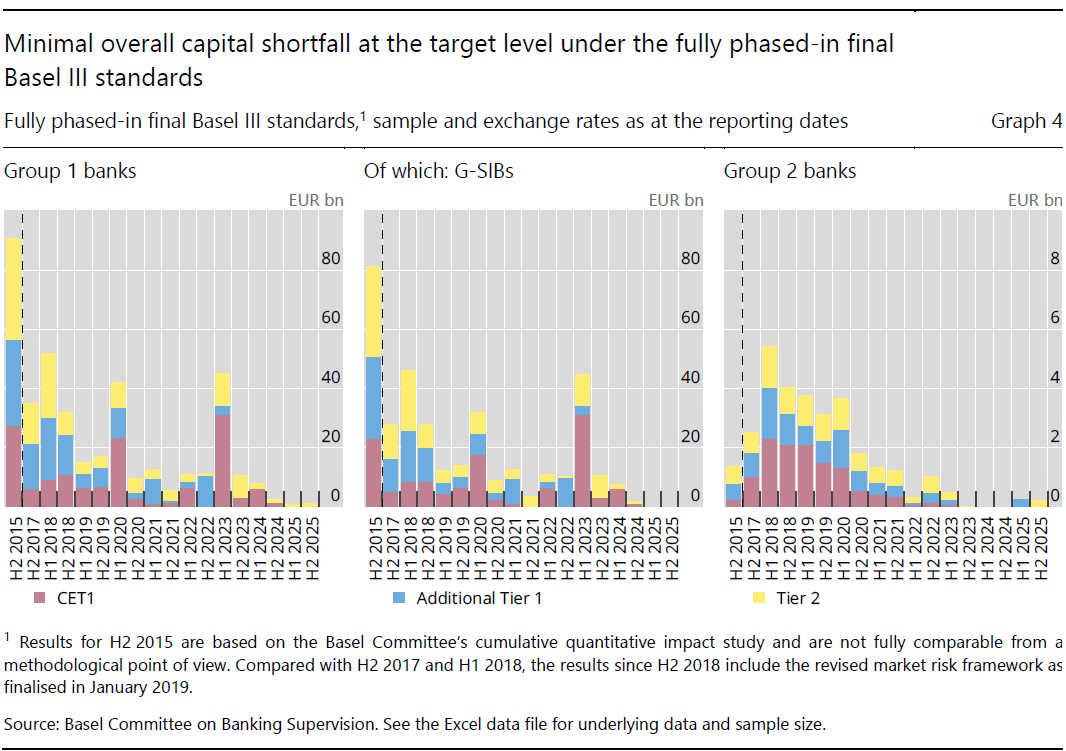
- For this reporting date, non-GSIB Group 1 and Group 2 banks in the sample reported an aggregated regulatory capital shortfall of €1.4 billion.
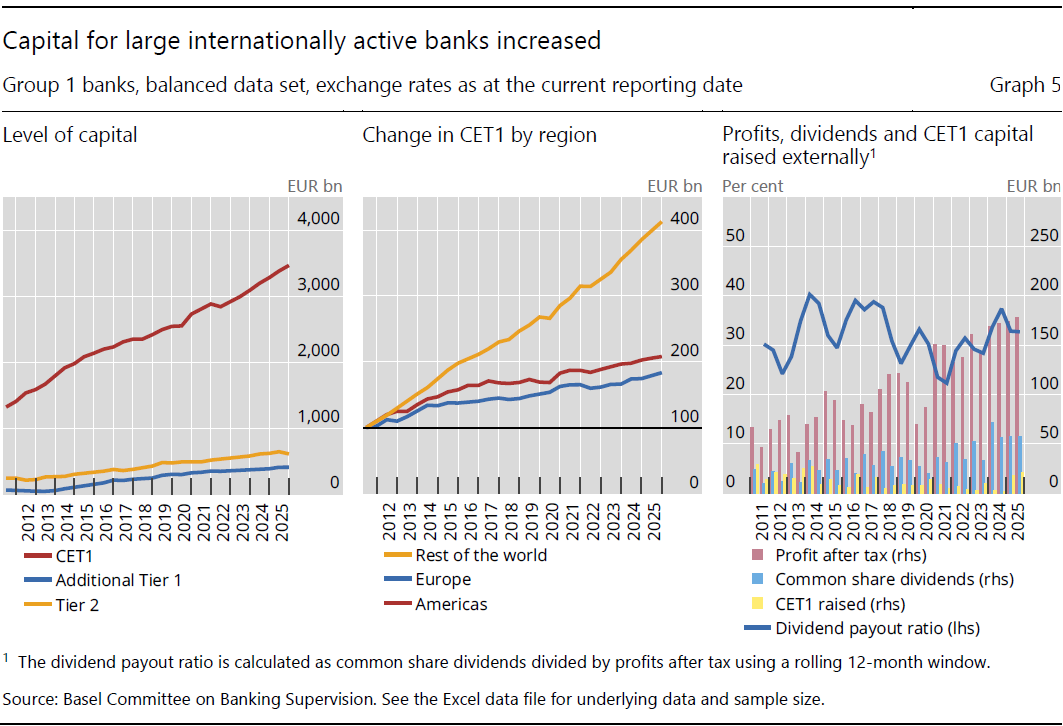
- From end-June 2011 to end-December 2025, the level of Group 1 banks’ CET1 capital increased by 162.5% from €1,320 billion to €3,465 billion. Since end-June 2025, Group 1 CET1 capital has increased by €84.5 billion (or +2.5%).
- Over H2 2025, CET1 capital increased across all regions, with the most notable increment in the rest of the world (+3.2%).
- Overall, profits after tax increased for the Group 1 banks from €174.2 billion to €177.8 billion between June and December 2025. The dividend payout ratio stood at 32.7%.
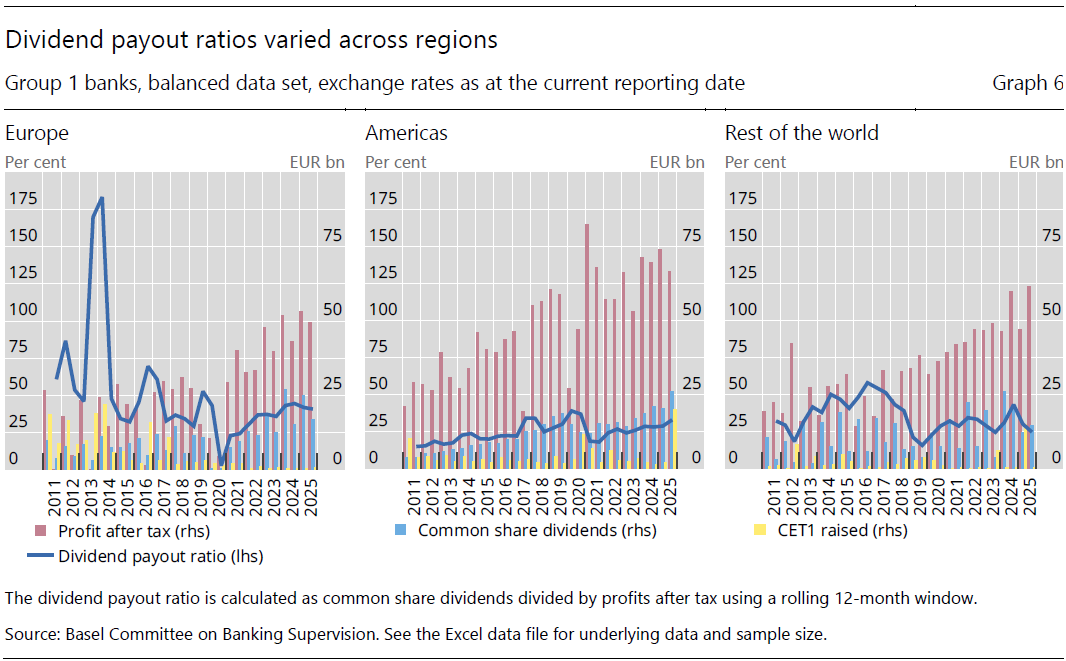
- Annual after-tax profits for Group 1 banks, aggregated over two consecutive reporting dates, rose in Europe (+8.3%) and the rest of the world (+2.3%), while the Americas were broadly unchanged at –0.1% compared with the 12-month period ending December 2024.
- Compared with the previous reporting date, the annual dividend payout ratio has decreased in the rest of the world and in Europe, while it has increased in the Americas. It remains below the record high ratios observed in 2020 in the Americas, while it is at pre‑pandemic levels in Europe and the rest of the world.
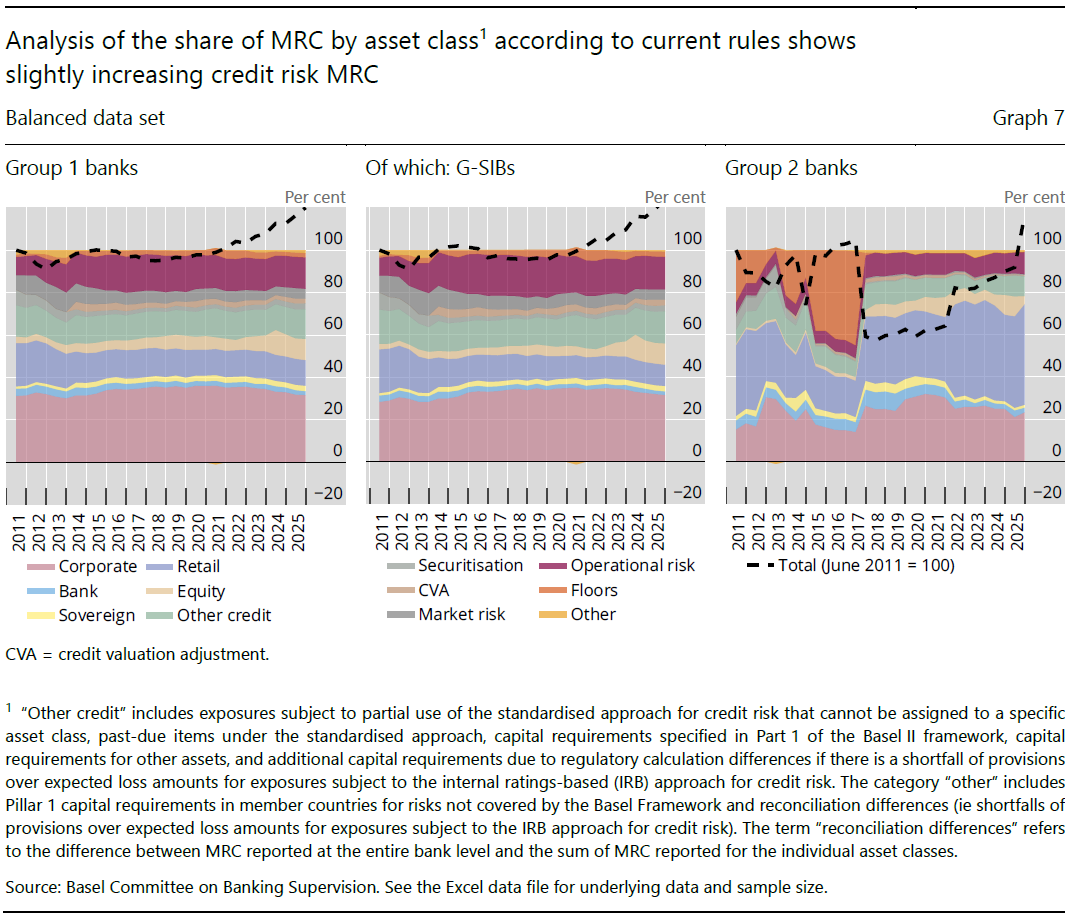
- As of December 2025 and for Group 1 banks, non-securitisation credit risk3 continues to be the dominant portion of overall MRC, on average covering 72.2% of total MRC. Among the non‑securitisation credit risk asset classes, the share of MRC for corporate exposures has returned to the averages between 2011 and 2015 of around 32%. In addition to this, the share of other credit exposure has experienced the biggest increase (+1.1 percentage points) and the share of corporate exposure has experienced the most significant decrease (–1.4 percentage points), in comparison with December 2024.
- The evolution of MRC across CVA and market risk between end-2024 and end-2025 reflects the interplay of structural regulatory drivers and market-driven effects. On a year-on-year basis, the share of CVA rose by 0.1 percentage points which is largely attributable to the first application of the Basel III CVA framework in European Union countries. During the H2 2025, the share of CVA declined by 0.1 percentage points reflecting the natural moderation of the transition effect.
- On the other hand, the share of market risk MRC decreased by 0.2 percentage points between June and December 2025. The decrease reflects easing global financial conditions in the second half of 2025 that reduced market volatility, and in turn, VaR and stressed VaR inputs.
- The share of MRC for securitisation exposures has experienced a steady increase (+0.2 percentage points) between December 2024 and December 2025.
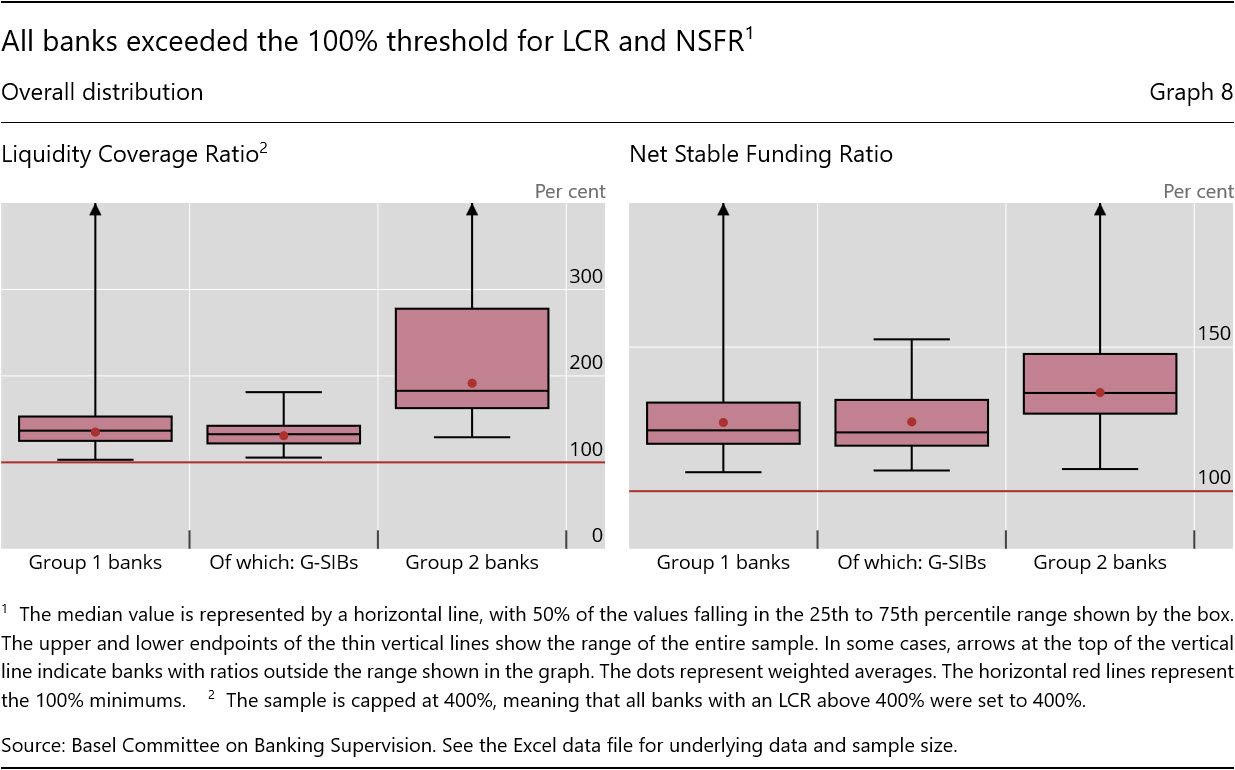
- The weighted average LCR for Group 1 banks was 136.6% and 196.4% for Group 2 banks at end‑December 2025.
- In the current reporting period, all banks reported an LCR above 100%. No bank reported a shortfall since June 2025, while an aggregated €18.3 billion shortfall was reported for three banks in December 2024.
- The weighted average NSFR was 123.3% for Group 1 banks and 134.4% for Group 2 banks at end-December 2025.
- All banks reported an NSFR above 100%.
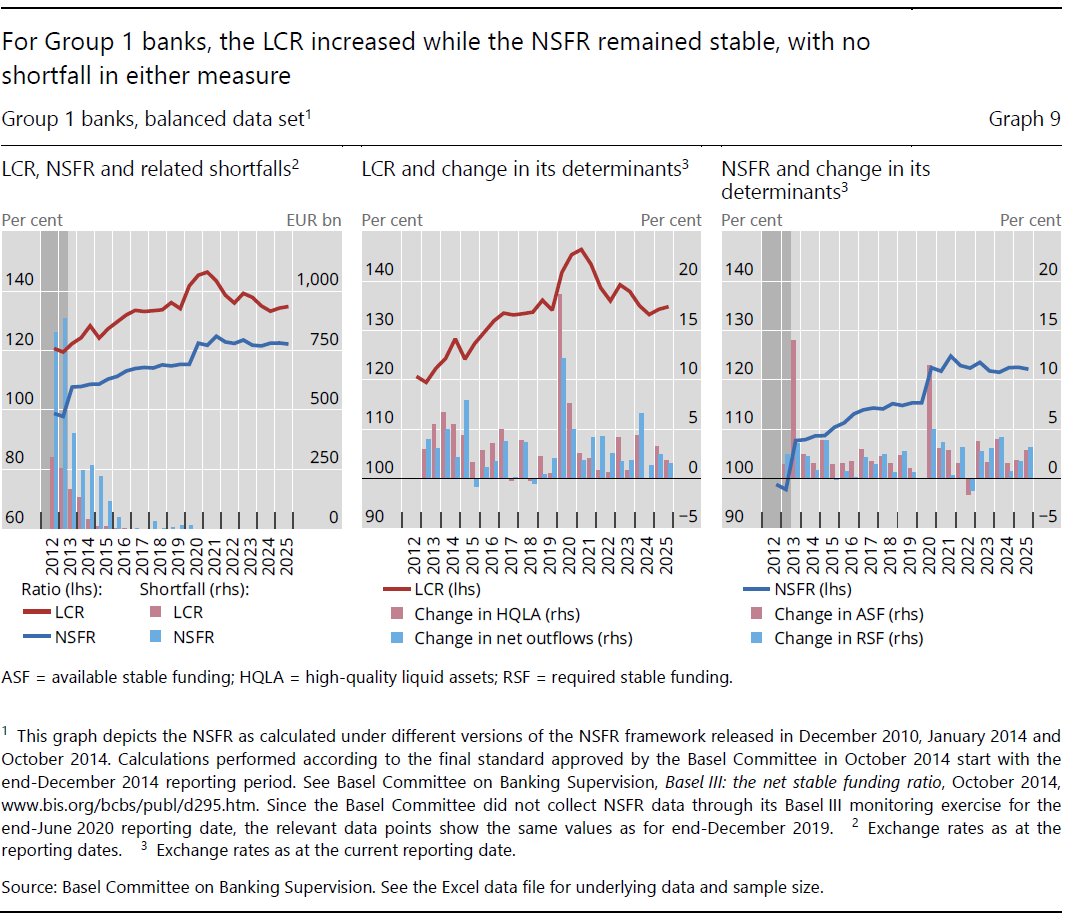
- For a balanced data set of Group 1 banks, all banks met a 100% LCR at end-December 2025. As at end-December 2024 and June 2025, this results in no shortfall. The average LCR for this sample increased to 134.8% at end-December 2025 compared with 134.3% in the previous reporting period.
- There was no aggregate NSFR shortfall for the balanced data set of Group 1 banks. The average NSFR for the same sample of banks remained stable, shifting slightly to 122.1% as of December 2025 from 122.5% in June 2025.
- Both the LCR and NSFR were above pre-pandemic levels at the reporting date.
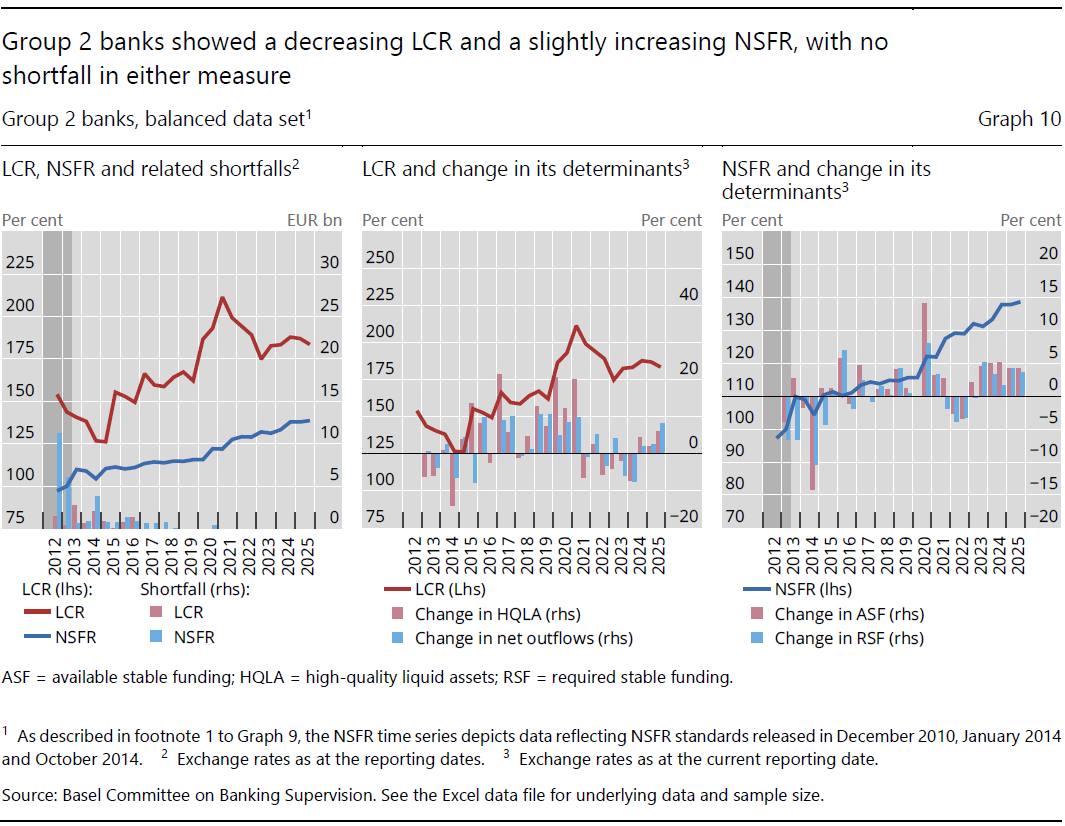
- For a balanced data set of Group 2 banks, there has been no LCR shortfall since June 2017. As on December 2025, the average LCR for the same sample of banks decreased by 3.5 percentage points from the last reporting date to 183.6%. The decline in the LCR is due to a greater increase in net cash outflows compared with the increase in HQLA.
- The aggregate NSFR shortfall also remained at zero for the balanced data set of Group 2 banks. The average NSFR for the same sample of banks increased by 0.8 percentage points in comparison with the previous reporting date to 138.7% in December 2025.
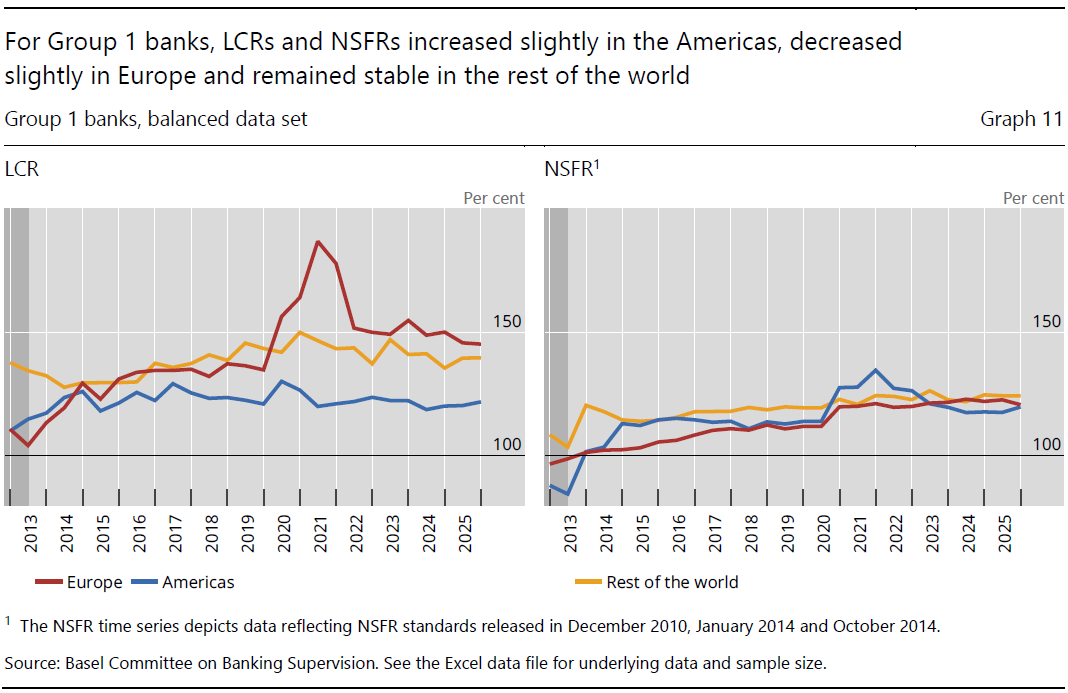
- Since 2020, the weighted average LCRs have consistently remained above 140% in Europe and around 140% in the rest of the world, while the Americas have maintained an average LCR of approximately 120%. This trend has persisted during the current reporting period. However, a more recent decline in the LCR for Europe has been observed. Notably, the previously steady upward trajectory of Europe’s LCR reversed after June 2021.
- At end-December 2025 the weighted average NSFR for Group 1 banks in each of the three regions was well above 100% and stable compared with the previous period. After a significant drop during H1 2022, the NSFR of banks in the Americas continues to slowly revert, reaching 119.8% at December 2025.
3 Footnotes
| 1 | See Basel Committee on Banking Supervision, High-level summary of Basel III reforms, December 2017; Basel Committee on Banking Supervision, Basel III: finalising post-crisis reforms, December 2017. |
| 2 | Group 1 banks are those that have Tier 1 capital of more than €3 billion and are internationally active. All other banks are considered Group 2 banks. Not all banks provided data relating to all parts of the Basel III framework. |
| 3 | Here, non-securitisation credit risk is defined as the sum of corporate, bank, sovereign, retail, equity and other credit, as illustrated in the graph. |