Financing the digital economy: the role of private credit


Financing the digital economy: the role of private credit
Puriya Abbassi explains how private credit helped finance the post-2020 shift to the digital economy.
Surging loan demand from software and technology (tech) firms materially contributed to the post-2020 growth of direct lending, the main type of private credit. The Covid19 pandemic accelerated the shift to the digital economy, increasing tech firms’ funding needs. Private credit, with its model centred on lending against cash flows and intangible assets, was well placed to meet this demand. Tech firms’ share of direct lending doubled to over 40% between 2020 and 2025. Growth was concentrated in US cities with a strong pre-pandemic tech presence, precisely where the shift to the digital economy raised credit demand the most. Tech firm entry and employment subsequently grew more in areas with ample private credit, highlighting how a financial sector adept at financing asset-light borrowers can support innovative firms and growth. Whether the fast growth of the tech sector and private credit are sustainable or ultimately bear risks for financial stability remains an open question.
JEL classification: G21, G23, G32, O33.1
With outstanding loan amounts of almost $2.5 trillion as of 2025, private credit has become an important funding source for non-financial corporations. Its fast growth, often attributed to tighter banking regulation and low policy rates, put the market at the centre of policy discussions about the changing nature of financial intermediation and attendant financial stability risks (IMF (2024); BIS (2026); FSB (2026)).
This article re-examines the drivers of private credit’s recent growth, with a focus on the role of demand from software and technology (tech) firms, and draws implications for the growth of innovative firms. The analysis uses data on direct loans (a major segment of private credit) from 2010 to 2025 for the United States, the largest private credit market globally.
Our findings are as follows.
First, private credit’s lending model was well placed to serve tech firms’ credit demand, which surged after 2020. Aggregate borrowing by tech firms rose from around $22 billion (22% of total private credit) in 2010 to over $1 trillion (44%) by 2025. Growth accelerated markedly after 2020, coinciding with the Covid-19-induced (and still ongoing) structural shift of economic activity towards the tech sector, including in the direction of software and artificial intelligence (AI) firms. Private credit’s lending model is well suited to meet loan demand from such firms: it features bespoke loan terms based on lending against recurring revenue and intangible assets rather than common earnings measures and physical collateral.
- Private credit, focused on lending against cash flows and intangible assets, met the rising credit needs of software and technology (tech) firms’ during the post-2020 shift to the digital economy.
- In US cities with a stronger presence of tech firms, private credit expanded faster after 2020; and where private credit expanded more, firm formation and employment in the tech sector rose accordingly.
- Our findings highlight how a financial sector capable of financing innovative companies can foster job creation and economic growth, offering lessons for other jurisdictions.
Second, regression analyses highlight that tech firms’ surging loan demand has been a key driver of private credit’s rapid growth since 2020. To measure credit demand, we use differences in the concentration of tech firms across US cities, as measured by employment shares. Direct lending followed a similar trajectory across cities before 2020. Afterwards, cities with a higher employment share of tech firms saw a significantly stronger increase compared with those with a lower share. This pattern is consistent with an increase in tech firms’ demand for direct loans. However, narrowing loan spreads and the accompanying shift towards borrowers with weaker fundamentals raise concerns about whether risks and vulnerabilities are fully priced.
Third, where private credit was more ample and ready to meet loan demand, the tech sector expanded more. In particular, cities with a stronger increase in private credit subsequently experienced higher firm formation and employment within and outside the tech sector. This positive association suggests that tech firms with access to readily deployable private capital could better attract funding as demand for their products and services increased. In turn, they expanded their operations by more.
The article informs the broader debate on the role of private credit and non-bank financial institutions (NBFIs). Our findings show that tech firms’ credit demand amid structural change and the ability of private credit funds to meet this demand were important factors in driving the recent growth of private credit. The regulatory and interest rate environments appear to have been less relevant factors in recent years. A relaxation of bank regulation alone is therefore unlikely to materially reverse private credit’s growth. Our findings also underscore how the financial sector’s ability to meet the funding needs of innovative firms can support firm formation and growth. Whether the rapid expansion of the tech sector, facilitated by private credit, is sustainable or may entail risks to financial stability remains an open question.2
The rest of the article is structured as follows. The first section provides an overview of private credit and its lending model. The second documents the growing concentration of private credit in the tech sector. The third analytically explores the link between tech firms’ credit demand and private credit’s growth after 2020. We conclude with a discussion of the implications for financial regulation and growth.
Private credit and its lending model
Private credit generally refers to non-bank credit extended by specialised investment vehicles (“funds”) to small or medium-sized (“middle market”) non-financial firms. Most funds operate as closed-end structures that lock in capital raised from institutional investors for their life cycle (five to eight years). Fund managers draw on committed capital to finance their investments; undrawn committed capital remains off-balance sheet as “dry powder”. The average maturity of loan portfolios matches funds’ life cycles, thereby mitigating liquidity and maturity transformation risks.3
While funds specialise in certain lending strategies, so-called direct lending is the most common. Direct loans are negotiated directly between lenders and borrowers and held on lenders’ balance sheets. This structure enables bespoke covenant arrangements, faster execution and greater flexibility in renegotiation. In contrast, leveraged loans, an alternative source of loan financing for middle-market firms, typically involve multiple lenders in a syndicate, trade on active secondary markets and come with more standardised terms. Direct lending hence differs substantially from other major sources of financing for riskier firms and makes it appealing for borrowers that value flexibility.
Further reading
• The global drivers of private credit
• Retail investors in private credit
• Financing the AI boom: from cash flows to debt
Direct lenders specialise in lending against recurring revenue and intangible assets, while banks rely on common earnings measures or loans collateralised by fixed assets. For various reasons, including regulatory ones, banks prefer loans secured by tangible assets (eg real estate or machinery) and assess a borrower’s financial health based on target profit measures such as earnings before interest, taxes, depreciation and amortisation (EBITDA) (Dell’Ariccia et al (2021); Degryse et al (2025)). Direct lenders instead often take blanket liens, ie claims on a firm’s entire going-concern value, rather than on separable assets, and underwrite against recurring revenue. Such tailored financing benefits firms with scarce tangible collateral and low EBITDA (Block et al (2024); Ivashina (2025)).
Software and high-tech firms are natural borrowers from private credit funds. For example, the assets of firms in the software-as-a-service (SaaS) industry consist mostly of intellectual property, customer relationships and recurring revenue streams. These assets are difficult to seize, value or liquidate in a standard insolvency scenario (Jang et al (2025)). Similarly, private credit has become an important source of financing for the AI boom (Aldasoro et al (2026)).
Beyond these factors related to private credit’s lending model, its broader growth after the Great Financial Crisis (GFC) reflects shifts in the regulatory and macroeconomic environments.4 Post-GFC banking regulation probably reduced banks’ willingness to lend to risky or asset-light firms, which turned to non-bank lenders (Chernenko et al (2022); Davydiuk et al (2024); Doerr et al (2026)). Additionally, banks find lending to private credit funds more attractive than directly lending to middle-market firms, as collateralised loans to private credit funds receive favourable capital treatment (Chernenko et al (2025)). Low policy rates reinforced these trends by incentivising institutional investors to search for yield, steering their portfolios towards private markets (Avalos et al (2025)).
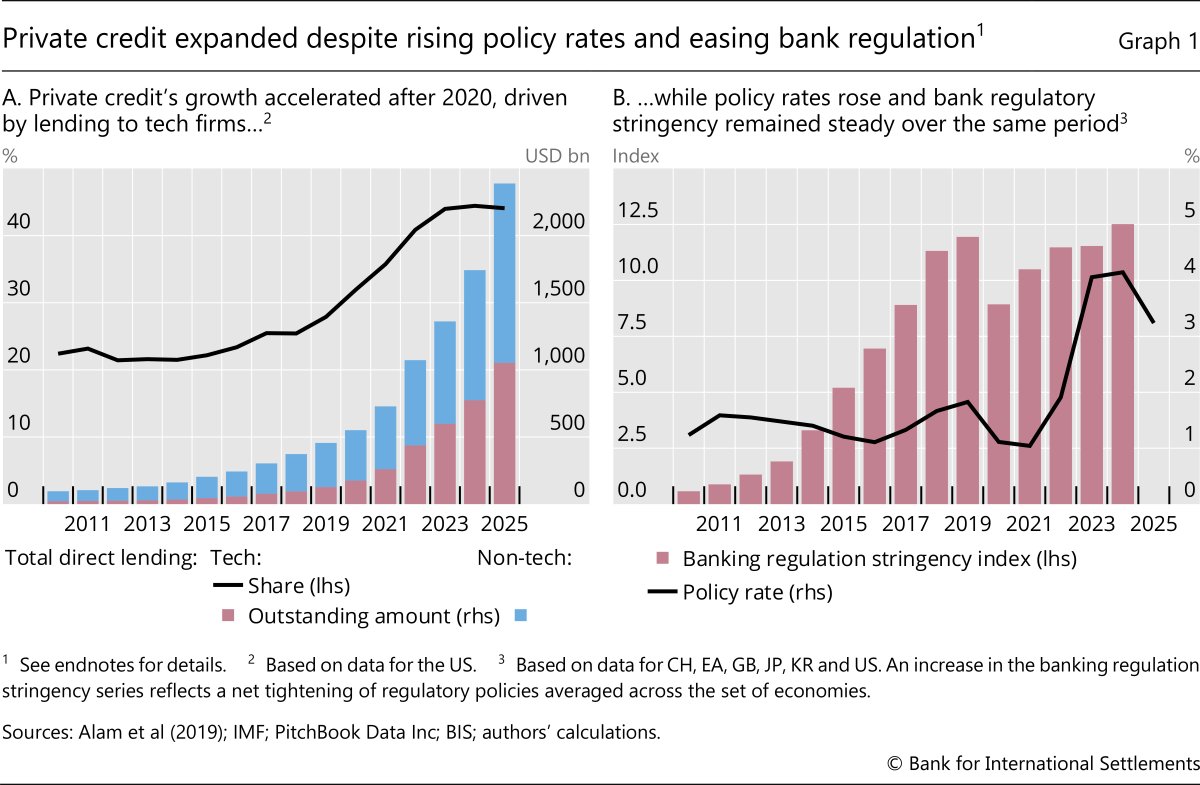
However, explanations based on changes in banking regulation and policy rates are difficult to reconcile with the rapid growth in private credit since 2020. Globally, total outstanding direct loan volumes increased from around $100 billion in 2010 to over $450 billion in 2019 (Graph 1.A, sum of red and blue bars), a period of (mostly) low policy rates and tightening bank regulation. Yet outstanding amounts grew further to almost $2.5 trillion by 2025, even as policy rates rose in most countries, and bank regulation, if anything, relaxed slightly (Graph 1.B, black line and red bars).5
Direct loans to tech firms
To study private credit’s recent growth, we use data from PitchBook Data Inc. The deal-level data provide information on direct loans by private credit funds, including loan amounts, rate spreads, maturity and borrower location and industry. We focus on loans to US-based borrowers, by far the largest market for private credit. The data cover almost 14,000 deals between 2010 and 2025. We classify borrowers into technology (“tech”) and non-technology (“non-tech”) firms based on the industry description provided by PitchBook (so-called verticals).6
Private credit funds have substantially increased their lending to tech firms. Outstanding loan volumes grew from about $22 billion in 2010 to about $127 billion in 2019 and to over $1 trillion in 2025 (Graph 1.A, red bars). As a share of the total, tech-related lending rose moderately from around 22% to 28% between 2010 and 2019, but surged to almost 45% over the following years (black line).
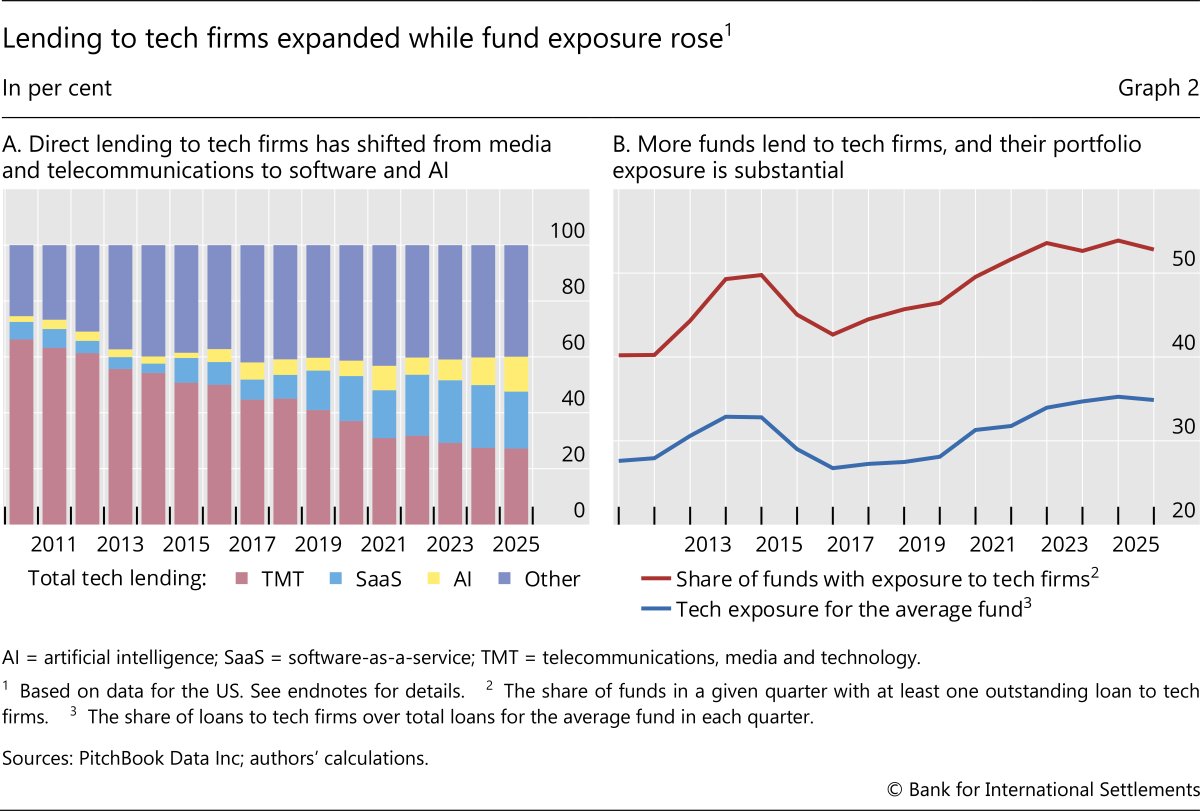
Within lending to the tech sector, volumes shifted from technology, media and telecommunications (TMT) to SaaS- and AI-related firms. Firms in TMT accounted for two thirds of total tech lending in 2010, but are less than a third today (Graph 2.A, red bars). The SaaS and, more recently, AI sectors increased their shares substantially (blue and yellow bars). In dollar amounts, lending to each category increased.
Alongside expanding loan volumes, private credit funds’ exposure to tech firms is high and rising. By the end of 2025, approximately 55% of all private credit funds extended loans to tech firms, up from 40% in 2010 (Graph 2.B, red line). For the average fund, loans to tech firms increased to about one third of the total (blue line).
The rise of private credit: the role of loan demand
The Covid-19 pandemic accelerated the shift towards the digital economy, increasing tech firms’ demand for credit. Lockdowns induced a persistent shift to remote work (Brynjolfsson et al (2025)), increasing the demand for cloud infrastructure, collaboration software and cyber security tools. Consumer behaviour tilted towards online shopping, streaming and digital payments (Alfonso et al (2021)). These changes, which intensified the demand for tech-related services, in turn increased tech firms’ demand for credit. As discussed, private credit, with its focus on lending against cash flows and intangible assets, was well placed to meet that demand.
We examine how direct lending evolved before and after the pandemic, comparing US cities with a larger versus smaller local employment share of tech firms. We expect that cities with a higher pre-existing concentration of tech firms (“tech employment share”) experienced a stronger increase in credit demand during and after the pandemic, leading to a stronger increase in private credit.
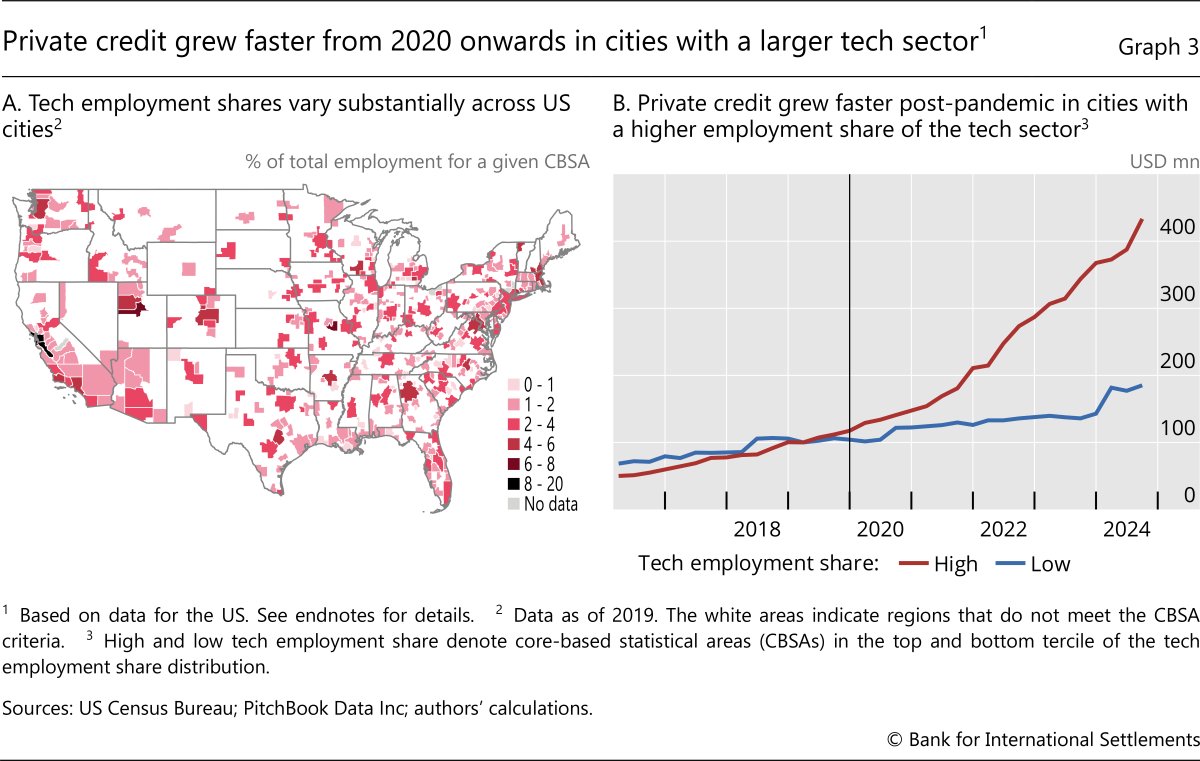
In line with a demand-based explanation, private credit grew substantially more after 2020 in cities with a higher tech employment share. Graph 3.A illustrates that pre-pandemic tech employment shares varied substantially across US cities, defined as core-based statistical areas (CBSAs).7 Darker red or black areas indicate higher tech employment shares. Graph 3.B plots private credit outstanding for CBSAs with high and low tech employment shares, with the first quarter of 2019 set to 100 for reference. The two series moved closely together throughout 2016–19 but diverged sharply from 2020 onwards. By 2025, outstanding private credit in CBSAs with a high tech employment share was twice as large as in CBSAs with a low share.
We corroborate the demand-based explanation more formally by estimating the following specification at the CBSA-quarter level, using data for the 2016–25 period:

where the dependent variable is the logarithm of outstanding direct loan amounts in CBSA c at quarter t, Tech emp sharec is each CBSA’s 2019 tech employment share and Post t is an indicator for quarters from the first quarter of 2020 onwards. We include CBSA fixed effects (αc) to absorb time-invariant regional differences. Year-quarter (αt) or state-year-quarter fixed effects (αs,t) are also included depending on the specification, and account for any aggregate supply factors (eg fund inflows from yield-seeking investors or a change in bank capital requirements) or trends common to all borrowers (eg a benign economic environment) in the same state. In our strictest regression, we further control for lagged employment levels and employment growth (Xc,t-1). A positive estimated coefficient β indicates that private credit grew relatively faster after 2020 in CBSAs with a larger initial tech footprint.
Private credit expanded more strongly in CBSAs with a higher tech employment share, providing support for the demand-based explanation. In columns (1)–(3) in Table 1, which progressively add fixed effects and controls, the coefficient β is positive and statistically significant. The post-2020 increase in private credit was hence substantially stronger in areas with higher tech employment shares. In our preferred specification in column (3), the estimated coefficient of 21.4 implies that a 2.5 percentage point higher tech employment share (corresponding to the difference between the 90th and 10th percentiles of the distribution) is associated with a roughly 70% stronger rise in private credit after 2020.
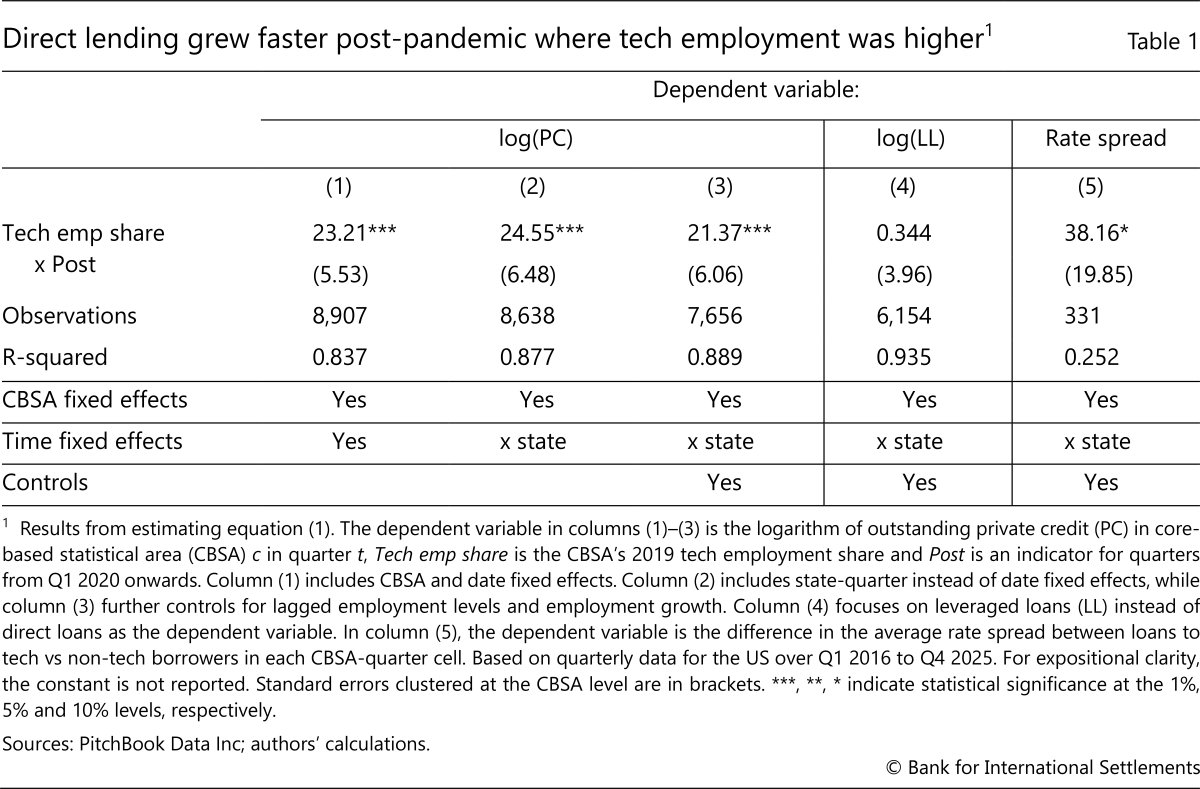
To substantiate the claim that the estimates reflect loan demand, we further use data on leveraged loans and loan rates. In principle, CBSA characteristics such as the presence of other industries or private equity firms could be correlated with the tech employment share and lead to a general increase in the local demand for credit, direct loans or other types. To examine this argument, we use leveraged loans, which are less suited to cash flow-based lending against intangible assets (as explained above), as the dependent variable in equation (1). This placebo regression yields a statistically and economically insignificant coefficient estimate (Table 1, column (4)). Funds may also have increased their supply of credit to tech borrowers (but not to other firms) irrespective of changes in loan demand. This supply-driven hypothesis would imply more lending at lower rates. To test this, we use the spread on direct loans to tech firms net of the spread on loans to non-tech firms as the dependent variable (column (5)). The estimated coefficient is positive, which, together with the results in columns (1)–(3), indicates an increase in both the quantity and price of loans, consistent with a demand-driven explanation.8
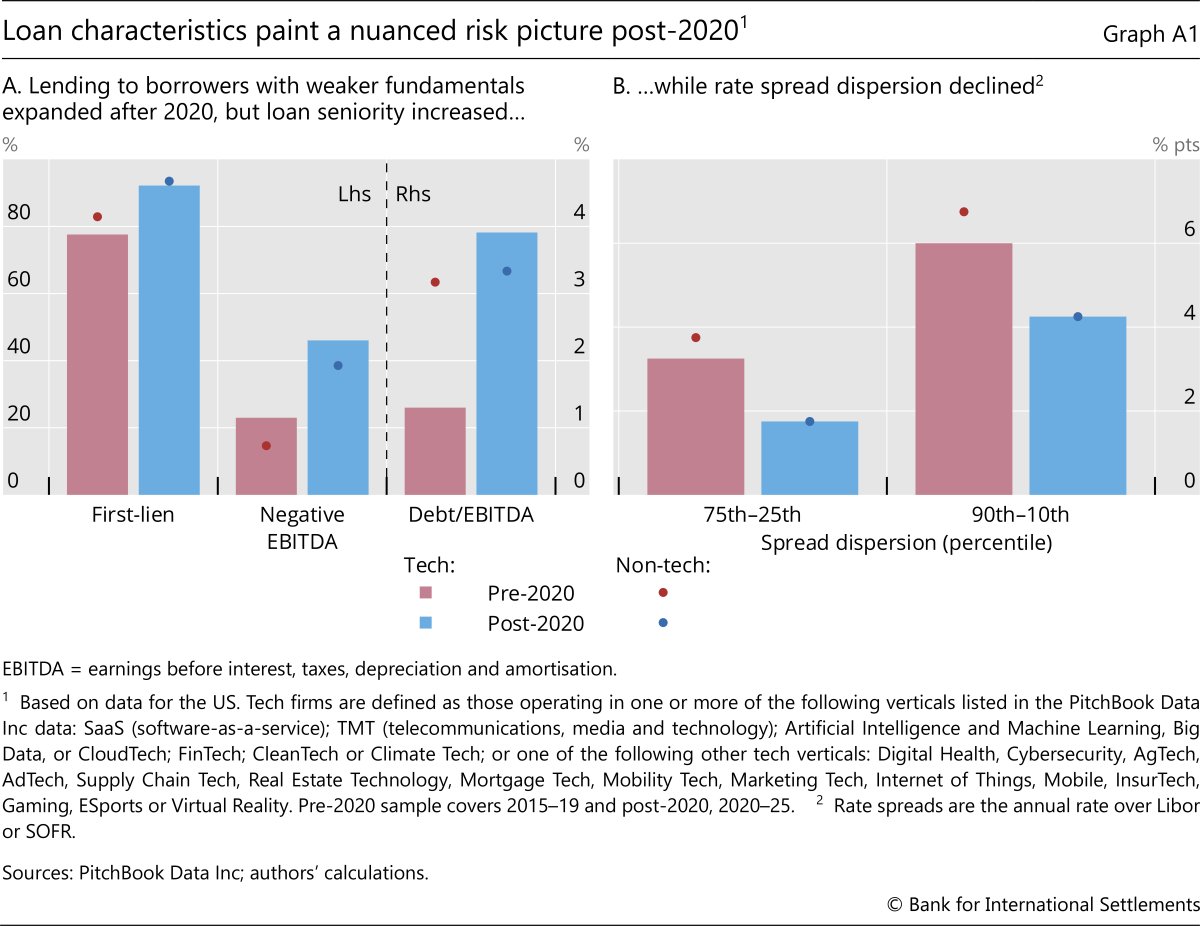
Box A assesses changes in borrower and loan characteristics during the tech lending boom. It shows that borrower fundamentals weakened while loan seniority increased. At the same time, dispersion in rate spreads narrowed, raising concerns about potentially inadequate pricing of risks. The jury is still out on whether private credit exposures to the tech sector foreshadow financial stability risks.
Fostering innovation? Private credit and local employment
Did the availability of private credit foster firm entry and employment growth? Better access to credit can spur firm formation and job creation (Robb and Robinson (2014)). To examine whether a faster expansion of private credit coincided with an increase in employment and the number of firms, we collapse the data to the CBSA-year level and estimate the following specification:

where the dependent variable is the logarithm of tech sector or total employment in CBSA c and year t, or the logarithm of the total number of firms in the tech sector or in all sectors in CBSA c and year t. PC refers to total outstanding direct loans. We include CBSA (µc) and year (λs,t) fixed effects. A positive estimated coefficient γ indicates employment increased by more where private credit expanded more.
Private credit volumes are positively associated with local economic activity (Table 2). Column (1) uses the log of total employment in the tech sector as the dependent variable. The estimates suggest that the above-discussed 70% increase in private credit would be associated with about 1.47% higher tech sector employment. For total CBSA employment in column (2), the corresponding number is 0.42%. For the average CBSA, which has 470,000 employees, the latter estimate translates into an increase of almost 2,000 jobs. Higher private credit amounts are also associated with a significant increase in the number of tech and total firms (columns (3) and (4)).9
Puriya Abbassi, Iñaki Aldasoro and Sebastian Doerr
To better understand the terms at which direct loans are issued and to assess changes in borrower quality, this box compares the characteristics of direct loans to tech and non-tech non-financial corporates, as well as the evolution of borrower characteristics before and after the surge in tech lending, based on PitchBook data over the period 2010–25.
Direct lending to tech firms does not substantially differ from that to non-tech firms. Loans to tech firms are on average somewhat larger ($103 million, vs $72 million for firms in other sectors) and do not differ markedly in terms of maturity (about five years), rate spreads (about 6 percentage points) or the share of first-lien loans, which give lenders “first claim” on assets in the event of default (84% for tech vs 87% for non-tech borrowers).
As direct lending to tech firms expanded, borrower fundamentals weakened while loan spreads narrowed. The share of tech borrowers with negative earnings (EBITDA) nearly doubled, from 23% pre-2020 to 46% post-2020 (Graph A1.A, red vs blue bars). Among profitable borrowers, leverage (as measured by the median debt-to-EBITDA ratio) tripled.

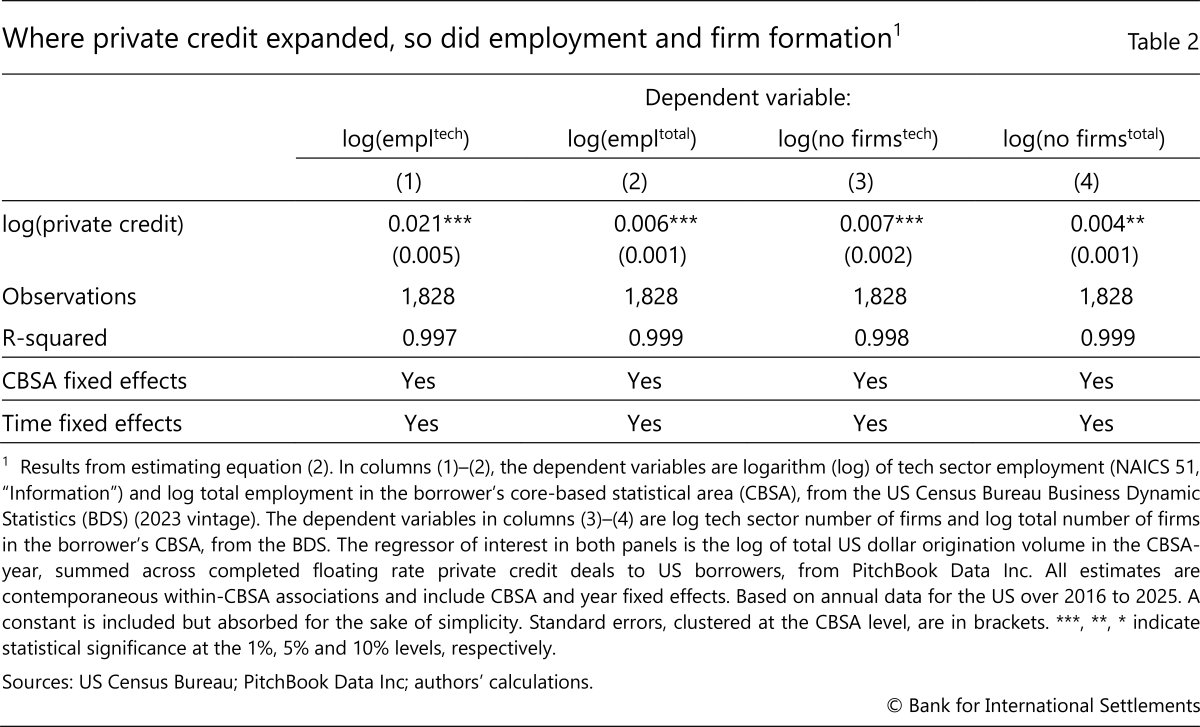
Of course, the estimates do not establish a causal effect of private credit on real outcomes, which lies outside the scope of this article. Yet the evidence is consistent with the view that private credit, with its bespoke lending model and ample available capital, can support firm entry and job creation in innovative industries.
Conclusion
This article has shown that surging loan demand from tech firms drove private credit growth post-2020, fostering firm entry and employment. These results have implications for the broader debate on private credit and financial stability as well as the role of the financial sector in fostering growth.
First, the role of demand in driving private credit’s growth suggests that relaxing bank regulation alone is unlikely to materially shift lending activity from private credit back to banks. While post-GFC bank regulation probably contributed to the initial expansion of private credit, the sector’s recent growth has persisted despite rising policy rates and stable regulatory stringency. The jury is still out regarding financial stability risks, as borrower fundamentals weakened and price differentiation declined during the recent private credit boom.
Second, our results highlight how interactions between the financing needs of innovative firms and the financial sector’s capacity to meet them can sustain growth. The United States had both a sizeable pre-existing tech sector and a mature private credit market capable of mobilising financing for asset-light firms. This confluence of real and financial factors has supported the expansion of tech firms after 2020 and holds lessons for other jurisdictions seeking to foster innovation and growth.
Annex: Additional results
1 The views expressed in this article are those of the authors and not necessarily those of the BIS or its member central banks. The authors thank Fernando Avalos, Giulio Cornelli, Mathias Drehmann, Egemen Eren, Jon Frost, Gaston Gelos, Bryan Hardy, Daniel Rees, Andreas Schrimpf and Costas Stephanou for helpful comments and suggestions, and Rudraksh Kansal for excellent research assistance. The authors acknowledge the use of artificial intelligence in research assistance and editorial refinement. Responsibility for all errors remains with the authors.
2 For discussions about the broader implications of the AI investment boom and private credit growth for financial stability, see Aldasoro et al (2026) and BIS (2026).
3 Recently, so-called evergreen or interval funds, which allow investors to regularly redeem a portion of their funds, have grown in popularity. If private credit succeeds in attracting more retail investors by migrating to more open-ended structures, liquidity mismatches may rise (Aldasoro et al (2025)).
4 See Avalos et al (2025), Ivashina (2025) and FSB (2026) for a broader discussion.
5 To be sure, other factors may have played a role in the post-pandemic growth of private credit, eg the ample liquidity and accommodative monetary policy stance that characterised the pandemic’s immediate aftermath. But again, such conditions changed around mid-2022 with both policy rate increases and reductions in central bank balance sheet size – yet private credit still grew stronger. With regard to regulation, while parts of the Basel III package were not yet fully completed or implemented by 2025, the overall trend post-2020 suggests, at a minimum, no tightening.
6 According to PitchBook Data Inc, “an industry vertical describes a group of companies that focus on a shared niche or specialised market spanning multiple industries”. Tech firms operate in one or more of the following verticals: SaaS; Technology, Media and Telecommunications (TMT); Artificial Intelligence and Machine Learning, Big Data or CloudTech; FinTech; CleanTech or Climate Tech; or one of the following other tech verticals: Digital Health, Cybersecurity, AgTech, AdTech, Supply Chain Tech, Real Estate Technology, Mortgage Tech, Mobility Tech, Marketing Tech, Internet of Things, Mobile, InsurTech, Gaming, ESports or Virtual Reality.
7 The US Census Bureau defines CBSAs as geographic regions that consist of one or more counties anchored by a population core (an urban area of at least 10,000 people), plus adjacent counties tied to the core by high rates of commuting. Data on employment and the number of firms by region and industry are obtained from the Census Bureau’s Business Dynamics Statistics. Tech firms are defined as those operating in North American Industry Classification (NAICS) code 51.
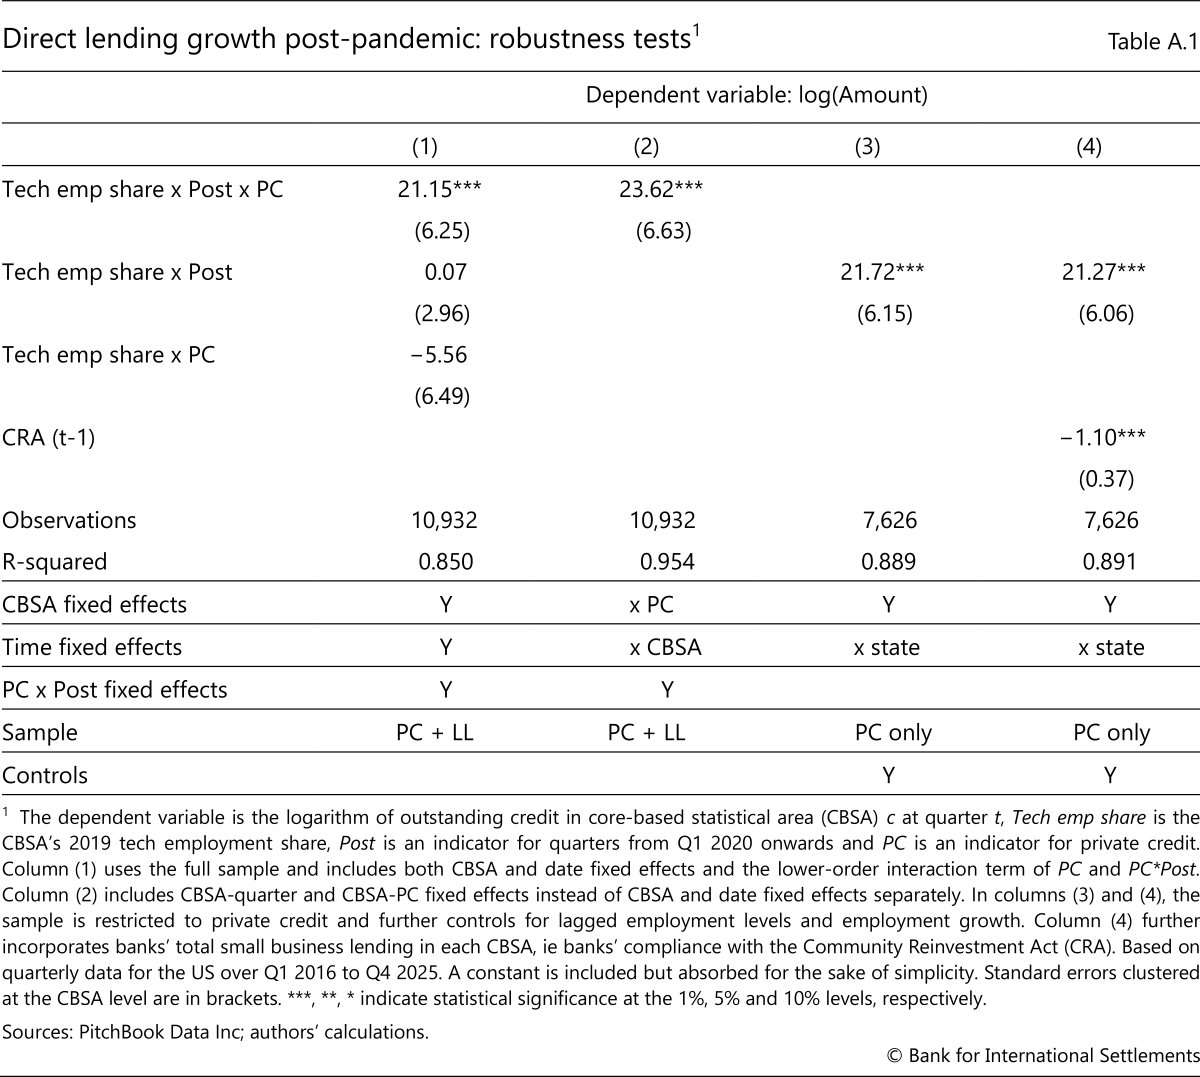
8 Data on rate spreads are only available for a subset of loans, resulting in the lower number of observations in the regression in column (5). We perform further tests in Annex A. We find that the differential effect of the tech employment share on direct lending relative to leveraged lending remains sizeable and significant when we include CBSA x time fixed effects that absorb any observable and unobservable time-varying CBSA characteristics. Our coefficient of interest remains similar in economic and statistical significance when we control for banks’ total small business lending in each CBSA (Annex Table A.1). We obtain no significant coefficient estimate when we use the spread on leveraged loans as the dependent variable (unreported).
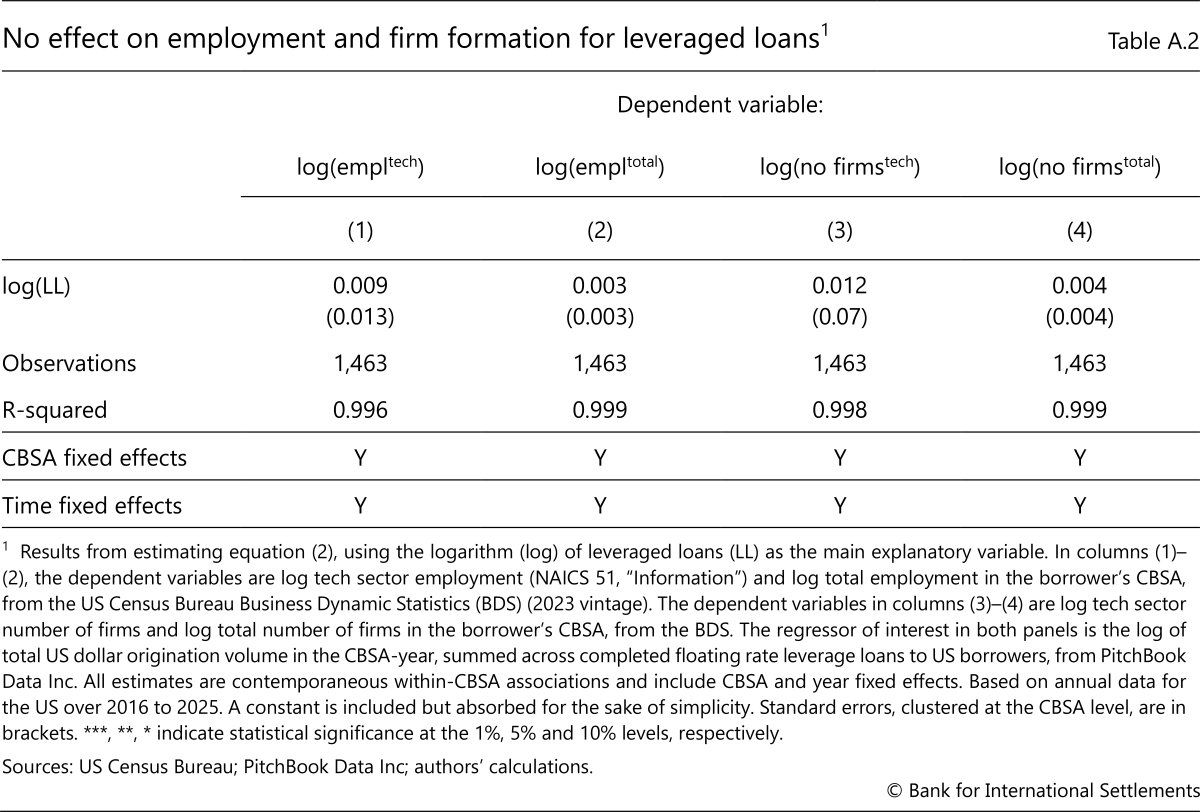
9 We find no comparable effect for leveraged loans; see Annex Table A.2.
Alam, Z, A Alter, J Eiseman, G Gelos, H Kang, M Narita, E Nier and N Wang (2019): “Digging deeper – evidence on the effects of macroprudential policies from a new database”, IMF Working Paper, no 2019/066.
Aldasoro, I, S Doerr and K Todorov (2025): “Retail investors in private credit”, BIS Bulletin, no 106.
Aldasoro, I, S Doerr and D Rees (2026): “Financing the AI boom: from cash flows to debt”, BIS Bulletin, no 120.
Alfonso, V, C Boar, J Frost, L Gambacorta and J Liu (2021): “E-commerce in the pandemic and beyond”, BIS Bulletin, no 36.
Avalos, F, S Doerr and G Pinter (2025): “The global drivers of private credit”, BIS Quarterly Review, March.
Bank for International Settlements (BIS) (2026): "Progress and peril", Annual Economic Report 2026, Chapter I.
Block, J, Y S Jang, S Kaplan and A Schulze (2024): “A survey of private debt funds”, Review of Corporate Finance Studies, vol 13, no 2.
Brynjolfsson, E, J Horton, C Makridis, A Mas, A Ozimek, D Rock and Y H TuYe (2025): “How many Americans work remotely? A survey of surveys and their measurement issues”, Review of Income and Wealth, vol 71, no 4, e70029.
Chernenko, S, I Erel and R Prilmeier (2022): “Why do firms borrow directly from nonbanks?”, Review of Financial Studies, vol 35, no 11.
Chernenko, S, R Ialenti and D Scharfstein (2025): “Bank capital and the growth of private credit”, working paper.
Davydiuk, T, T Marchuk and S Rosen (2024): “Direct lenders in the US middle market”, Journal of Financial Economics, vol 162, 103946.
Degryse, H, O De Jonghe, L Laeven and T Zhao (2025): “Collateral and credit”, CEPR Discussion Paper, no 20639.
Dell’Ariccia, G, D Kadyrzhanova, C Minoiu and L Ratnovski (2021): “Bank lending in the knowledge economy”, The Review of Financial Studies, vol 34, no 10.
Doerr, S, G Gelos and V Pursiainen (2026): “Bank liquidity regulation and the growth of private credit”, working paper.
Financial Stability Board (FSB) (2026): Report on vulnerabilities in private credit.
International Monetary Fund (IMF) (2024): “The rise and risks of private credit”, Global Financial Stability Report, Chapter 2.
Ivashina, V (2025): “The role of private debt in the financial ecosystem”, NBER Working Paper, no 34426.
Jang, Y S, D Kim and A Sufi (2025): “The lending technology of direct lenders in private credit”, NBER Working Paper, no 34500.
Robb, A and D Robinson (2014): “The capital structure decisions of new firms”, The Review of Financial Studies, vol 27, no 1.
Graphs 1.A, 2 and 3.B: Tech firms are defined as those operating in one or more of the following verticals listed in the PitchBook Data Inc data: SaaS (software-as-a-service); TMT (telecommunications, media and technology); Artificial Intelligence and Machine Learning, Big Data, or CloudTech; FinTech; CleanTech or Climate Tech; or one of the following other tech verticals: Digital Health, Cybersecurity, AgTech, AdTech, Supply Chain Tech, Real Estate Technology, Mortgage Tech, Mobility Tech, Marketing Tech, Internet of Things, Mobile, InsurTech, Gaming, ESports or Virtual Reality.
Graph 1.B: The key policy rate represents the GDP-weighted average of central bank policy rates across economies. The bank regulation stringency index is based on the integrated macroprudential policy (iMaPP) index in the IMF iMaPP Database, which captures monthly net changes in prudential policies (+1 for tightening, –1 for loosening, 0 for no change). We focus on the following selected set of banking regulation variables: (i) capital requirements for banks, which include risk weights, systemic risk buffers, and minimum capital requirements, but excluding countercyclical capital buffers and capital conservation buffers; (ii) limits on leverage of banks, calculated by dividing a measure of capital by the bank’s non-risk-weighted exposures (eg Basel III leverage ratio); (iii) minimum requirements for Liquidity Coverage Ratios, liquid asset ratios, Net Stable Funding Ratios, core funding ratios and external debt restrictions; (iv) requirements for banks to maintain a capital conservation buffer, including the one established under Basel III; and (v) limits to loan-to-value ratios, applied to residential and commercial mortgages but also applicable to other secured loans, such as for automobiles. We calculate cumulative sums per country and GDP-weighted averages annually (based on the same set of countries as the policy rate series).
Graph 3: The tech employment share is defined as total employment in North American Industry Classification (NAICS) code 51 over total employment in each core-based statistical area (CBSA) as of 2019. Alaska and Hawaii are not shown in the graph.The US Office of Management and Budget defines metropolitan and micropolitan statistical areas, which are referred to collectively as CBSAs. The general concept of the metropolitan and micropolitan statistical area is that of a core area containing a substantial population nucleus, together with adjacent communities having a high degree of economic and social integration with that core. Metropolitan statistical areas contain at least one urbanised area with a population of 50,000 or more; micropolitan statistical areas contain at least one urban cluster with a population of 10,000–50,000. If specified criteria are met, a metropolitan statistical area containing a single core with a population of 2.5 million or more may be subdivided into metropolitan divisions, which function as distinct areas within the larger metropolitan statistical area. CBSAs are composed of entire counties. There are 388 metropolitan statistical areas, of which 11 are subdivided into 31 metropolitan divisions, and 541 micropolitan statistical areas in the United States and Puerto Rico, as of February 2013. CBSA boundaries and titles are as of February 2013, and reflect the application of the 2010 Standards for Delineating Metropolitan and Micropolitan Statistical Areas to Census Bureau data. All other boundaries and names are as of 1 January 2010.