BIS residential property price statistics, Q1 2026

- Real global house prices declined by 1.2% year on year (yoy) in the first quarter of 2026.
- Real prices stopped growing in advanced economies (–0.2% yoy), and continued to decrease in emerging market economies (–2.0% yoy), mainly driven by developments in Asia.
- Since the start of the Covid-19 pandemic, real global house prices have risen by a meagre 3%. Among G20 economies, the strongest increases have been recorded in Türkiye, Australia, Mexico and the United States. Conversely, prices still remain below their pre-pandemic heights in China, Canada and Indonesia.
- From a longer-term perspective, global house prices have markedly increased in real terms over the past two decades – by 20% since the end of the Great Financial Crisis (GFC) of 2007–09. Türkiye, India and the United States have recorded the most notable rises, while prices remain below their post-GFC levels in Italy and China.
- To access the full data set, visit Residential property prices - overview | BIS Data Portal
Summary of latest developments
In the first quarter of 2026, aggregated global residential property prices deflated by consumer prices declined at a faster pace, by 1.2% yoy (compared with –0.5% in the previous quarter). This is in contrast to the previous period of near stabilisation observed in the second half of 2025 (Graph 1, yellow line). 1
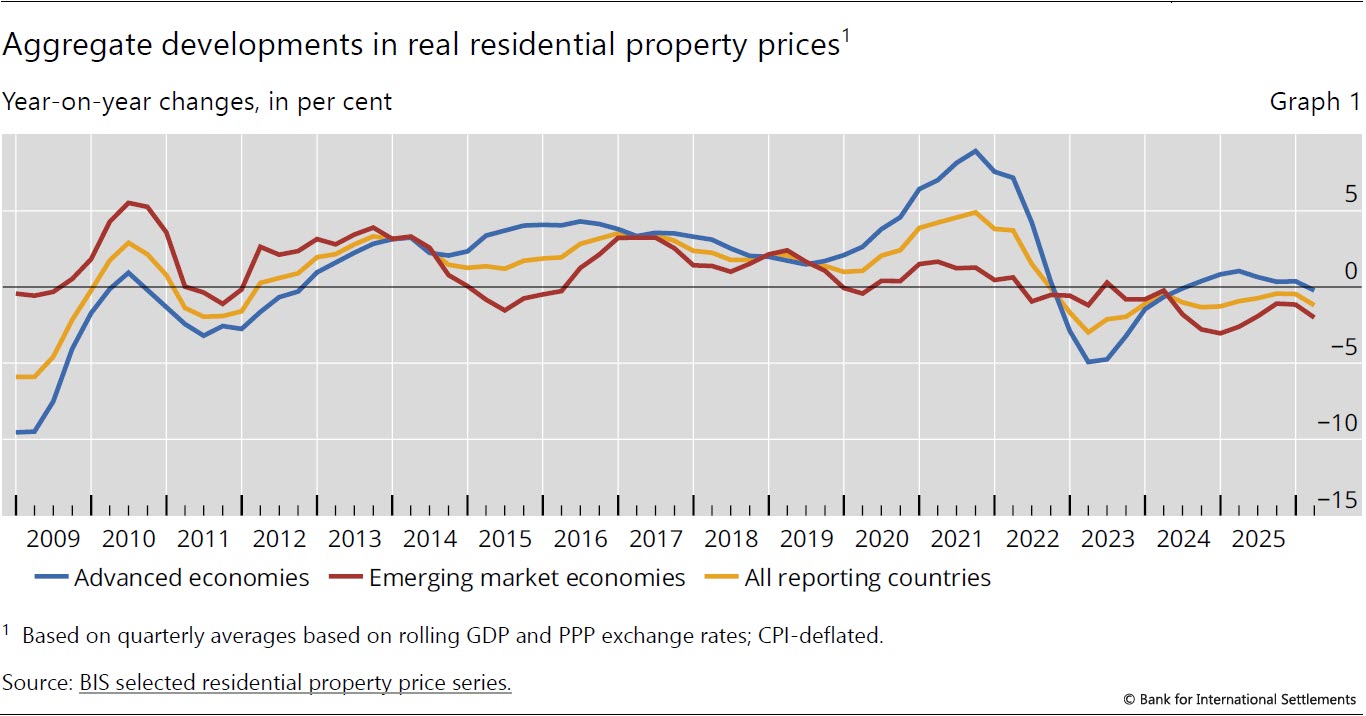
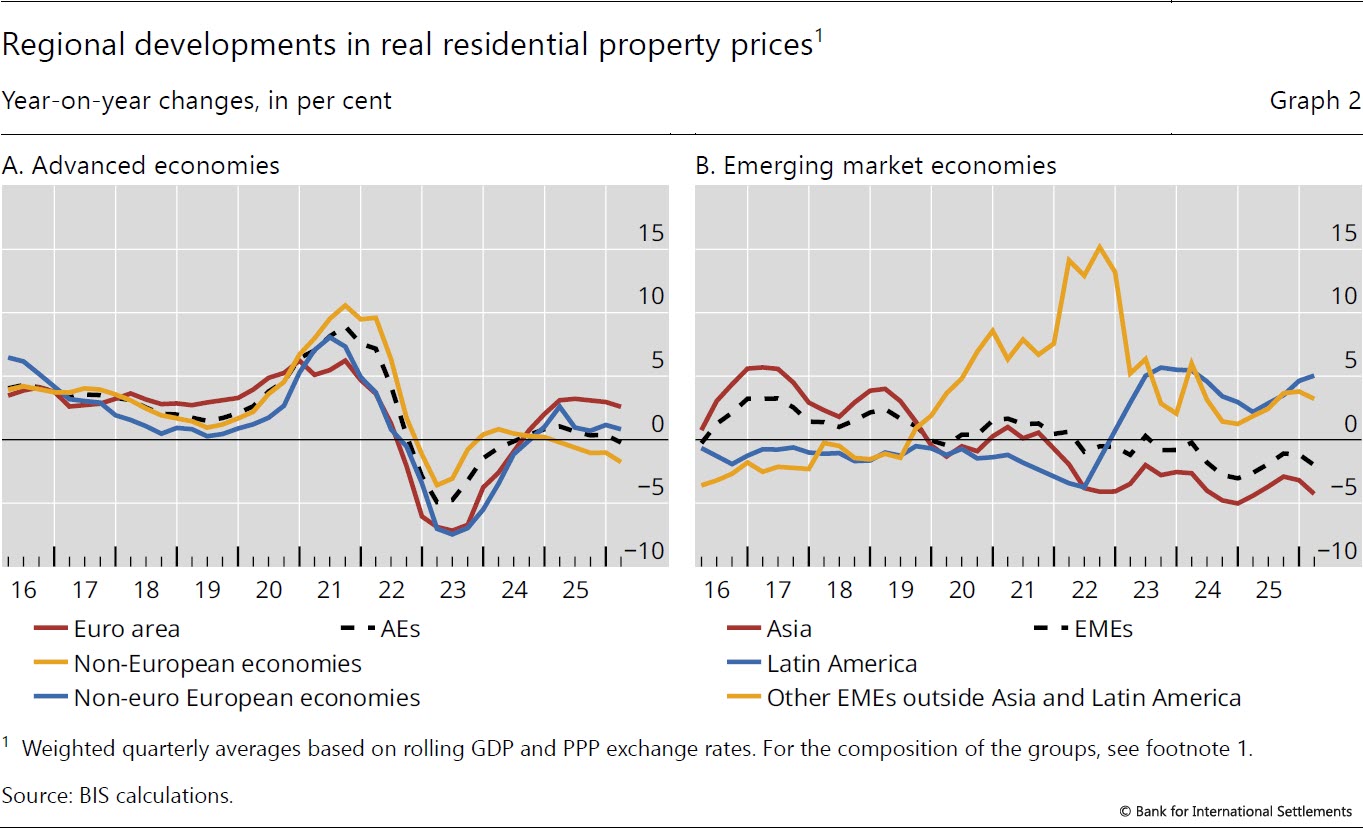
Real prices stopped growing in advanced economies (AEs), and even recorded a small decline for the first time since Q3 2024 (–0.2%) (Graph 1, blue line). This was despite the continued strength observed in Europe (+2.6% in the euro area and +0.8% for other European countries) (Graph 2.A).
Turning to emerging market economies (EMEs), real house prices extended their decline further, dropping by 2.0% yoy in real terms after –1.2% in the preceding quarter (Graph 1, red line). These aggregated developments continued to be driven by the fall in prices observed in Asia (–4.3%), contrasting with continued growth in Latin America (5.0%) and in other EMEs (3.2%) (Graph 2.B). This divergence across the major EME regions has been a regular feature observed in recent years.
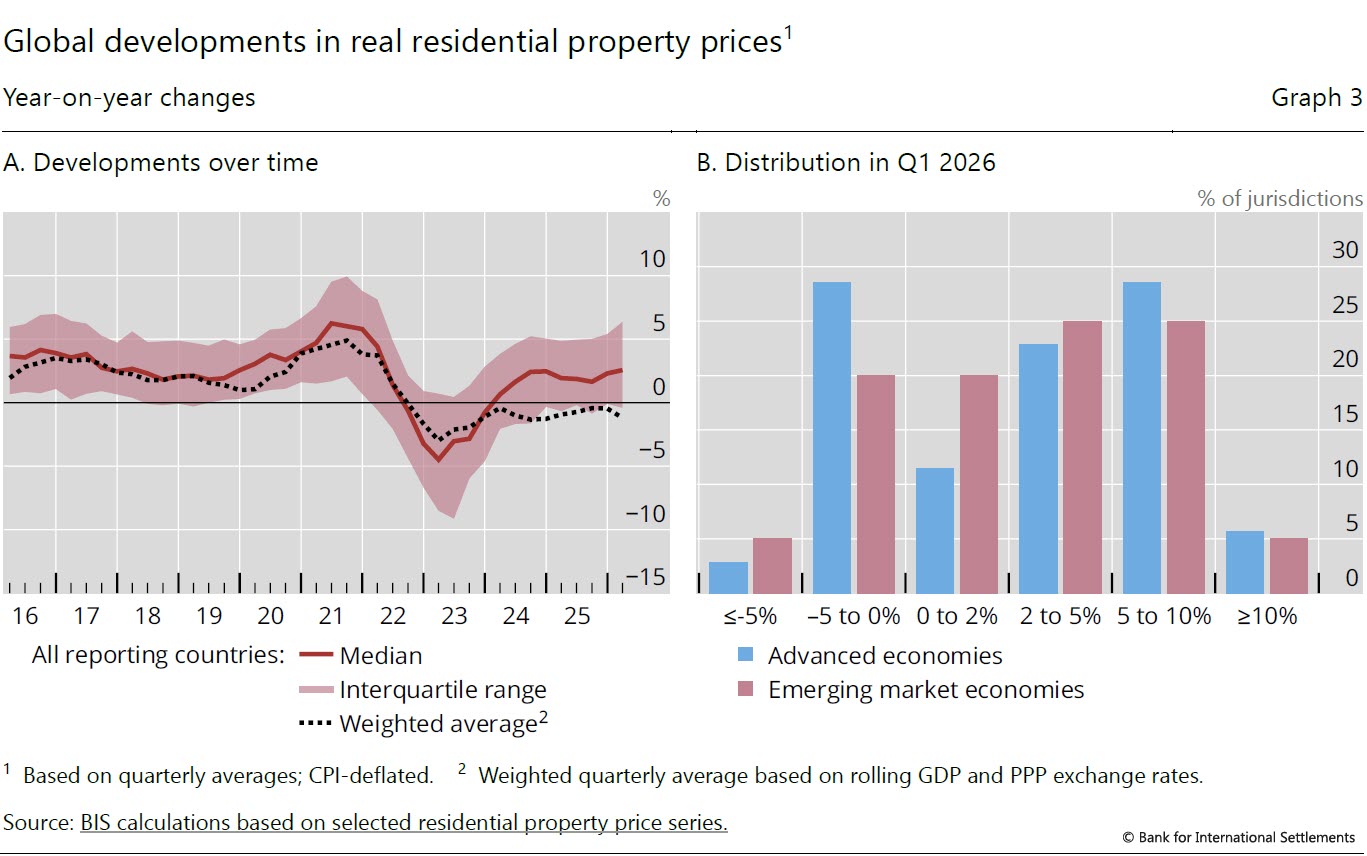
In the first quarter of 2026, real residential property price growth continued to show considerable variation across jurisdictions. The median yoy growth rate increased further (from 2.3% to 2.6%) as the overall aggregate decline (–1.2% for the weighted mean of the reporting jurisdictions in Q1 2026) was driven by only a few large economies (Graph 3.A). In fact, only around one third of AEs and one fourth of EMEs experienced a yoy fall in real prices in Q1 2026 (Graph 3.B).2
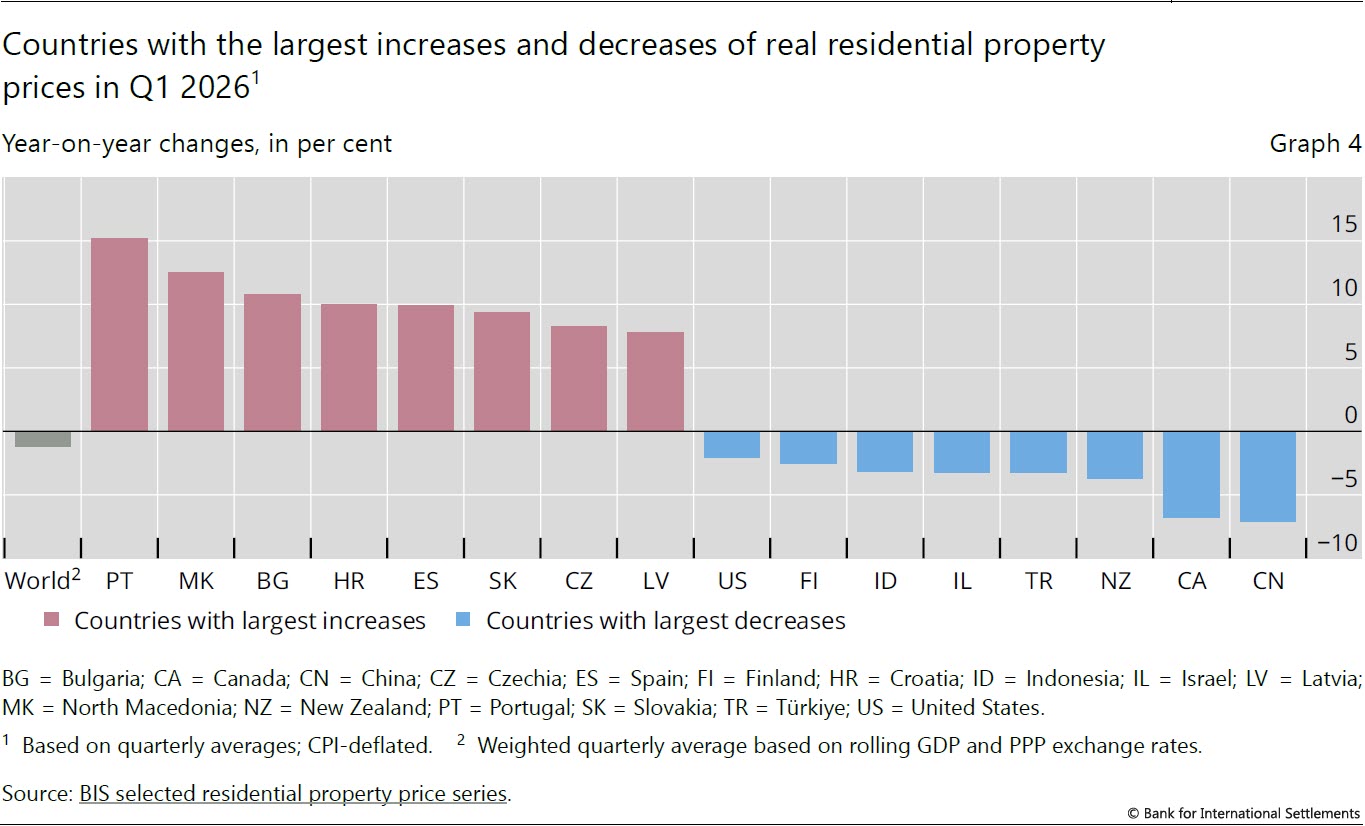
In Q1 2026, the jurisdictions with the largest increases in real residential property prices were Portugal (15% yoy), North Macedonia (13%) and Bulgaria (11%). Conversely, the sharpest drop occurred in China (–7%), the main driver of the aggregate decline observed in emerging Asia, Canada (–7%) and New Zealand (–4%) (Graph 4).
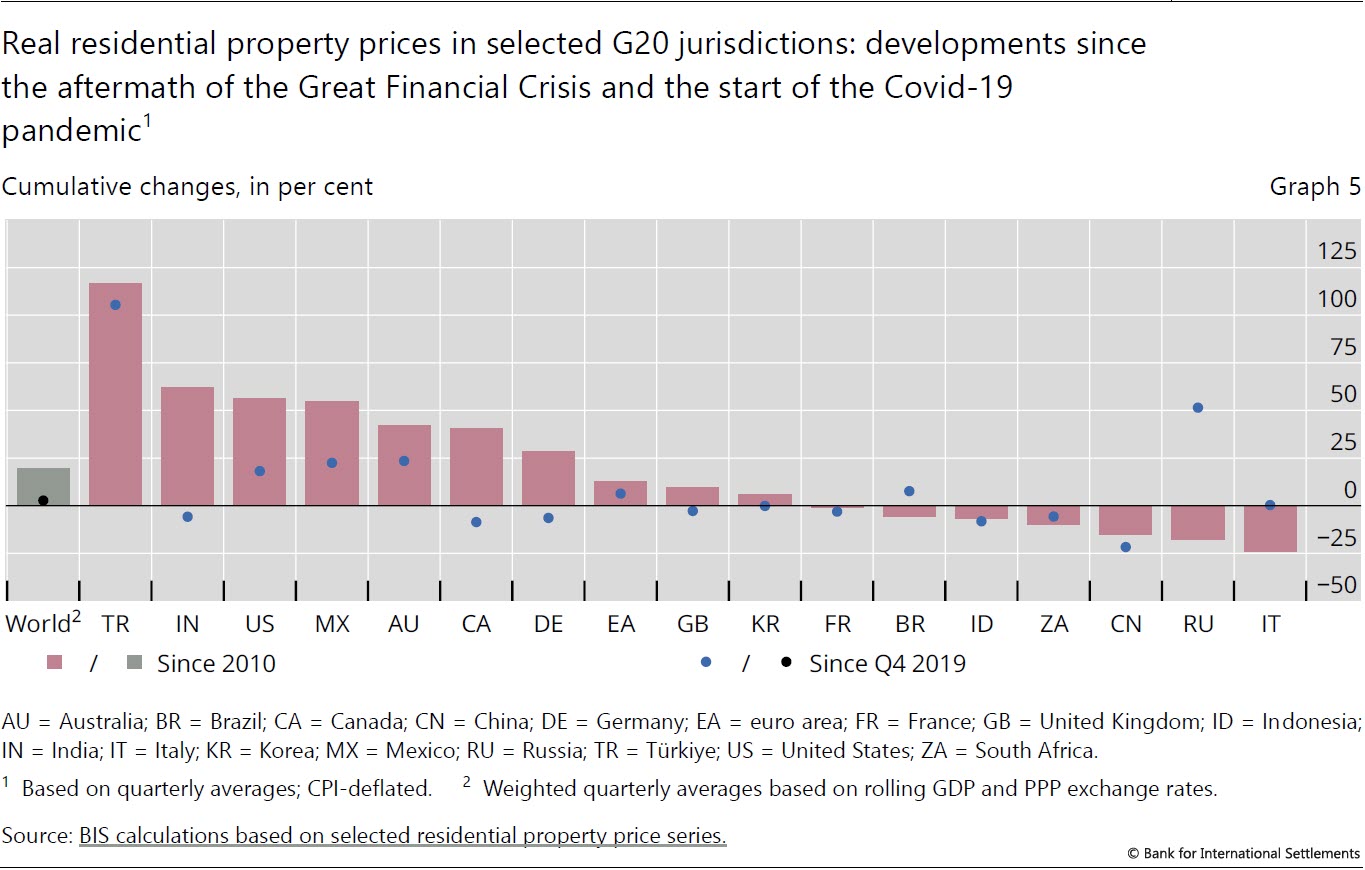
Since the start of the Covid-19 pandemic in Q4 2019, real house prices have increased by 2.7% globally. Among G20 economies, house price inflation has been particularly notable in Türkiye (105%), Australia (23%), Mexico (22%) and the United States (18%). Conversely, real prices have decreased the most in China (–22%), followed by Canada
(–9%) and Indonesia (–8%).
From a longer-term perspective, real global house prices are well above the levels observed at the end of the GFC, by a marked 20%. They are particularly high in Türkiye (117%), India (62%) and the United States (56%). By contrast, real prices remain well below their post-GFC levels in Italy (–24%) and China (–15%) (Graph 5).
Advanced economies
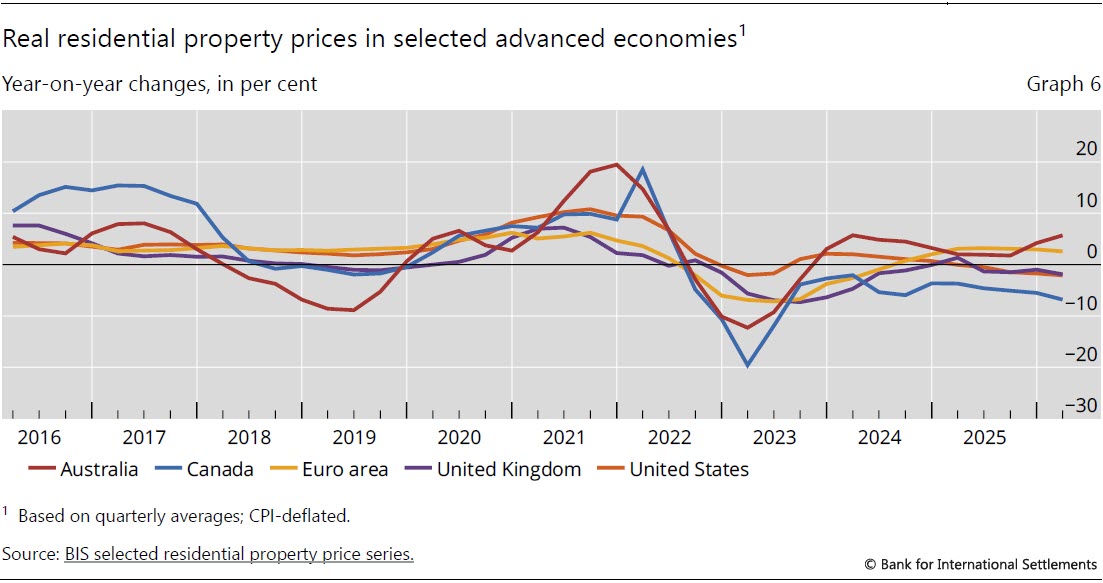
Real residential property prices remained almost stable in AEs in Q1 2026 (–0.2% yoy). They extended their decrease in Canada (–7%) and, to a lesser extent, in the United States
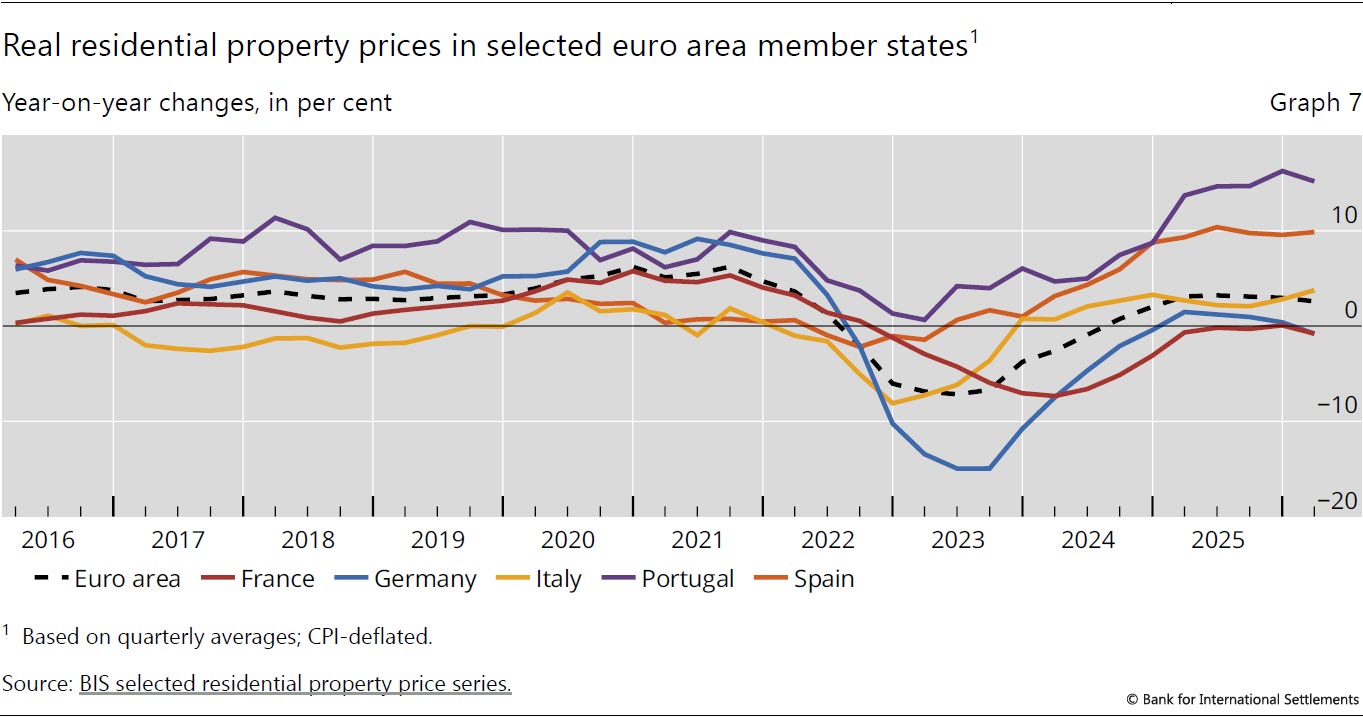
(–2%) and the United Kingdom (–2%) (Graph 6). In contrast, they continued to grow in Australia (+6%) and in the euro area (+2.6%), with marked increases in Spain (+10%) and Italy (+4%), despite the slight declines observed in both France (–1%) and Germany (–1%) (Graph 7).
Emerging market economies
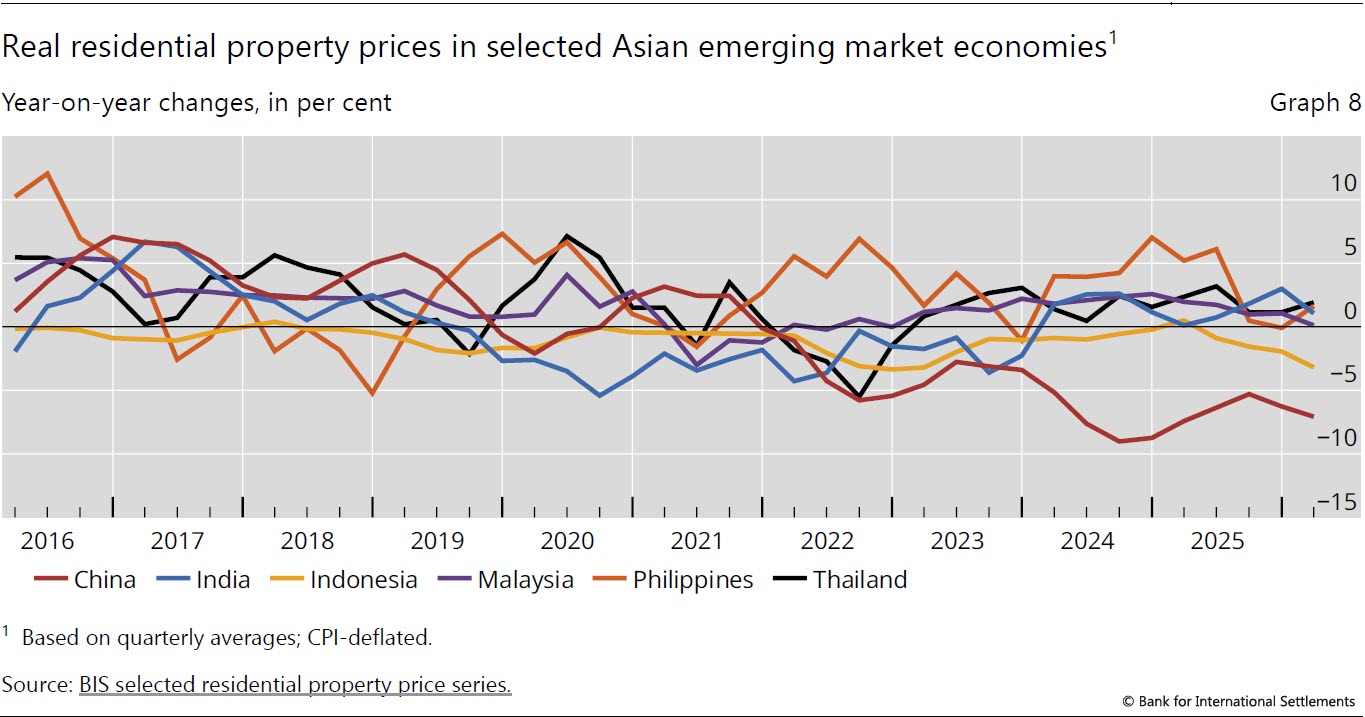
In Q1 2026, real residential property prices in EMEs continued to decline (–2%). The fall was particularly notable in emerging Asia, especially in China and Indonesia (–7% and –3%, respectively), while prices increased moderately in Thailand (2%), the Philippines (2%) and India (1%) (Graph 8).
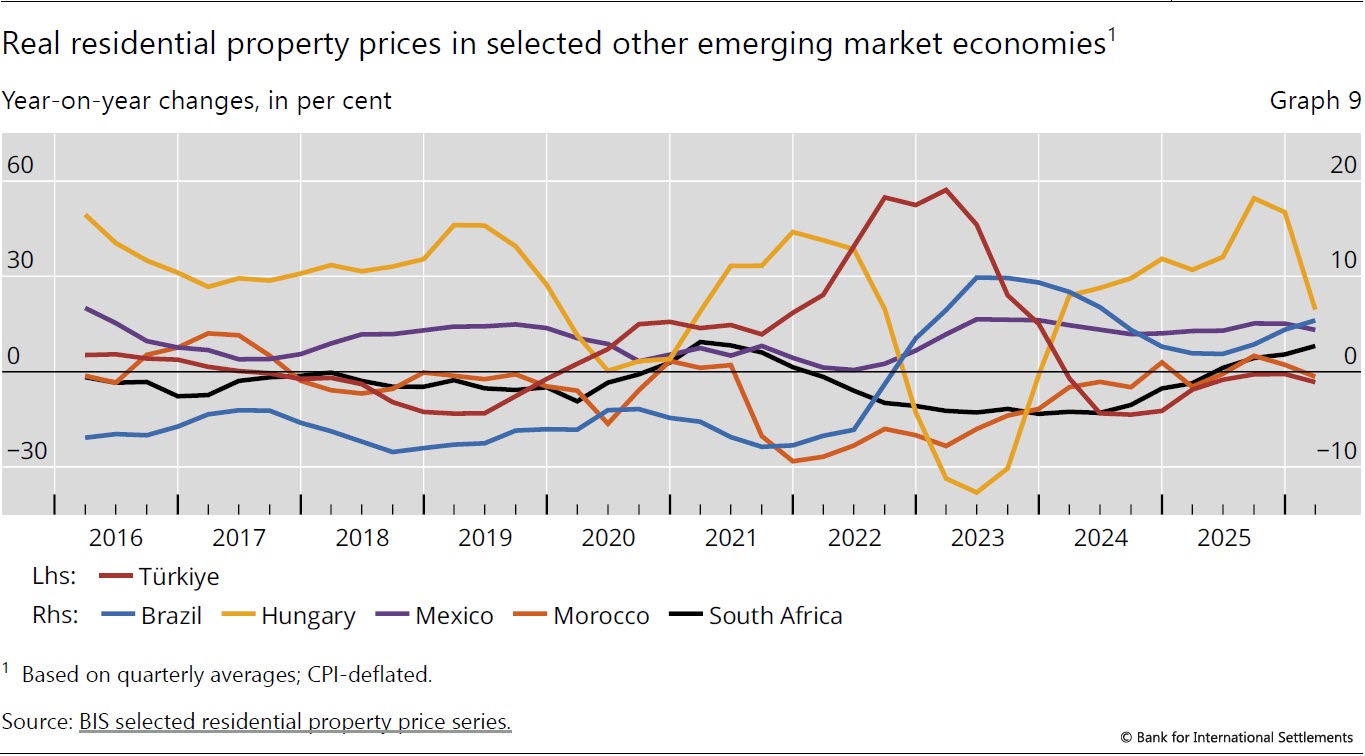
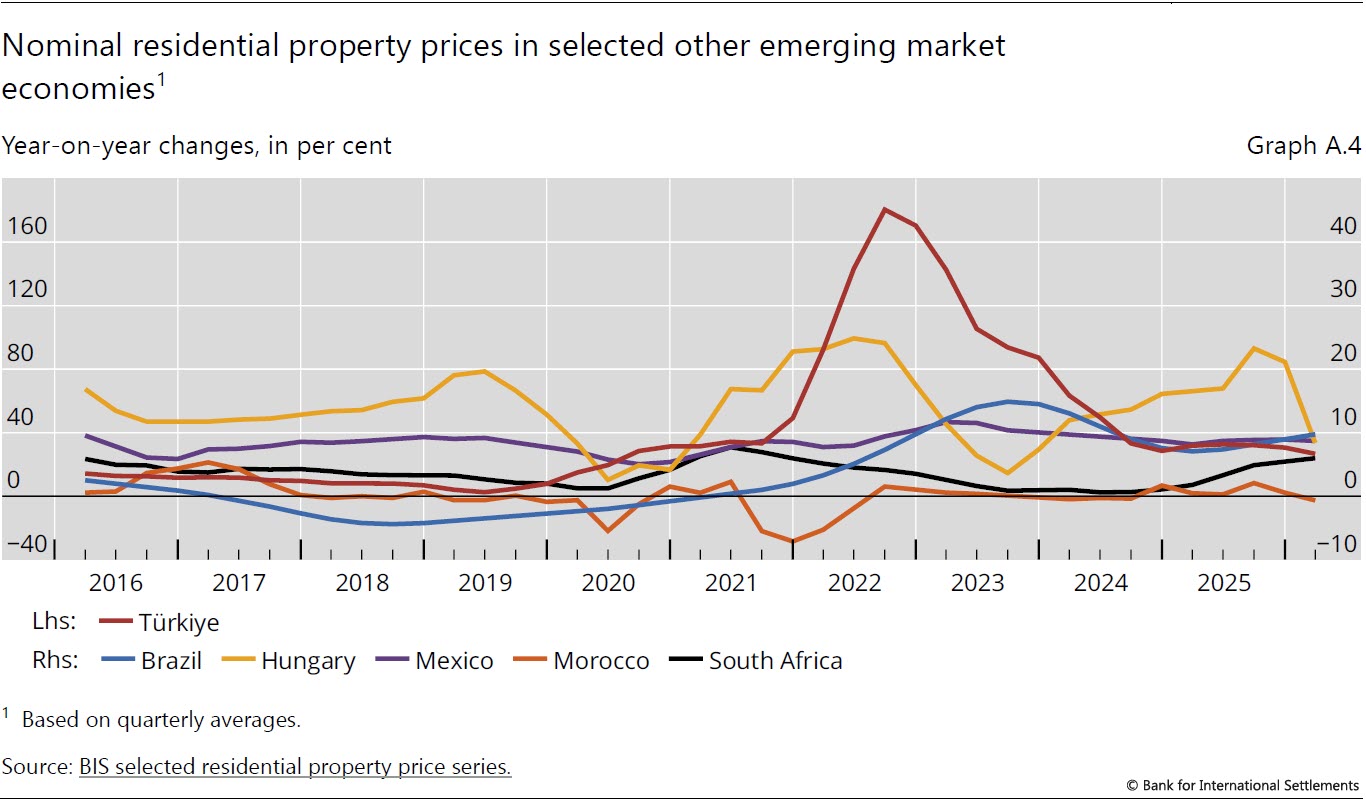
Turning to other EME regions, real residential property prices kept growing in Latin America (5%), reflecting continued increases in Brazil (5%) and Mexico (4%). They also rose in other countries such as South Africa (3%), but declined in Türkiye (–3%) and Morocco (–1%) (Graph 9).
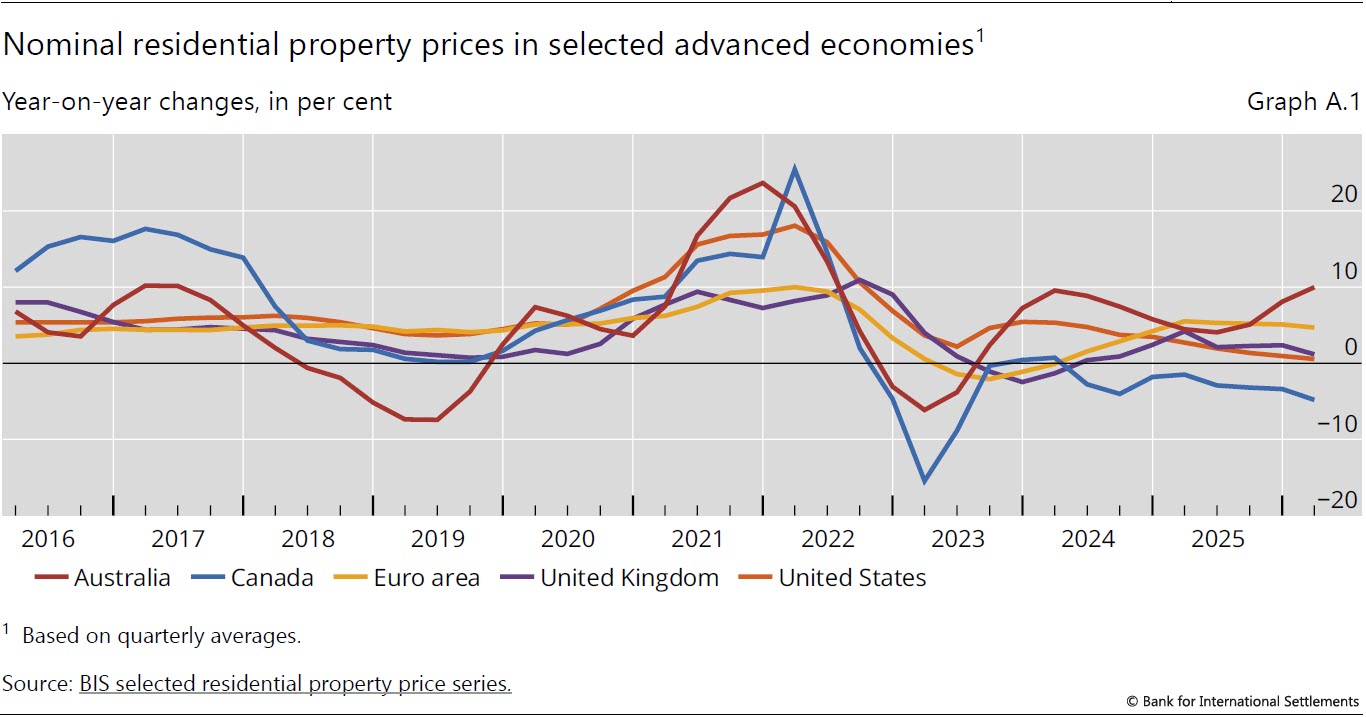
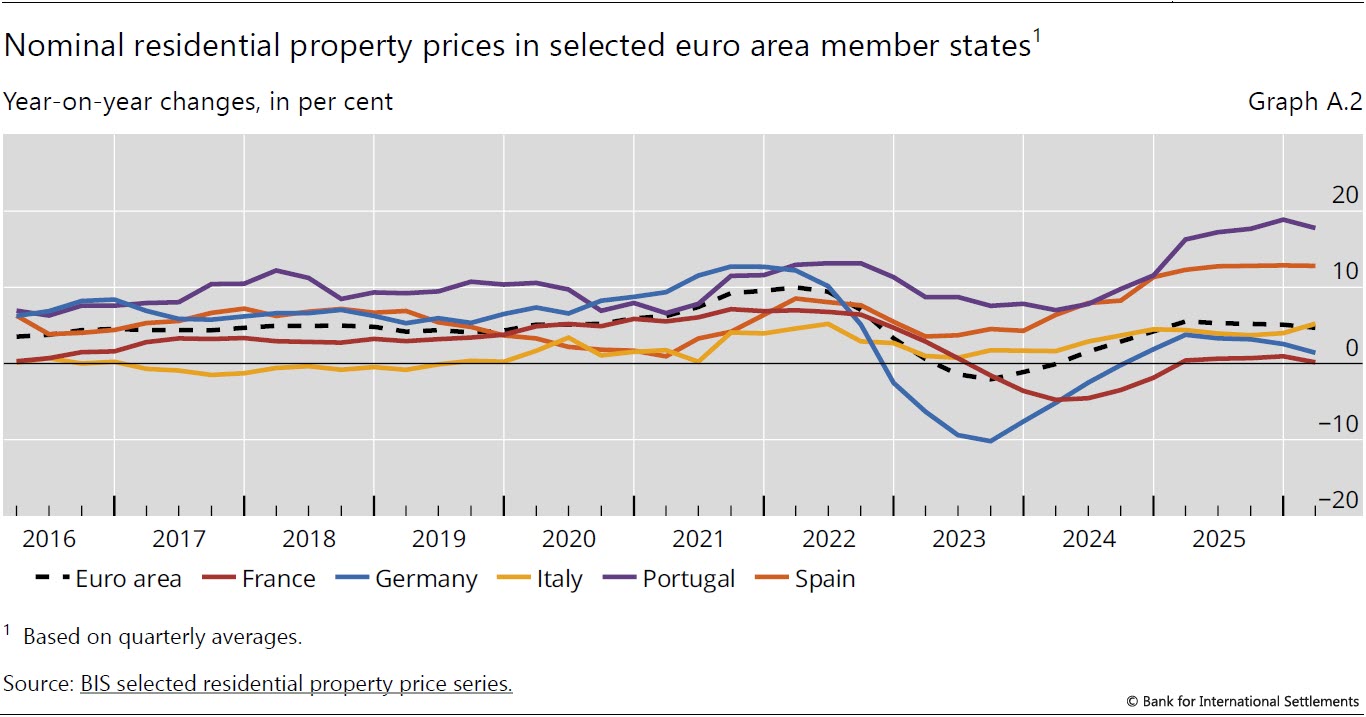
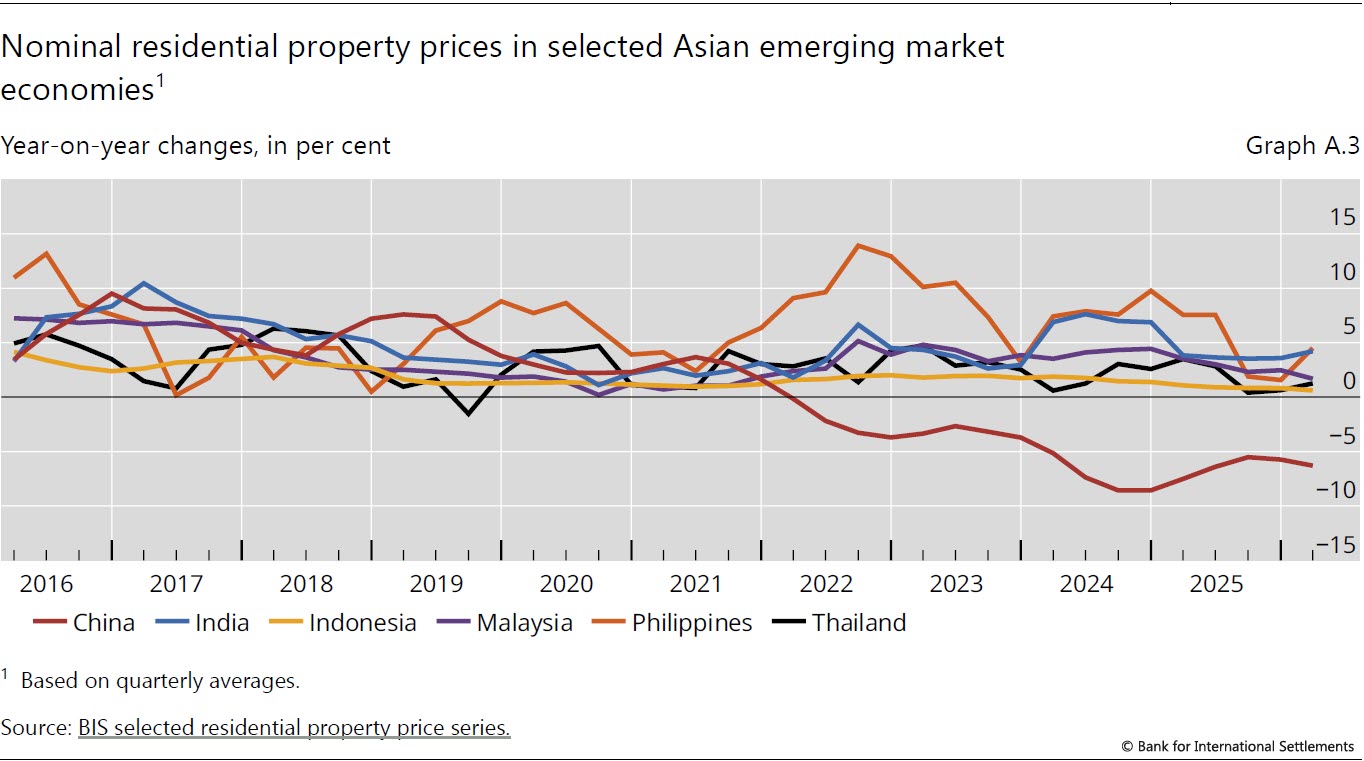
Annex A: Nominal house price developments
2 Footnotes
| 1 | Real residential property prices refer to nominal residential property prices (which in Q1 2026 grew by 1.7% globally) deflated by the consumer price index. Global and regional figures are weighted quarterly averages based on rolling GDP and PPP exchange rates. Advanced economies (AEs) comprise the euro area, the non-euro area European economies (Czechia, Denmark, Iceland, Norway, Sweden, Switzerland and the United Kingdom) and the non-European AEs (Australia, Canada, Hong Kong SAR, Israel, Japan, Korea, New Zealand, Singapore and the United States). Emerging market economies (EMEs) comprise Asia (China, India, Indonesia, Malaysia, the Philippines and Thailand), Latin America (Brazil, Chile, Colombia, Mexico and Peru) and other EMEs (Hungary, North Macedonia, Poland, Romania, Russia, Serbia, South Africa and Türkiye). Global figures comprise all listed AEs and EMEs. |
| 2 | As regional aggregate developments (calculated using rolling GDP and PPP exchange rates) are driven mainly by changes in major economies, they can mask the detailed country-level features, as analysed in Graph 3. |