Yields climb, yet risk appetite holds firm

Executive summary
In the review period1 flare-ups in geopolitical tensions tested the positive momentum that had characterised the first half of the year. Markets faced bouts of volatility as hostilities in the Strait of Hormuz heightened uncertainty about the inflation and monetary policy outlook. On top of that, lingering concerns about the sustainability of fiscal burdens added to the pressure. The prospects of higher rates stemming from these macroeconomic challenges compounded markets’ unease about valuations and possible overinvestment in the tech sector, disrupting the equity momentum driven by artificial intelligence (AI). Yet while investors’ risk appetite ebbed and flowed, it proved resilient on the whole.
Sovereign yields extended their upward march. Monetary policy expectations fluctuated amid flare-ups in geopolitical tensions and generally benign inflation readings in the United States, but eventually rates edged higher. Investors’ uncertainty about the Federal Reserve’s reaction function also contributed to higher volatility in July, especially at the front end of the yield curve. At the long end of the term structure, yields rose further, partly driven by rising term premia that reflected fiscal pressures rather than inflation concerns. The pressure on long-term yields played out in core markets globally. In the euro area, these pressures were compounded by a steady widening of sovereign spreads as energy price swings returned to the fore.
The AI‑led momentum in global equity markets wobbled amid growing signs of vulnerability in the tech sector. Rising concerns about the future profitability of significant AI investments and the sustainability of large profit margins were fuelled by the increasing leverage of major US tech firms. Nevertheless, despite some price corrections for these firms, valuations stayed elevated across US equities. While bouts of aggregate volatility remained contained, even in the wake of the failure of a highly leveraged AI-focused hedge fund, idiosyncratic risks perked up beneath the surface.
Equity market developments reflected investors’ reassessment of prospects in different sectors. In the United States, small caps performed better and outpaced tech firms. In a similar vein, non-US markets took the baton and generally outperformed those in the United States. Across regions, euro area equities posted gains, helped by a smaller tech weight and the strong performance of banks, and emerging market economy (EME) markets also performed well. Amid extreme volatility, Korean markets whipsawed due to heavy semiconductor exposure, magnified by leveraged positioning.
Credit markets reflected the shifts in investors’ risk assessments only in part. While spreads remained compressed by historical standards, investors tilted towards higher-quality borrowers. Large tech firms ramped up their bond issuance, especially at longer maturities. By contrast, issuance slowed in riskier segments. In EMEs, corporate spreads broadly narrowed, except for Europe, the Middle East and Africa where they traded sideways. Gold extended its decline from early‑year peaks and recovered ground only when fiscal woes gained prominence.
- Government bond yields rose, especially those with longer maturities, partly driven by looming fiscal challenges pushing up the compensation that investors require to hold longer-term bonds.
- AI-driven momentum wobbled, given concerns about valuations and potential overinvestment, but investors reallocated their bets across other sectors and countries, underscoring resilient risk appetite.
- Credit markets were relatively unscathed by the ebb and flow of risk appetite, notwithstanding surging bond issuance by large tech firms.
Long rates march higher
Government bond yields extended their march upward, especially at longer maturities, on the back of a tighter expected policy path and rising term premia – the compensation that investors require to hold longer-term bonds. At the beginning of the review period, optimism over the prospects of a resolution of the conflict in Iran initially led yields to fall. However, they resumed their hike when tensions flared up at the end of June, amid growing concerns over the potential consequences of a prolonged conflict for the near-term inflation outlook, as well as for fiscal balances.
As geopolitical tensions came to the fore, market-based expectations of policy rate trajectories edged up, reflecting possible inflationary pressures in the short to medium run. In the United States and the euro area, the expected hiking of policy rates was gradual across all horizons, while in Japan it was more pronounced and front-loaded, extending until the end of 2027 (Graph 1.A).
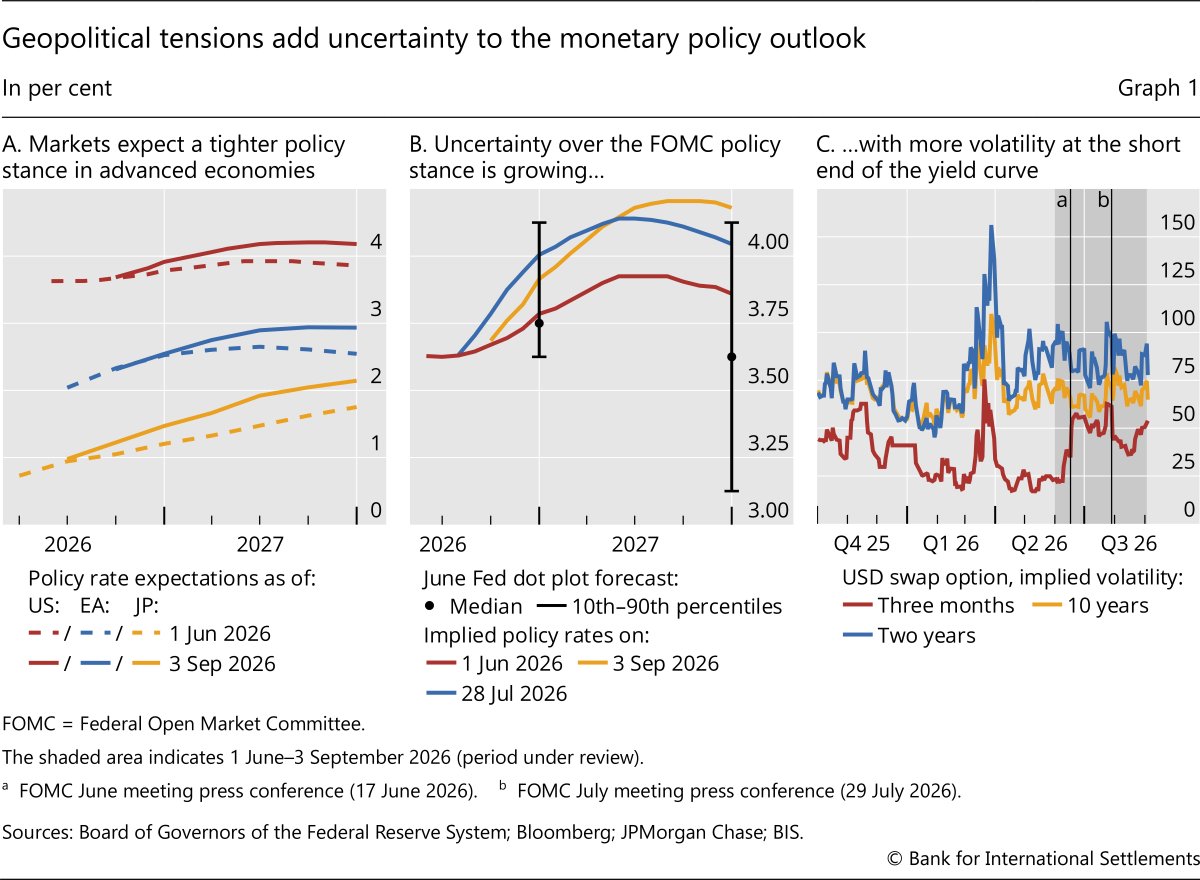
Markets were especially attuned to any signs of a shift in the policy stance of the Federal Reserve. As the conflict with Iran flared up again at the end of June, markets started pricing a swifter tightening of policy to fend off a possible pass-through of higher energy prices to inflation (Graph 1.B, blue line). Yet the Federal Open Market Committee (FOMC) held rates steady at its end-July meeting, which led market participants to revise downwards their policy expectations. However, markets later reassessed the likelihood of further policy tightening, pricing it higher following Federal Reserve Chair Kevin Warsh’s speech at the Jackson Hole Symposium, which was perceived as hawkish (yellow line), as well as a robust labour market reading for August.
The increased policy uncertainty, coupled with more concise communication, was reflected in higher bond market volatility. After the June FOMC meeting, volatility at the short end of the yield curve edged up and remained elevated, while longer maturities experienced a more transitory volatility increase after the July meeting (Graph 1.C). However, despite the uncertainties over the course of monetary policy, market-based measures of inflation compensation remained remarkably stable.
Arguably the main locus of market action was the long end of the yield curve, which saw especially pronounced upward pressure. As the likelihood of a tighter policy path increased at the end of June, 10-year government bond yields also resumed their upward trajectory. Overall, they had risen by 31 basis points in the United States, 34 basis points in Germany, 27 basis points in Japan and 24 basis points in the United Kingdom by the end of the review period (Graph 2.A).2 Looking at the ultra-long end of the yield spectrum, 30-year yields extended their upward hikes, reaching multi-decade highs in many jurisdictions (Graph 2.B). Against this backdrop, on 19 August, the US Treasury announced a plan to buy back long-dated government bonds to support their liquidity (see Box A). While the announcement initially caused long-term yields to fall, they soon retraced a sizeable part of their initial declines. The announcement also triggered a rebound in gold prices, which had been on a downward trajectory since March.
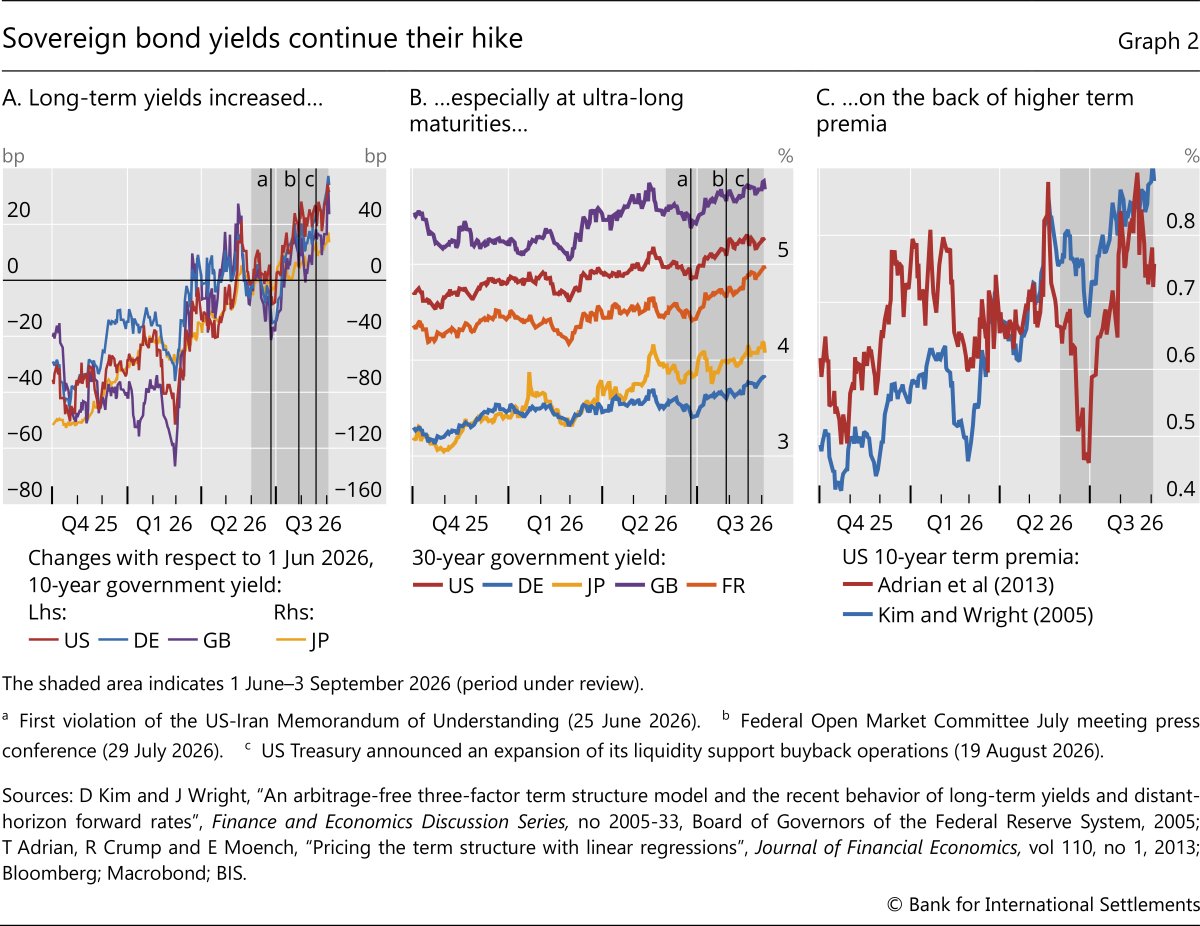
The upward pressure on bond yields due to shifts in policy expectations was compounded by rising term premia. Following the flare-up of the conflict with Iran at the end of June, term premia for US 10-year government bonds rose by around 10 basis points according to different estimates (Graph 2.C), accounting for about 40% of the overall increase in 10-year yields.
With long-run inflation expectations remaining well anchored, model-based estimates indicate that increases in term premia were primarily driven by their real component (Graph 3.A). Several factors influence this part of the term premium. It can reflect growing uncertainty over the future path of short-term rates, including due to the possibility of higher equilibrium rates on the back of an AI-driven productivity boom. It can be influenced by possible crowding-out effects due to the increasing bond issuance of large tech firms. But it is also linked to the fiscal outlook and the looming challenges for debt sustainability. While the precise contributions of these factors are difficult to disentangle, collectively they prompted investors to demand higher compensation for the risks associated with holding long-term government debt.
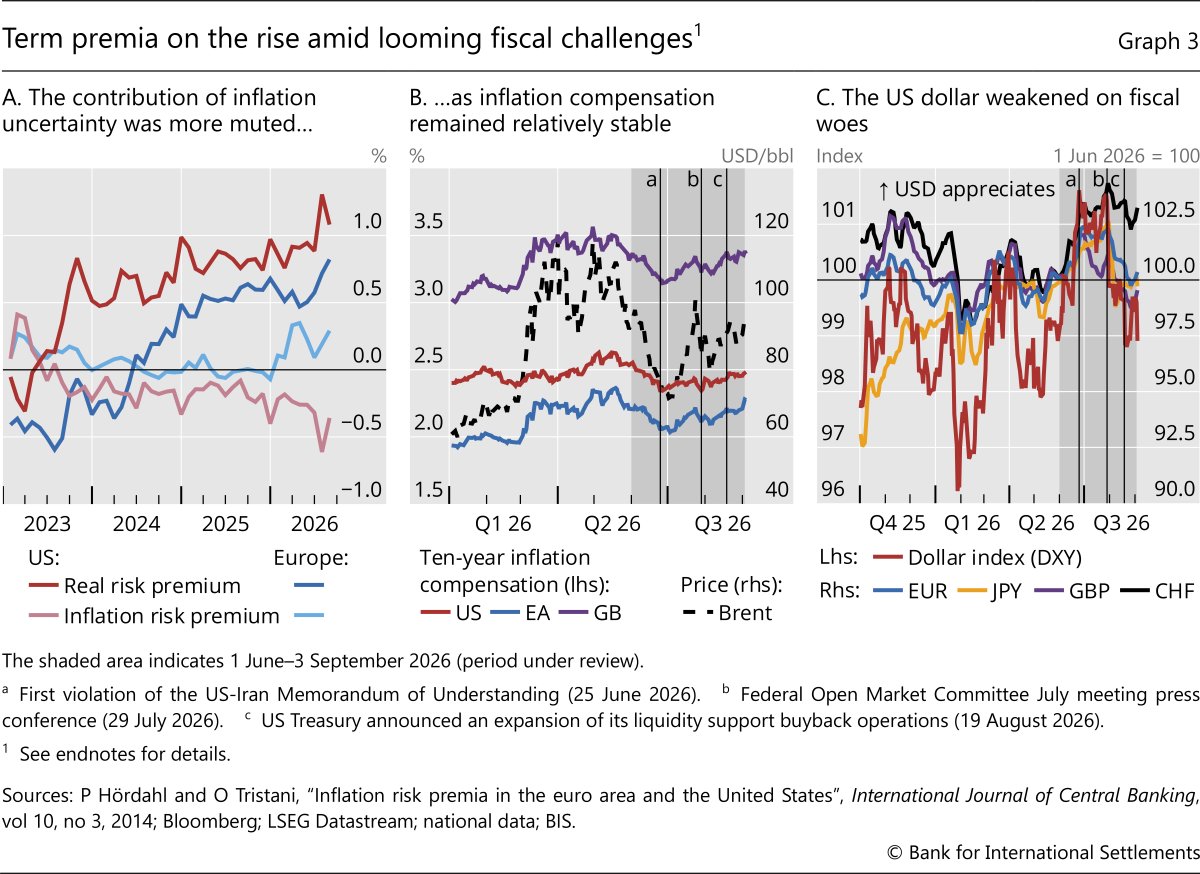
Market-based measures of longer-run inflation compensation remained relatively stable amid the waxing and waning of the prospects of a resolution of the Iran conflict. In July, as oil prices surged, 10-year inflation swap rates barely moved in the United States and increased only marginally in the euro area. This stands in contrast with the first half of the year, when such gauges moved in lockstep with oil prices, especially in the euro area and the United Kingdom (Graph 3.B). Overall, this signalled that markets became less attuned to the ups and downs in Iran-related news and remained confident that central banks would navigate these challenges.
Movements in interest rate differentials and looming fiscal woes also shaped exchange rate developments. The US dollar appreciated against most major advanced economy currencies until end-July as markets priced in faster policy tightening, but it shed most gains in August (Graph 3.C). The yen had depreciated significantly as the rate differential widened (yellow line), yet it saw a sharp recovery on 31 July following a joint official intervention by the Japanese ministry of finance and the US Treasury, and stabilised thereafter. The US Treasury announcement of 19 August also led to a depreciation of the dollar which persisted longer than the related fall in yields.
Puriya Abbassi, Giulio Cornelli, Marco Lombardi, Andreas Schrimpf and Vladyslav Sushko
Debt management offices around the world regularly carry out bond buyback operations.
On 19 August the US Treasury announced an extraordinary expansion of its liquidity support buyback operations. This expansion entails doubling the maximum size of nominal long‑end securities buybacks, from $2 billion, so far, to at least $4 billion per operation, effective from 9 September through 4 November. The operations will be concentrated in the 10–20‑year and 20–30‑year segments where liquidity in off-the-run securities had been structurally poorer and upward pressure on yields more pronounced in past weeks. The announcement implies about $14 billion of additional incremental purchases. In the recent tenders for buybacks of long-term Treasuries, the sellers of securities with those tenors were offering eight to 12 times what the Treasury has been willing to buy (Graph A1.A).
The expected effect of these buybacks on the maturity of the Treasury’s debt is small. The weighted average maturity (WAM) of outstanding debt will decrease by a negligible amount, estimated at around three days.
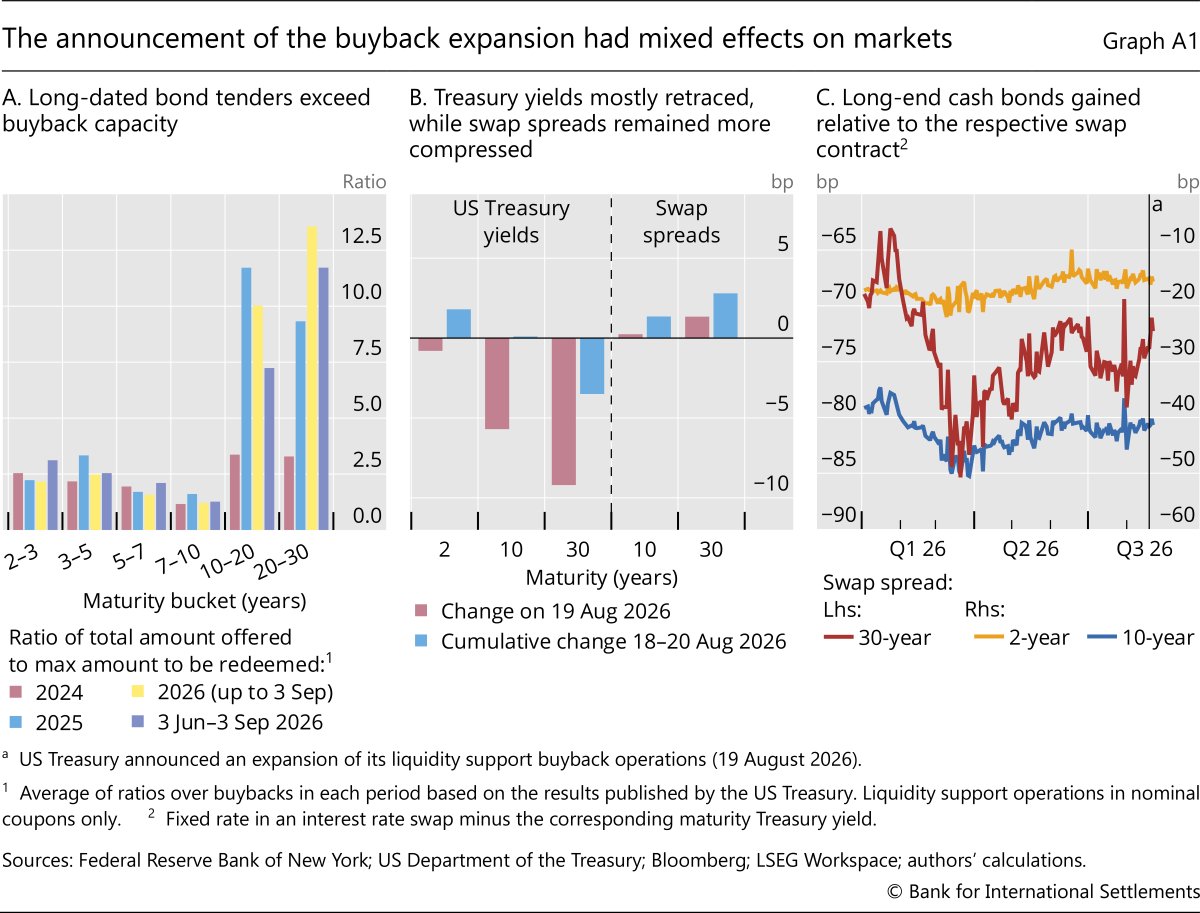
Announcement effects persisted longer in relative prices (spreads) than in the levels of long-term yields. In line with the buybacks targeting the very long end, 30-year and 20-year yields fell around 10 basis points and the 10-year yield fell nearly 6 basis points (Graph A1.B). Measured against the shifts in yields of recent months the reaction was modest and not very lasting. The more persistent response to the announcement showed in swap spreads for ultra-long bonds. Long-dated securities had been trading at a discount to derivatives, which was partly reduced by the prospect of a larger buyer for precisely those securities. These effects are visible in swap spreads, that is, the difference between the swap rate and the yield of cash bonds for the corresponding tenor. Akin to a “local supply effect” in a specific segment, the 30-year spread narrowed on 19 August and further compressed on the following day, while cash yields were already retracing (Graph A1.C).
The signalling value may matter more than sheer quantities. Some market participants interpreted the announcement as potentially signalling further shifts in issuance patterns, towards fewer long-term bonds and a greater share of Treasury bills. The next refunding announcement is scheduled for early November.

Risk assets stirred but not shaken
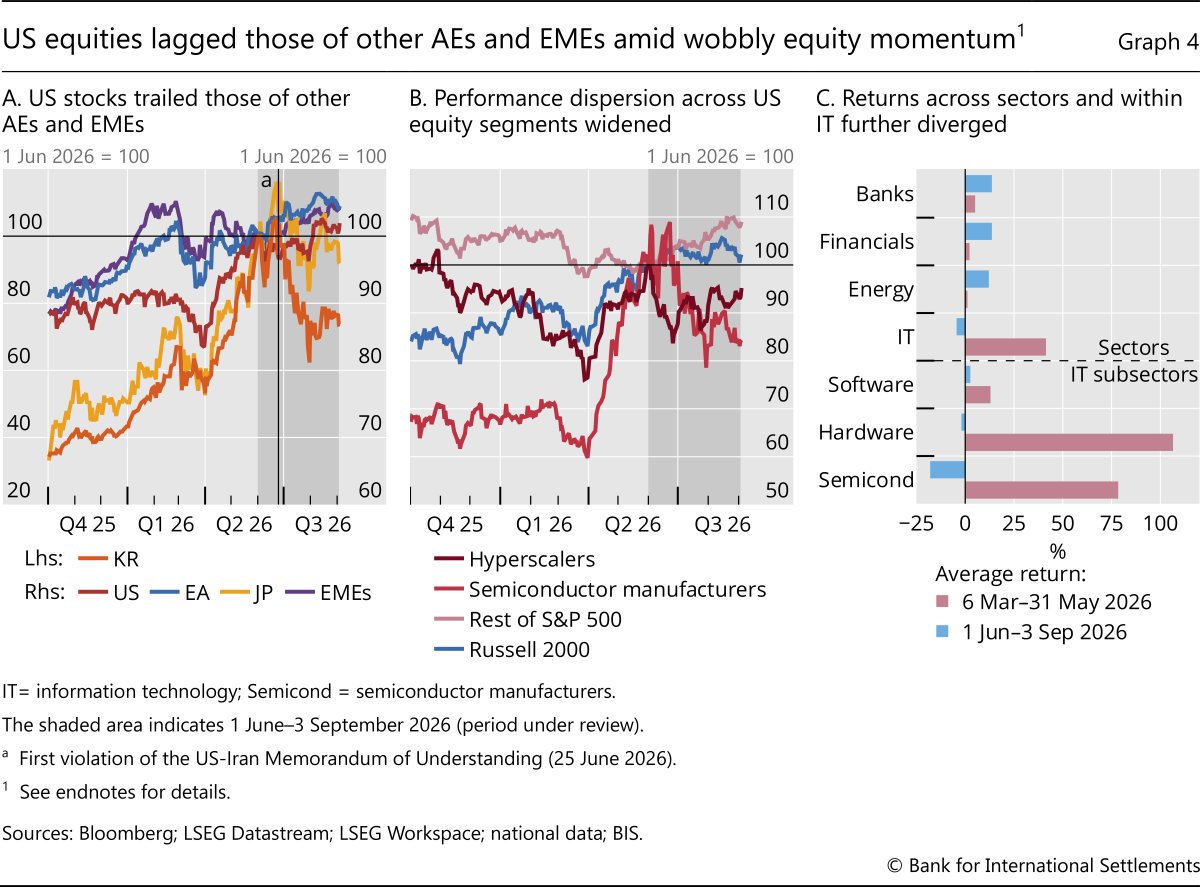
Despite some wavering, risk appetite proved broadly resilient to challenges from geopolitical tensions and rising yields. At the end of June, the positive momentum in tech stocks started to falter (Graph 4.A) as the macroeconomic challenges of a prolonged conflict in Iran weighed on sentiment. This was compounded by investors’ unease about the future profitability of large AI investments made by hyperscalers – big US tech firms active in cloud computing and data centres.
Some investors reacted to AI woes by reallocating their portfolios towards other sectors and countries, which led to equity returns being more dispersed. At the most extreme, Korean markets plunged (Graph 4.A, orange line), due to their greater exposure to AI-linked firms and the turmoil in a few leveraged investment vehicles (see Box B). Euro area equities instead rose steadily (blue line), outpacing a choppier US market (red line), also thanks to the strong performance of banks. Japan’s equity markets retained the positive momentum for the first part of the review period, but reversed their gains as geopolitical tensions intensified and energy prices surged (yellow line). EME equities benefited in this environment, supported in part by capital inflows and investors seeking greater diversification (purple line).
As the rally of tech stocks lost steam, the reallocation extended across sectors and among IT-related subsectors. Within the US stock market, small caps and the rest of the S&P 500 outperformed the hyperscalers and semiconductor manufacturers (Graph 4.B). More traditional sectors extended their positive performance (Graph 4.C). Returns varied markedly within the IT sector as well, reflecting investors’ growing selectiveness in AI‑connected industries.
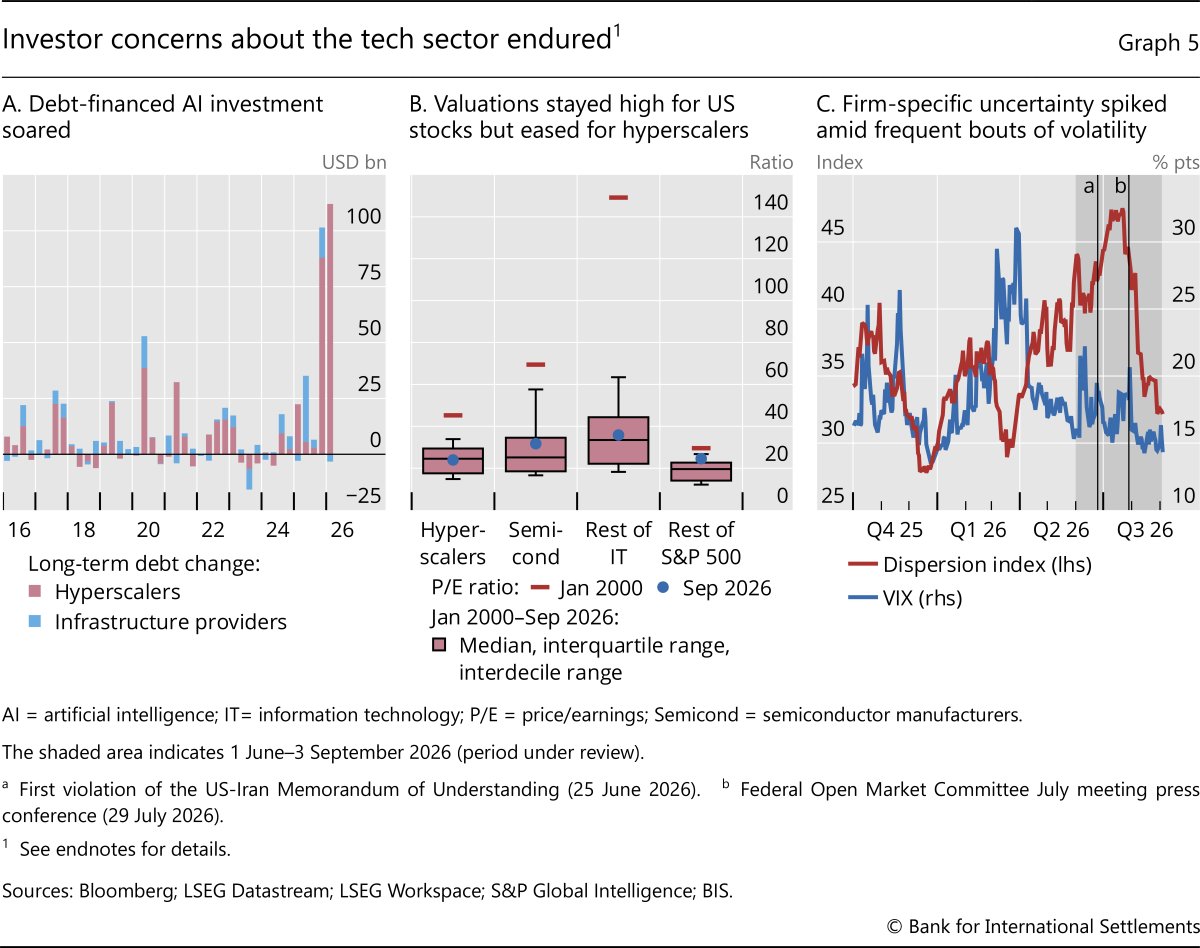
The faltering momentum in hyperscalers’ stock prices, despite their solid earnings, meant a drop in their valuations. Investors demanded a higher premium amid mounting unease about their booming debt issuance (Graph 5.A) and the sustainability of high profit margins. Price/earnings ratios of the broad IT sector thus dropped by between nearly 15% for hyperscalers and 40% for semiconductor manufacturers. After this correction, hyperscalers’ valuations appeared to be more moderate, at least by historical standards. By contrast, valuations remained elevated across other US equities: while they were still far from the January 2000 dotcom levels for IT-related sectors, they edged close to those peaks for the rest of the S&P 500 (Graph 5.B).
Despite AI-related jitters and a rise in idiosyncratic risks, overall equity volatility remained contained. The relatively muted spikes in aggregate volatility gauges masked growing fissures, as firm-specific uncertainty and divergence across sectors dominated the risk backdrop (Graph 5.C). In July, the dispersion index – a measure of the gap between average single-stock and index volatility – rose to levels last touched in April 2025, while the VIX increased only modestly. As risk-taking sentiment reasserted itself in August, both measures subsided. Over the full review period, volatility remained broadly compressed even as markets absorbed a sizeable unwind of a hedge fund after its leveraged strategies on AI firms went sideways in July.
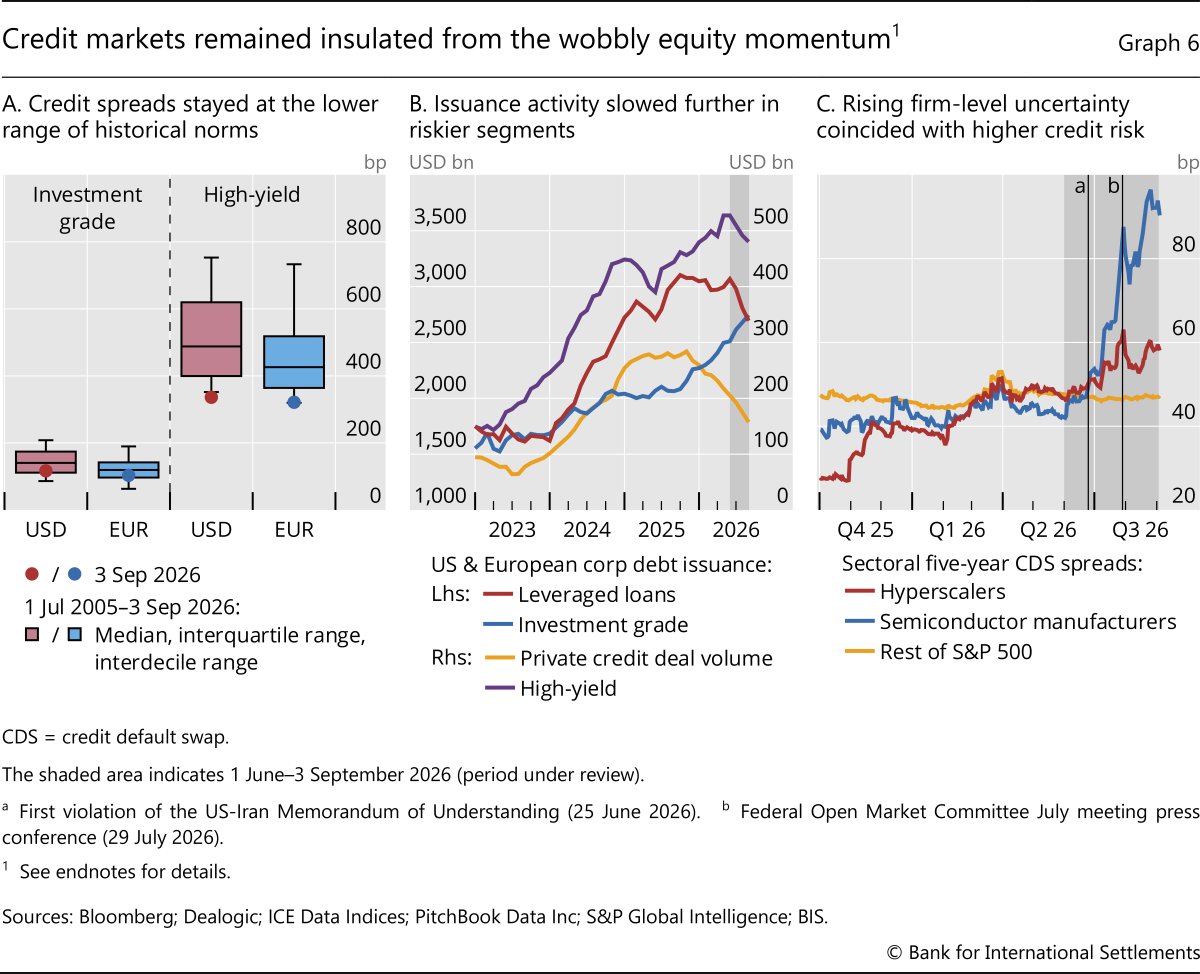
Credit markets weathered the rise in yields and bouts of turbulence, with spreads remaining compressed near historical ranges (Graph 6.A). Investment grade issuance grew – also sustained by strong long‑tenor issuance from hyperscalers – underscoring investor preferences shifting towards higher-quality borrowers (Graph 6.B, blue line). That said, some signs of softening appeared in issuance activity in riskier segments. Specifically, the issuance of high-yield bonds and leveraged loans slowed notably, pointing to a languishing investor appetite in lower-rated securities (purple and red lines). Private credit deal-making also remained weak (yellow line), extending its earlier downturn amid persistent redemption and valuation pressure.
Nonetheless, investors appeared to become more selective, demanding greater risk compensation amid hyperscalers’ booming debt issuance. A sign of this is the rise in credit default swap (CDS) spreads – a gauge of the risk of holding debt – of hyperscalers and semiconductor manufacturers. (Graph 6.C, red and blue lines, respectively). By contrast, CDS spreads remained stable for the rest of the S&P Index (yellow line).
Karamfil Todorov
Leverage can turn ordinary market moves into outsize ones. When leveraged positions must be adjusted as prices change, the adjustment often tends to run in the same direction as the market, so that leverage amplifies volatility rather than dampening it. Much of this activity is hard to observe, but one part has become highly visible: leveraged single-stock exchange-traded funds (ETFs), whose assets in the United States alone exceeded $190 billion in 2026.
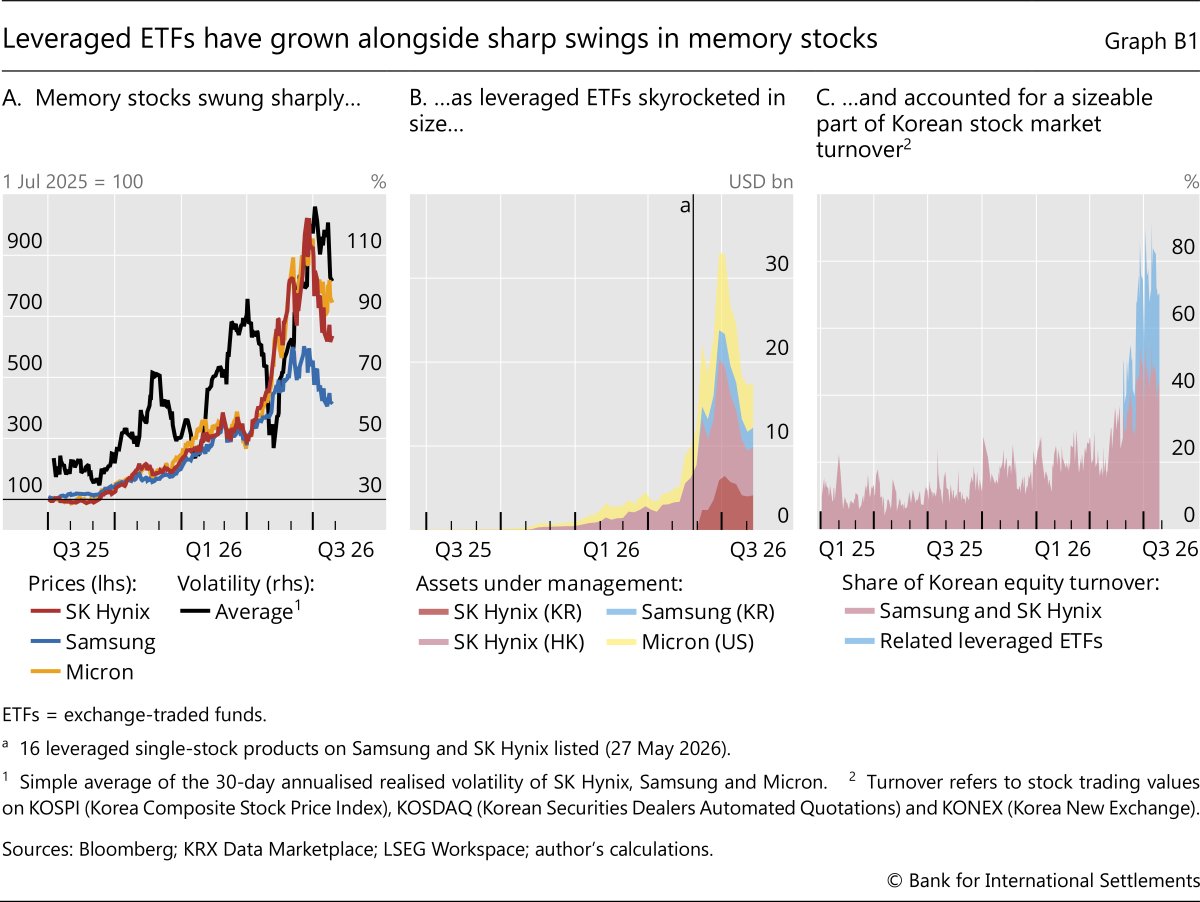
The common thread running through these instruments is that some financial intermediary must trade in the direction of the market to keep a promise made to investors, amplifying the move. Consider a leveraged ETF that promises twice a stock’s daily return. When the stock falls, the fund’s leverage mechanically rises above its target, so it must sell to bring leverage back down. When the stock rises, leverage falls below target and the fund must buy. Either way, it trades in the direction of the move.
The assets subject to this mechanical rebalancing have grown from a negligible to a sizeable share of trading in the affected stocks within a year. Combined assets of leveraged products on the major memory stocks Samsung, SK Hynix and Micron rose from under $100 million in mid-2025 to a peak above $38 billion in June 2026 (Graph B1.B). The two Korean names that dominate these products accounted for more than 50% of total Korean equity trading value in mid-2026, up from 12% through 2025 (Graph B1.C).
This rebalancing is now large enough relative to the stocks’ liquidity to move prices. For SK Hynix, the amount that funds must trade on a 10% move in the share price – the kind of move seen repeatedly in mid-2026 – rose from a few hundred million dollars in late 2025 to almost $5 billion at its June peak, all in the same direction as the move (Graph B2.A). Set against the stock’s daily turnover of under $10 billion, such flows could add roughly 2–4 percentage points to a 10% move,
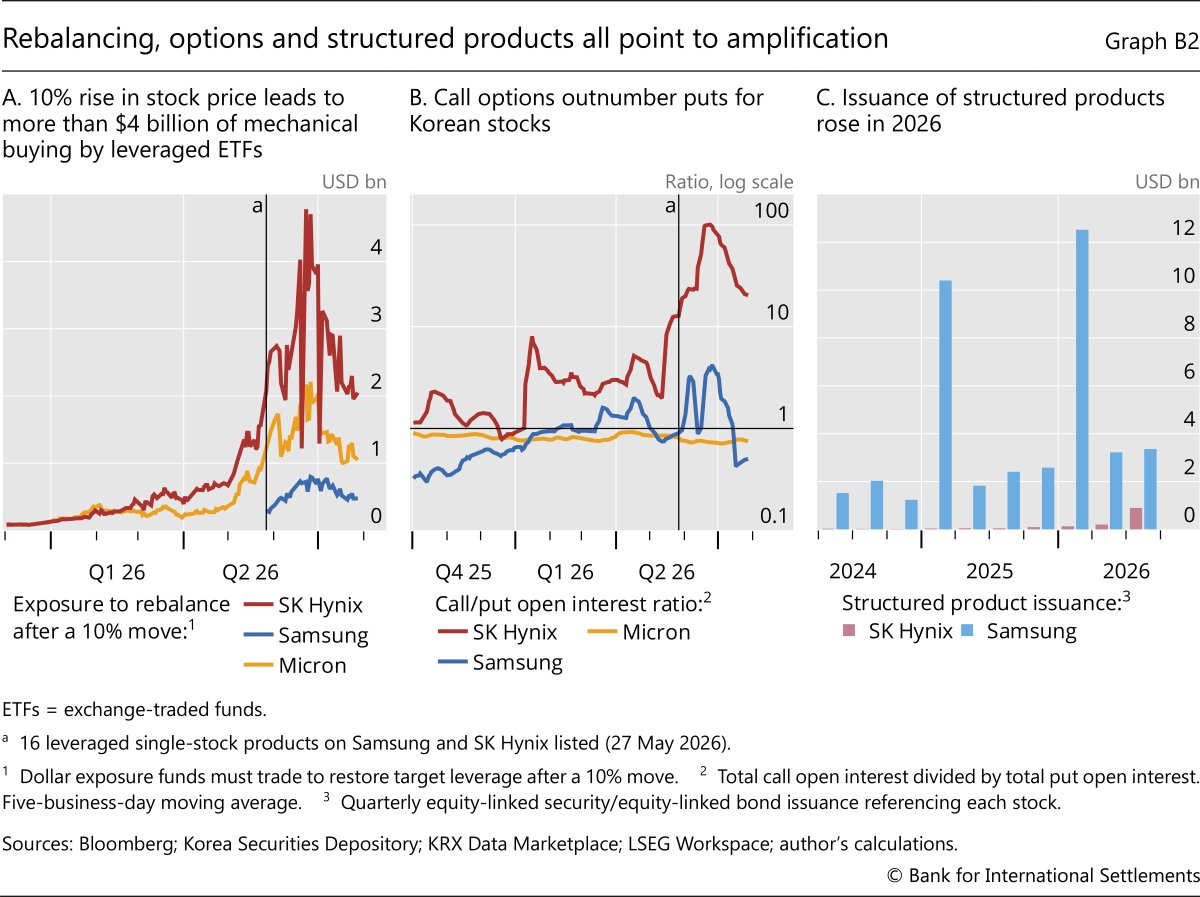
Options markets point to the same mechanism via another instrument. Investor demand in the two Korean companies has been overwhelmingly one-sided towards calls. The ratio of call to put open interest on SK Hynix rose about thirtyfold between March and June 2026, peaking near 100, and Samsung showed a milder version of the same pattern. For Micron, by contrast, the ratio stayed below one throughout (Graph B2.B). Demand for calls on this scale leaves dealers who sell them holding the mirror-image position. Hedging it requires the same “buy high, sell low” pattern as the leveraged ETFs, from an entirely separate instrument.
Leveraged ETFs and listed options are not the whole story. Autocallable structured products, widely sold to retail investors in Korea, redeem early with an enhanced coupon if the underlying asset stays above a set barrier, but expose holders to losses if it falls through a lower one. Hedging these products can require large, destabilising trades near the barriers.
These mechanisms are not new, echoing the amplification encountered in portfolio insurance strategies, volatility-targeting and risk-parity funds. What sets the Korean episode apart is its concentration: a handful of instruments referencing two stocks that dominate an index, in a market where retail participation and leverage are both unusually high. But the main dynamic is general: wherever leveraged and hedging-driven products grow large relative to the liquidity of the underlying asset, price-insensitive demand can amplify moves.
Investors’ search for diversification sustained EME assets
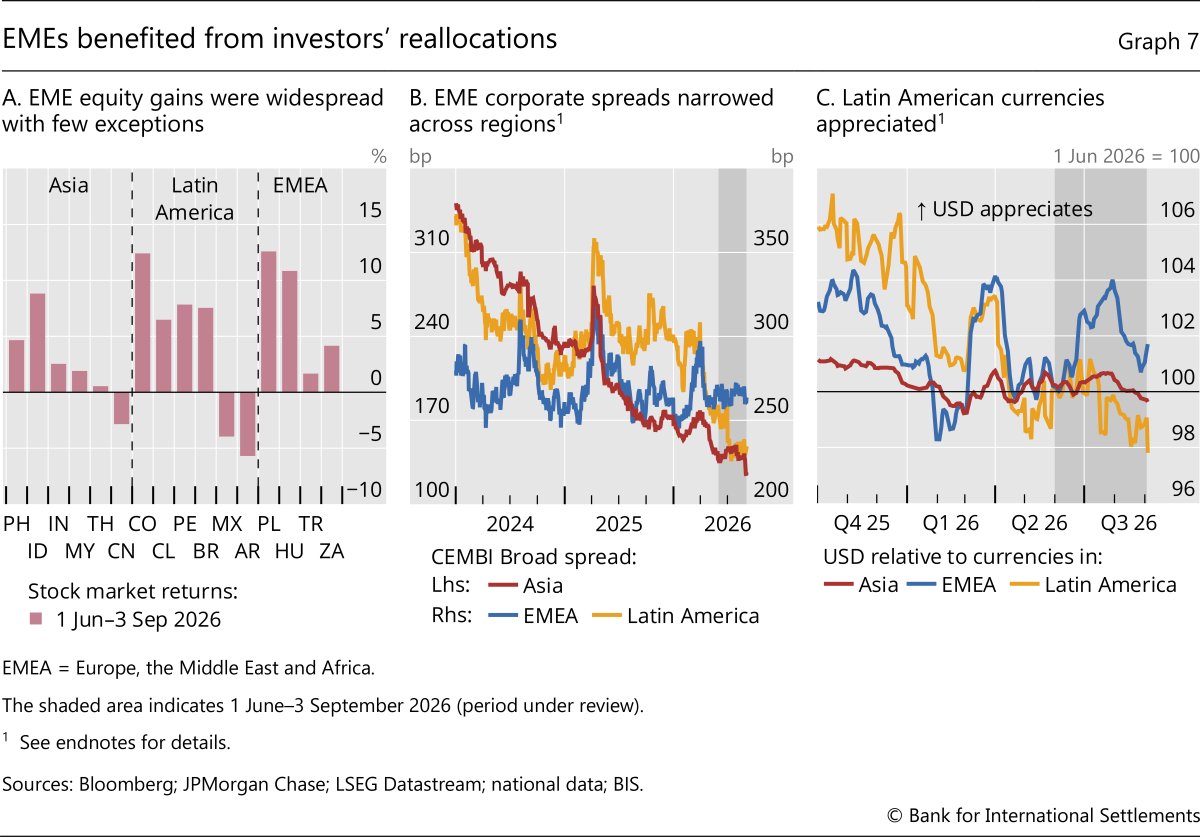
Risk assets in EMEs proved resilient to the seesawing of risk appetite throughout the review period, partly supported by capital inflows and reallocations by global investors to diversify risk. Their equity markets generally performed better than those of most advanced economies, and corporate bond spreads narrowed further. Across EME regions, stock market gains were broad‑based, with a few exceptions in Latin America (Graph 7.A). Among Asian EMEs, China was the exception, losing nearly 3%, amid signs of fading risk appetite among investors, slowing domestic demand and ongoing weakness in the real estate market. Corporate credit spreads compressed in Asia and Latin America and traded mostly sideways in Europe, the Middle East and Africa (EMEA) (Graph 7.B).
EME exchange rates responded to changes in terms of trade and exposure to energy price shocks across regions as well as to rate differentials. Rising oil and metal prices improved the terms of trade for energy-exporting economies, particularly in Latin America, and led to an appreciation of their currencies (Graph 7.C, yellow line). By contrast, Asian EME currencies were broadly stable while EMEA currencies faced significant headwinds (red and blue lines, respectively). Consistent with the terms of trade channel, in June the dollar’s broad appreciation saw commodity importers’ currencies hold value relatively better. By contrast, as tensions flared up and the cease fire was broken, energy exporters’ currencies posted larger gains.
Annex
Vladyslav Sushko and Karamfil Todorov
Leveraged relative value (RV) trades – strategies that seek to profit from small price gaps between similar instruments – have grown quickly in bond markets in recent years. This box reviews the appeal of a fastgrowing variant, the swap spread trade, which pairs a government bond with an interest rate swap, across the United States, the United Kingdom, the euro area and Japan. In these markets, government bonds have become “cheap” relative to interest rate swaps, creating attractive opportunities for RV traders. These spreads also move closely together: one common factor explains most of their comovement across core bond markets.
Government bond markets in major advanced economies have had to absorb a large volume of supply in recent years, amid higher issuance and central banks’ quantitative tightening. With government bonds increasingly trading at a discount to related derivatives, leveraged investors such as hedge funds stepped in to fill the gap left by institutional investors and constrained dealers. By taking the other side of the supply, these funds have become important warehousers of government bonds, helping markets to clear.
The two main RV trade variants with derivatives involve buying a cash bond and selling a futures contract or an interest rate swap. Because the earned spread is small, the strategy relies on high leverage. The cash leg is funded with repo borrowing against the government bond as collateral, often at low or zero haircuts, while the large notional derivatives position is sustained by posting margins. Recently, new RV activity has shifted towards trades that use interest rate swaps.
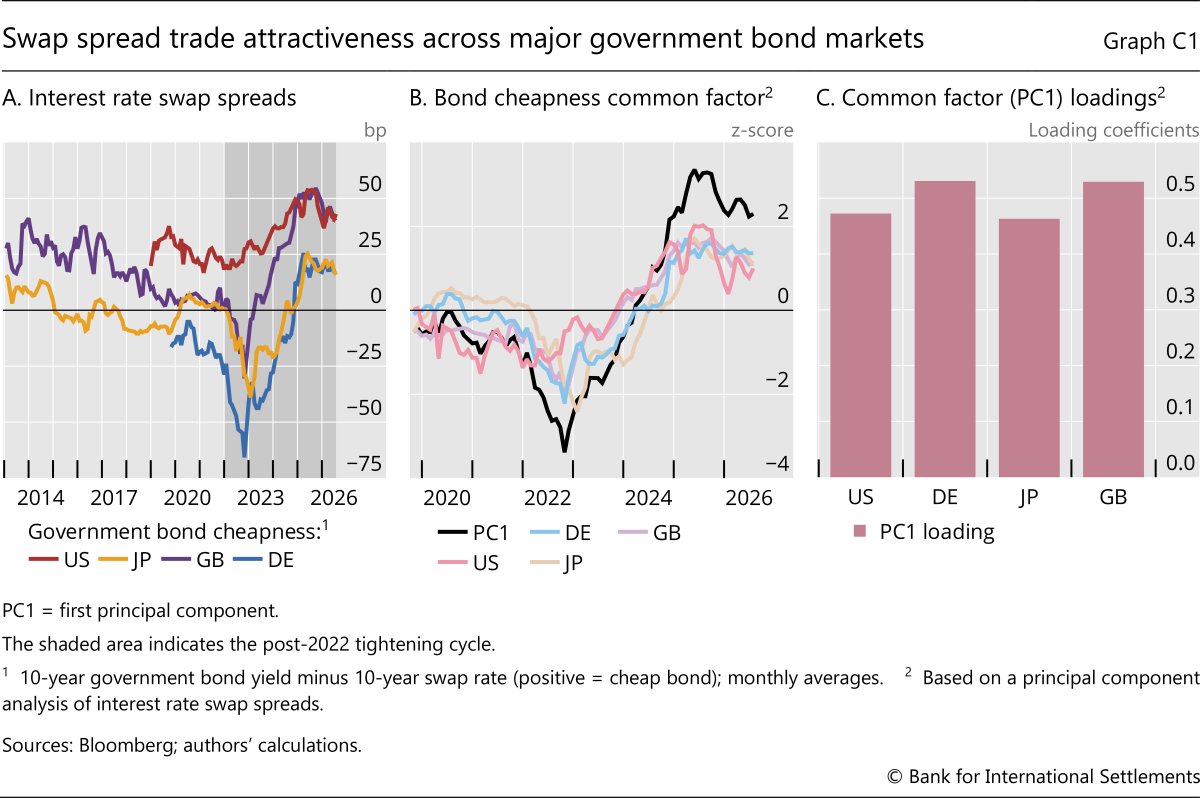
Interest rate swap spreads have become attractive for RV trades across major government bond markets. By 2025, government bond yields exceeded swap rates across the board: by around 50 basis points on average in the United States and the United Kingdom and by about 20 basis points in Germany and Japan (Graph C1.A). Some contraction of the spread in the US towards end-2025 may reflect the relaxation of leverage rules, which allowed major banks to increase the amount of government bonds held on their balance sheets, including as part of the swap spread trade.
Principal component analysis indicates that the swap spreads are tightly linked across major sovereign markets. A single factor explains 83% of the common monthly variation in bond cheapness, with the first principal component indicating that all four sovereigns now trade at a discount to swaps (Graph C1.B), with near-identical loadings (Graph C1.C). Such a strong common component highlights just how closely interlinked long-term government bond yields are across markets. It also reflects the similarity of domestic drivers in each economy. These include quantitative tightening, inflation and fiscal concerns – along with structurally lower demand from traditional long-term investors (eg defined benefit pension plans) and dealer constraints.
The growing dependence of core bond markets on leveraged RV trading has financial stability implications. The marginal holder of the cash bond is now a leveraged, repo-financed, short-horizon investor (eg a hedge fund). Its ability to hold the position depends on continuous funding access and stable margins, so a shock to repos or a jump in volatility and margins would pressure all legs at once – as in the March 2020 basis-trade unwind and the partial unwind of the swap trade in April 2025. Furthermore, concentration among funds and their prime brokers, coupled with deepening cross-border links, can turn distress at a few institutions into a market-wide shock.
Vladyslav Sushko and Karamfil Todorov
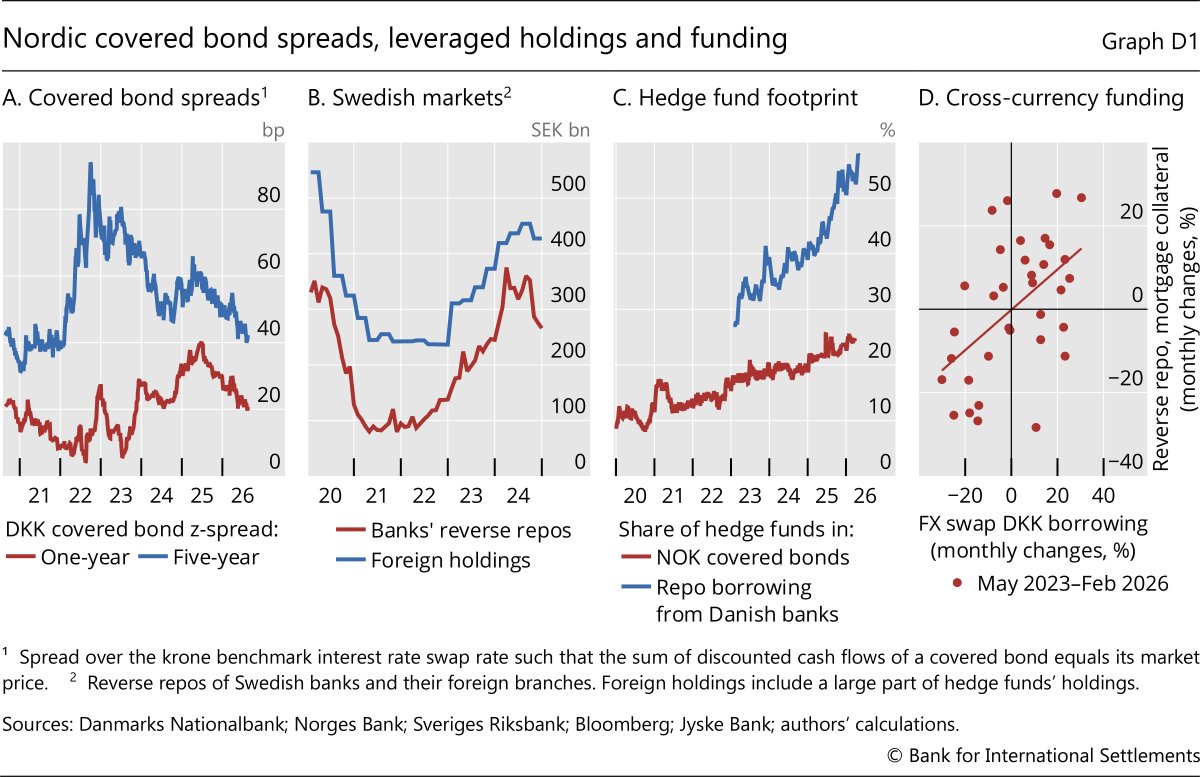
Nordic markets feature their own version of a relative value (RV) trade that profits from price gaps between bonds and interest rate swaps. This trade mirrors the sovereign swap spread trade (see Box C) but uses private sector covered bonds instead. In Denmark, Norway and Sweden, mortgage lenders issue covered bonds for funding. These bonds are considered safe, liquid assets and were long held mainly by banks, but there are limits on how much they can hold. When bonds began trading more cheaply than swaps, hedge funds stepped in to profit from the resulting swap spread, which at times reached 80–90 basis points (Graph D.1.A).
Hedge funds’ holdings of Nordic covered bonds have grown to a substantial market share and have become more concentrated. In Sweden, foreign investors, largely hedge funds, now hold around a fifth of the SEK 2 trillion covered bond market, with the three largest funds accounting for over 40% of foreign holdings.
The RV trades with Nordic covered bonds are tightly interconnected and concentrated. Hedge funds’ repo counterparties consist primarily of large Nordic banks, which also facilitate bond issuances for mortgage lenders. These domestic repo lenders often obtain cash synthetically by swapping from euros. They also hold the covered bonds, considered almost as safe as government bonds, for their own liquidity buffers. These links call for close monitoring of leverage, concentration and crosscurrency funding, and for ensuring that banks manage their risks adequately, eg via adequate repo haircuts, so that this core market stays resilient under stress.
1 The review period covers 1 June to 3 September 2026.
2 With rising yields, government bond “cheapness” relative to derivatives has become a prevailing phenomenon across major bond markets (see Box C in the annex). Attracted by the resulting swap spreads, various leveraged, short-horizon investors, eg hedge funds, have become the marginal buyers of government bonds, even of private sector-issued covered bonds in some European markets (see Box D in the annex).
Graph 3.A: Decomposition of 10-year yield, based on Hördahl and Tristani (2014).
Graph 3.B: Inflation compensation refers to the rate on the fixed leg of a zero coupon inflation swap.
Graph 3.C: For CHF, EUR, GBP and JPY, five-business-day moving average.
Graph 4.A: EA = STOXX Europe 600; EMEs = simple average of stock market returns in AR, BR, CL, CN, CO, HU, ID, IN, MX, MY, PE, PH, PL, TH, TR and ZA; JP = Nikkei 225; KR = KOSPI 200; US = S&P 500.
Graph 4.B: Hyperscalers = Amazon, Apple, Google, IBM, Meta, Microsoft, Oracle. Semiconductor manufacturers comprise 15 firms classified in the Global Industry Classification Standard (GICS) sub-industry “Semiconductors”. The remaining 478 firms are classified as “Rest of S&P 500”. Market capitalisation weighted averages. The composition of the S&P 500 is fixed on 3 September 2026.
Graph 4.C: For each sector, simple average of the respective S&P 500 constituents’ returns.
Graph 5.A: Quarterly changes in long-term debt (net). Based on global financial statements data for seven hyperscalers and 43 global infrastructure providers operating in the following business segments: power and distribution, engineering and construction, networking, cooling systems and AI neoclouds.
Graph 5.B: Hyperscalers = Amazon, Apple, Google, IBM, Meta, Microsoft, Oracle. Semiconductor manufacturers comprise 15 firms classified in the GICS sub-industry “Semiconductors”. Rest of IT comprises 53 firms classified in the GICS sector “Information Technology”. The remaining 425 firms are classified as “Rest of S&P 500”. The composition of the S&P 500 is fixed on 3 September 2026. Market capitalisation weighted average. For September 2026, data as of 3 September 2026.
Graph 5.C: Dispersion index = Cboe S&P 500 Dispersion Index; VIX = Cboe Volatility Index.
Graph 6.A: Spreads of ICE BofAML index yields to overnight index swap (OIS) rates with matched maturities. 10-year OIS for US investment grade; five-year for the rest. The USD OIS rate is based on the Secured Overnight Financing Rate (SOFR) starting on 11 December 2018. The EUR OIS rate is based on the euro short-term rate (ESTR) starting on 11 October 2019. For USD investment grade, the box plot shows data between 28 July 2008 and 3 September 2026, due to data availability of USD 10-year OIS.
Graph 6.B: Twelve-month moving sum.
Graph 6.C: Hyperscalers = Amazon, Apple, Google, IBM, Meta, Microsoft, Oracle. Semiconductor manufacturers comprise six firms classified in the GICS sub-industry “Semiconductors”; the 203 remaining companies of the S&P 500 with available CDS spreads are classified as “Rest of S&P 500”.
Graph 7.B: GDP-PPP weighted average of sub-indices. Asia = CN, ID, IN, MY, PH and TH; EMEA = AE, HU, KW, MA, SA, TR and ZA; Latin America = AR, BR, CL, CO, MX and PE.
Graph 7.C: GDP-PPP weighted average. Asia = CN, ID, IN, MY and TH; EMEA = HU, PL and ZA; Latin America = BR, CL, CO, MX and PE. Five-business-day moving average.