International credit to Africa

International credit to Africa has expanded quickly since the Global Financial Crisis (GFC). Three new elements have distinguished this growth from the past. First, Chinese banks emerged as key lenders on the back of the Belt and Road Initiative. Nevertheless, renminbi usage remained limited, with most international credit still denominated in dollars. Second, more African countries started to borrow internationally following the implementation of debt relief programmes. Third, international bond issuance grew rapidly amid easy financial conditions post-GFC. Beyond these developments, governments remained the dominant borrowers, even increasing their share in international credit in both loans and bonds. London continued to be a key hub from which banks lend to Africa.
JEL classification: F34, F36, G21, F31, G151
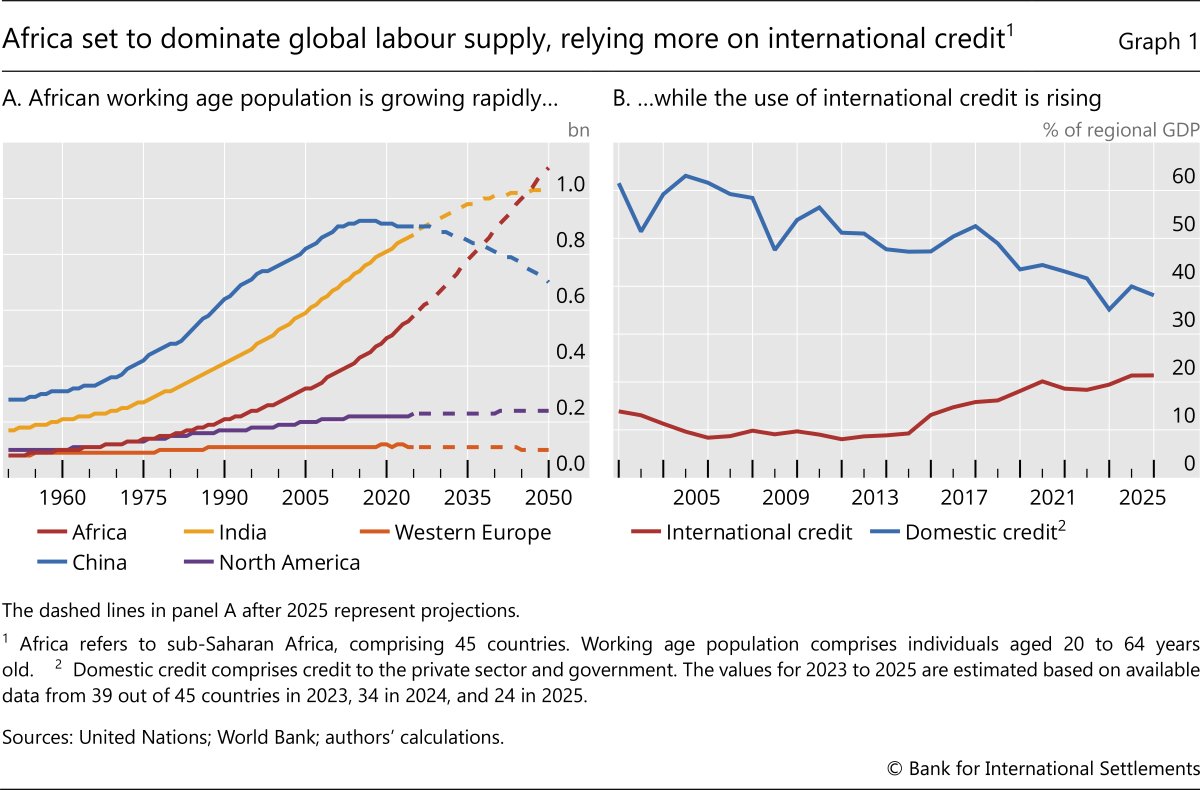
While international credit to sub-Saharan Africa (hereafter “Africa”)2 remains small compared with other regions, Africa’s economic development, along with its financing, holds global significance due to the region’s fast-growing population. The working age population in Africa has already surpassed that in North America and western Europe, and it is set to overtake that in China within the next decade and that in India within 30 years (Graph 1.A).
International credit is particularly relevant for financing investment in Africa, as domestic financing in the region is still maturing (Beck et al (2011)). Indeed, international credit has become increasingly important for the region over the past decade, rising as a share of GDP (Graph 1.B). At the same time, although domestic financial systems have expanded and remained the primary source of credit, the ratio of domestic credit to GDP has been steadily falling. International credit comes with risks, including exchange rate risk, overborrowing or fuelling of domestic credit booms (Ehlers et al (2025)). Nevertheless, it can lower the cost of funding for borrowers in emerging market and developing regions like Africa.
- International credit to Africa, both loans and bonds, has expanded quickly since the Great Financial Crisis, as more African countries have started to borrow internationally.
- Chinese banks became key lenders on the back of the Belt and Road Initiative, though their lending has stalled since 2020.
- Following strong issuance growth, international bonds have become a significant part of the borrowing landscape.
This article examines international credit to Africa and how it has changed over the past half-century. In our analysis, international credit encompasses two primary components: (i) cross-border loans, as captured in the BIS international banking statistics; and (ii) bonds issued in international markets, drawn from the BIS international debt securities statistics. Additionally, we examine local lending by foreign bank affiliates in Africa and domestically issued bonds held by foreigners. By focusing on international credit, our analysis complements existing research on the development of domestic credit in Africa (Manger et al (2023)) and other forms of external financing to the region (Alter et al (2025)).
Since the Great Financial Crisis (GFC), the surge in international credit to Africa has featured three new elements. First, Chinese banks became a dominant provider of bank loans. This growth came on the back of the Belt and Road Initiative (BRI) formalised in 2013 (see Box A). Nevertheless, renminbi usage remained limited, with most international credit still denominated in US dollars. Second, more African countries, beyond just South Africa, began to borrow substantially from abroad, in both loans and bonds. Third, international bond issuance expanded dramatically as a key conduit for international credit to many countries across Africa. Beyond these developments, governments remained the dominant borrowing sector, even increasing their share in international credit for both loans and bonds. London continued to be a key hub from which international banks lend to Africa. US and South African banks in particular channelled their lending to Africa out of their offices in London.
The article proceeds as follows. The next section reviews the historical context of international lending to Africa from the 1970s to the GFC. Subsequent sections examine the surge in international credit post-GFC, leveraging BIS statistics to provide a deeper dive into the lenders and borrowers and documenting new developments.
Drivers of international credit from the 1970s to the GFC
From the 1970s onwards, international credit to Africa was persistently shaped by three key drivers. First, commodity prices affect international credit. They do so by altering borrowing capacity through shifts in the terms of trade, the value of available collateral and their impact on economic growth. Second, global financial conditions affect the supply of credit from international investors and their willingness to lend to African countries. And third, official lending, such as multilateral lending from the International Monetary Fund (IMF) or bilateral lending between governments, can add substantial financing. Official efforts to relieve debt burdens (eg Paris Club, the Heavily Indebted Poor Countries Initiative) can further improve borrowing capacities.
In the 1970s several of these factors worked together to spur international credit to Africa, particularly from commercial banks. Higher commodity prices, notably oil, expanded borrowing capacity. Higher oil prices also boosted credit supply as Western commercial banks recycled petrodollars (Wiegand (2008)), largely out of their offices in London (McGuire (2004)).3 With increased demand from newly independent African governments seeking to develop infrastructure, education and other sources of growth (Fliss et al (2024)), international credit to Africa steadily climbed.
Further reading
• Dollarisation waves: new evidence from a comprehensive international bond database
• Africa's public debt amid global headwinds: balancing resilience and vulnerabilities
• Chinese banks and their EMDE borrowers: have their relationships changed in times of geoeconomic fragmentation?
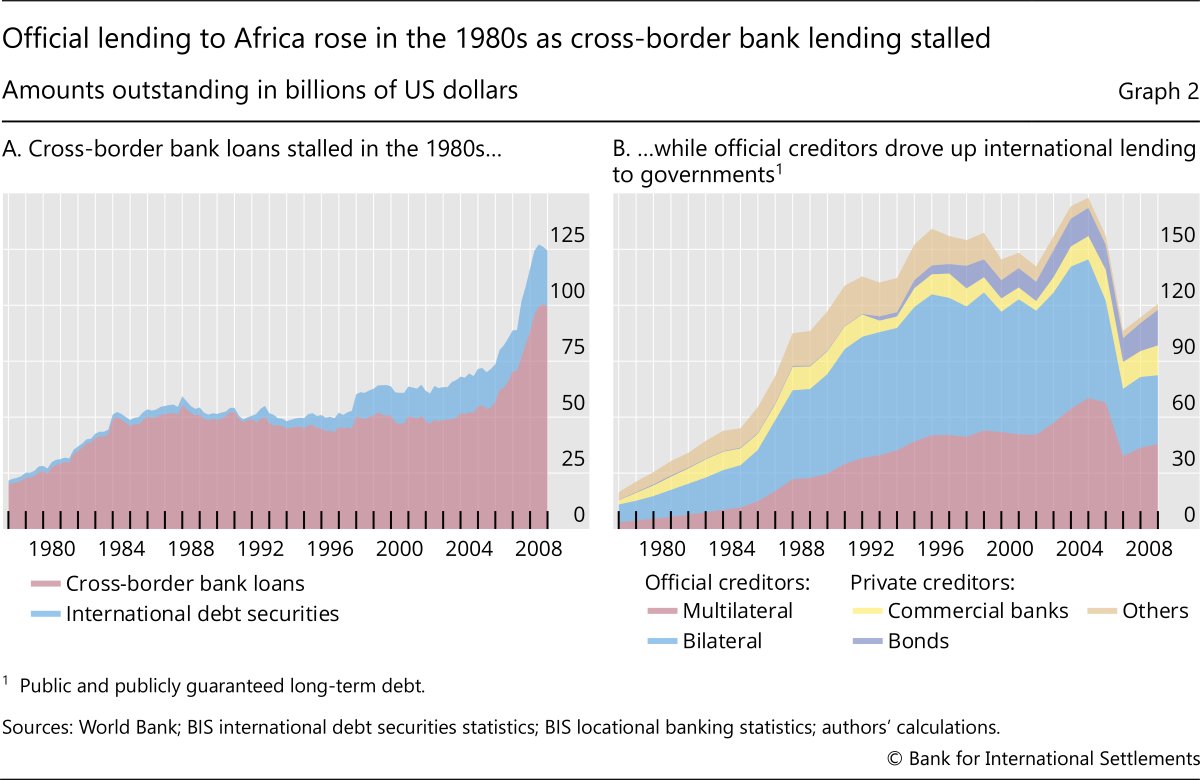
Following this boom, many African countries experienced debt crises in the early 1980s, as these factors turned into headwinds. The accumulated international debt proved to be unsustainable when the Federal Reserve hiked US interest rates sharply in 1979–81, increasing debt service costs. Declining oil and other commodity prices in the mid-1980s further reduced African countries’ ability to service their debts. As a result, defaults among African governments increased and commercial bank lending retrenched (Graph 2.A) (Fliss et al (2024); Graf von Luckner and Horn (2026); Horn et al (2025)).
Official sector lending to African governments expanded significantly in the 1980s as cross-border commercial bank lending stalled. Multilateral credit grew from $6.6 billion in 1980 to $50.3 billion by 1995, while bilateral credit jumped from $14.5 billion to $75.5 billion (Graph 2.B). Nearly 95% of this financing was extended on a concessional basis or as grants, on generally favourable terms (Bhattacharya et al (1997)). Furthermore, the official sector stepped up to coordinate debt relief to Africa by restructuring its debt. The Heavily Indebted Poor Countries Initiative by the IMF and World Bank was launched in 1996 to relieve the debt burdens of the poorest countries and was further complemented by the Multilateral Debt Relief Initiative launched in 2005. This debt relief removed debt overhang and thereby improved borrowing capacity in subsequent years.
A rapid expansion of credit to Africa post-GFC
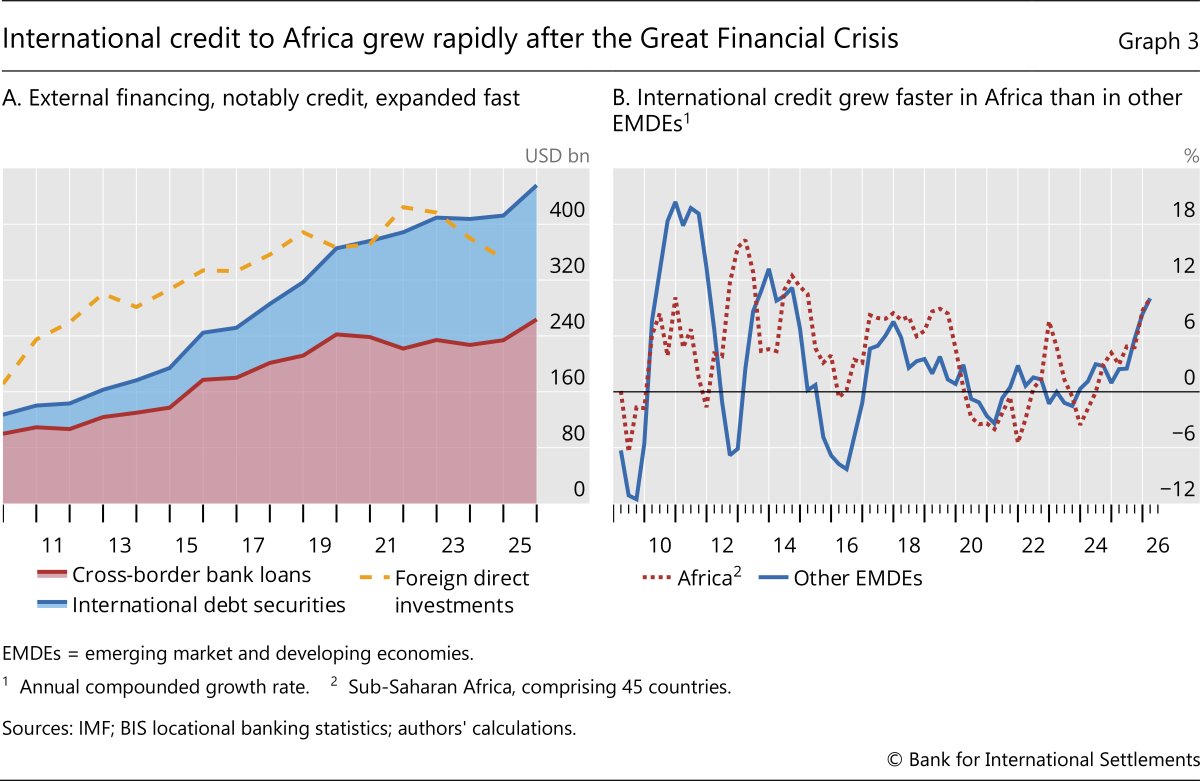
International credit to Africa has grown fast since the GFC. The outstanding volume of cross-border loans more than doubled from around $100 billion at end-2009 to about $264 billion by end-2025 (Graph 3.A). The outstanding volume of international bonds increased more than sevenfold, from around $27 billion to $192 billion during the same period. As a share of African GDP, international bonds rose from 2% in 2013 to 9% in 2024. By 2023, international credit exceeded foreign direct investment to Africa.
As growth in international credit to Africa accelerated, it outpaced that to other emerging market and developing economies (EMDEs) after 2011. From 2009–11, growth of international credit to Africa lagged that to other EMDEs (2% versus 8% annual growth on average). However, from 2012 to 2019, international credit to Africa grew at an annual average rate of 7%, significantly faster than the 2% growth rate observed in other EMDEs (Graph 3.B).
Bank lenders, new and old
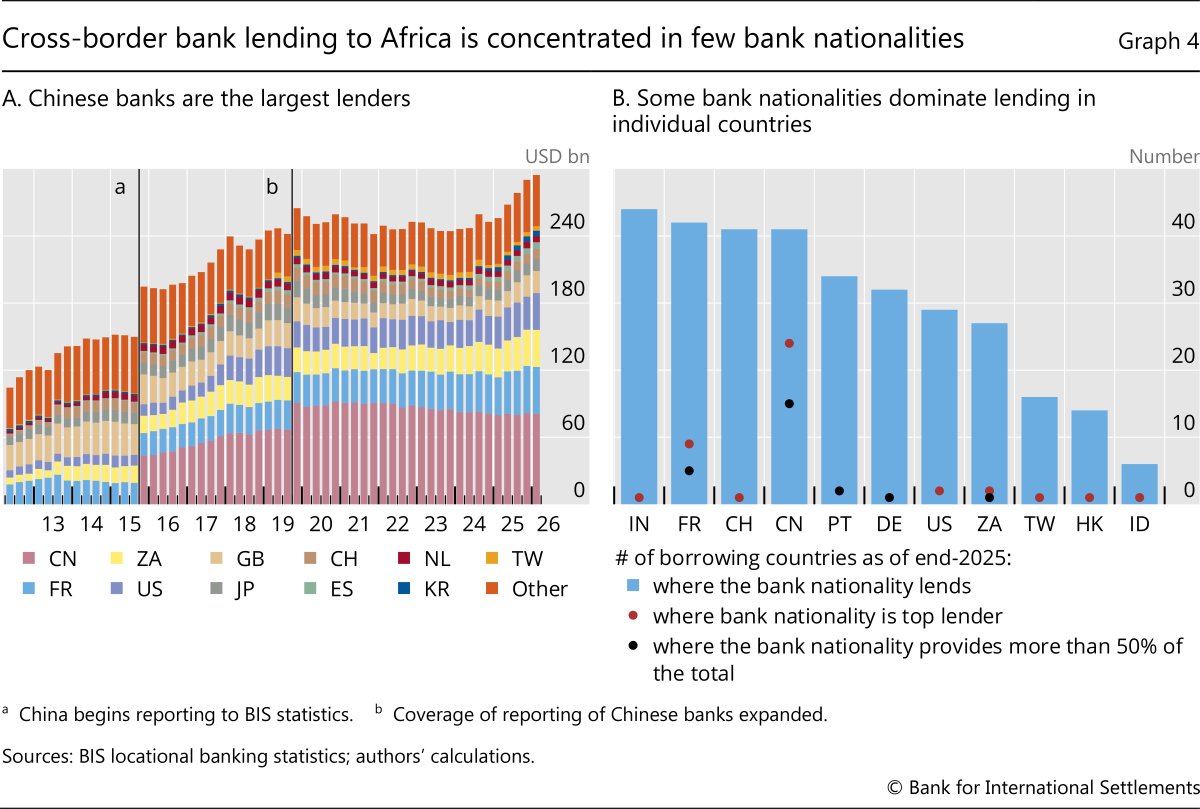
After the GFC, Chinese banks joined Western banks4 in lending to Africa at scale (Graph 4.A). Under China’s Belt and Road Initiative (BRI), various Chinese policy and state-owned commercial banks extended infrastructure loans to borrowers throughout Africa and elsewhere (Box A). These official creditor flows were thus often recorded in cross-border loan data as well. Between 2015, when China began reporting to the BIS banking statistics, and 2020, Chinese banks’ outstanding loans grew to a third of the total cross-border loans to Africa, leaving China’s as the largest lending banking system.5 As of end-2025, Chinese banks lend to more than 40 African countries (Graph 4.B, blue bars) and serve as the primary lender to 24 of them (red dots). For 15 countries, they lend more than 50% of the total (black dots). By comparison, French banks, the second largest lender banking system to the region, are the primary lender to only nine countries.
Bryan Hardy, Swapan-Kumar Pradhan and Előd Takáts
The Belt and Road Initiative (BRI) has supplied substantial new bank lending from Chinese banks to sub-Saharan Africa (hereafter “Africa”) in the last two decades. This box explores the allocation of credit from Chinese lenders via the BRI and how this links to cross-border lending by Chinese banks in the BIS locational banking statistics.
The BRI is a global infrastructure and economic development programme formalised by China in 2013.


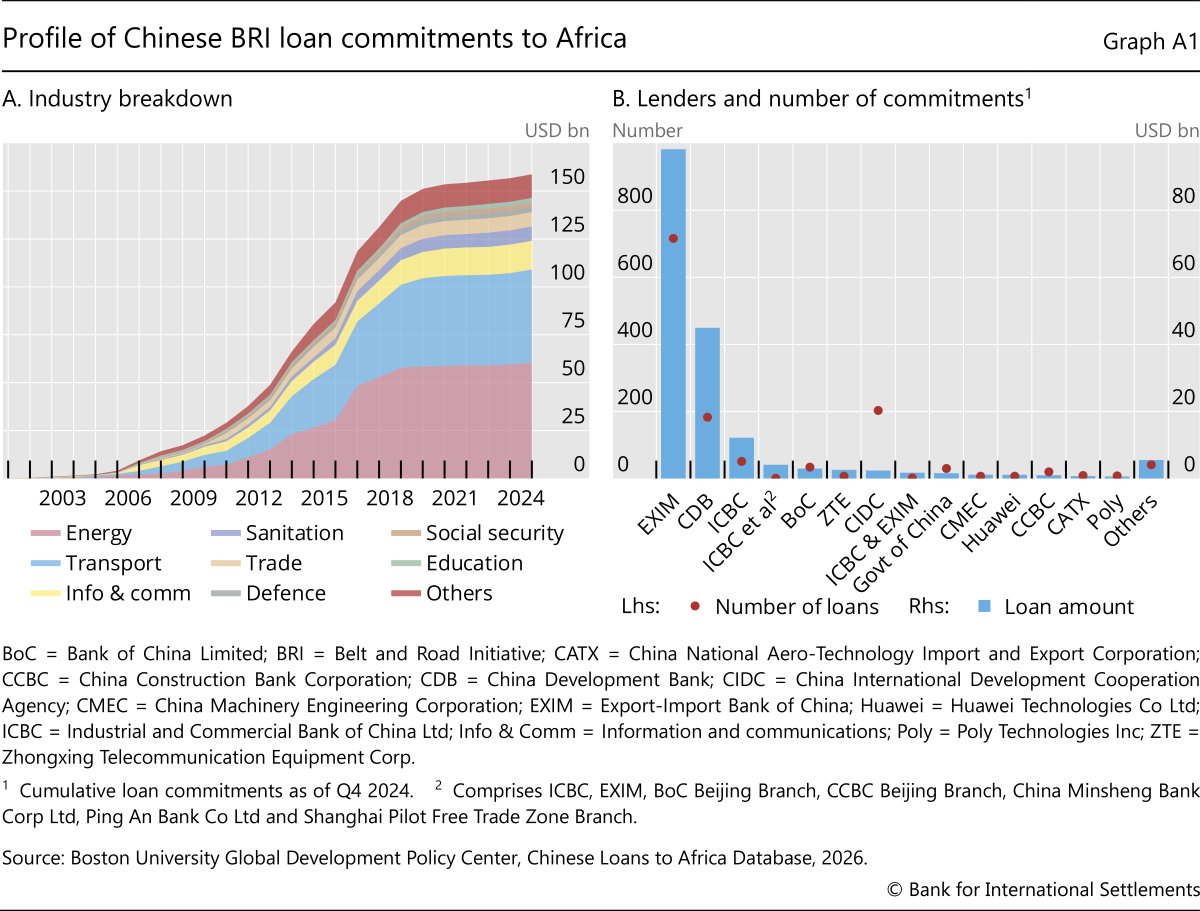
Most BRI loans to Africa were extended by two Chinese state-owned policy banks: the Export-Import Bank of China and the Chinese Development Bank. These two individually accounted for 79% of all BRI loans, and for more as part of syndicates with other lenders (Graph A1.B). These banks differ from commercial banks in three main ways: they fund themselves mainly through government-backed bond issuance; they target very large and long-term projects; and they pursue government goals rather than maximising profitability. In Africa, they explicitly targeted financing for government projects such as for trade and infrastructure investment. The five major state-owned commercial banks such as the Industrial and Commercial Bank of China (ICBC) (the third largest BRI lender) also participated in the BRI.
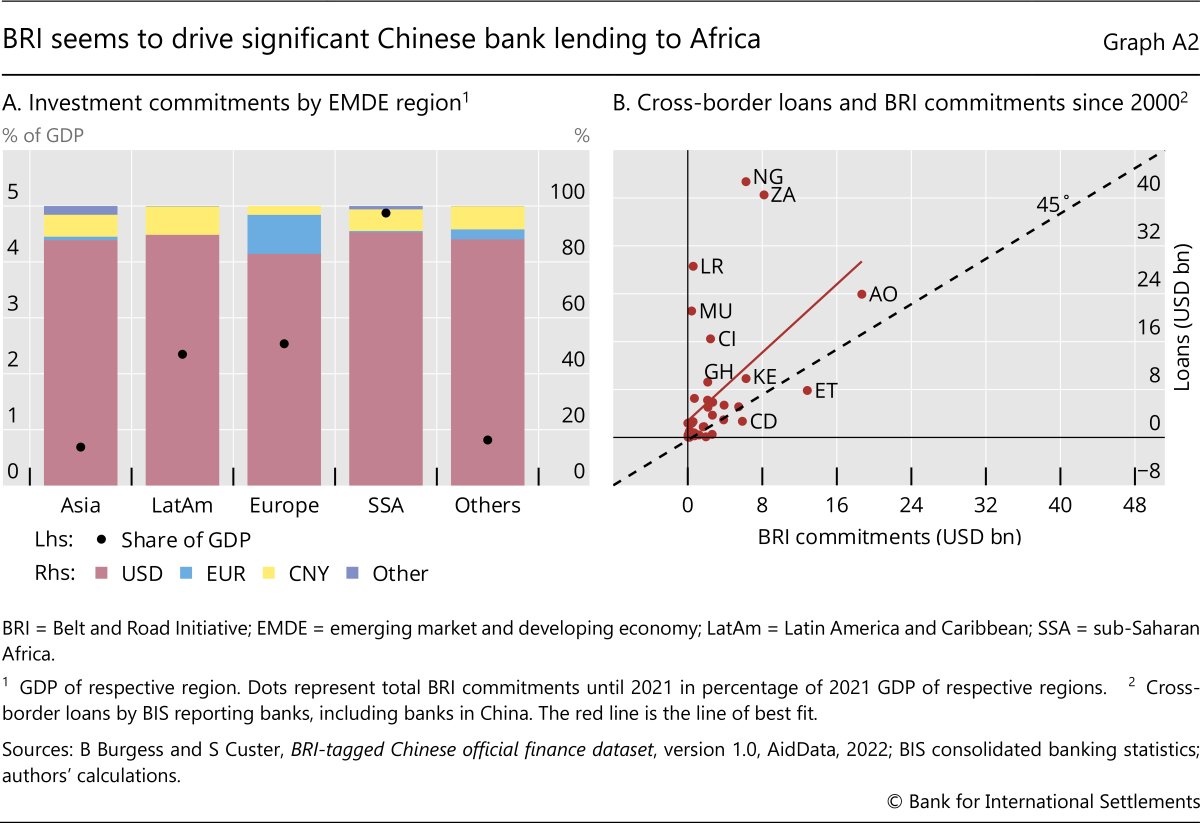
Despite an official strategy to promote the renminbi, 80–90% of BRI lending was denominated in US dollars (Graph A2.A). The use of the US dollar is likely due to advantages such as matching debt denomination with invoiced export revenues in dollars and foreign exchange reserves in dollars.
BRI investment relative to GDP was particularly large in Africa, reaching in total around 5% of GDP, compared with 2.5% in Europe and Latin America (Graph A2.A, dots). Both the comparatively lower GDP of African countries and their large investment needs contributed to this high ratio. Within Africa, the size of these investments varied considerably across countries, reflecting the diverse economic and financial conditions (Graph A2.B, y-axis). Angola ($19 billion) received the most BRI commitments, largely linked to oil infrastructure.
BRI investment increased total international bank lending, but it may have discouraged other lenders. As BRI investments are primarily loans from policy and commercial banks, they are reported in the BIS banking statistics. The cumulative growth in BRI commitments correlate positively with the cumulative growth in cross-border bank lending to borrowers in each country (Graph A2.B, red line). For most countries, the observation falls above the 45-degree line (dotted line), indicating that the total lending growth is larger than BRI commitment growth, which means that banks based in countries other than China have also stepped up lending. This happens in countries with relatively modest BRI commitments, such as Nigeria or South Africa. A few countries fall below the 45-degree line, reflecting potential disinvestment by non-Chinese banks, ie banks from countries other than China decreased their overall lending as BRI progressed. This happens in countries where BRI commitments were relatively large, such as Ethiopia. The reported very restrictive covenants on BRI loans, such as prohibitions from other collective restructuring agreements (eg Paris Club), controls on collateral and callable debts, could discourage other bank lenders.
BRI momentum has slowed since 2020, and now the focus is shifting to repayment of existing debts.


BRI-related lending drove up international credit from China, but it often was given on less favourable terms than other official sector lending.6 While typically extended at below market rates, BRI loans often included restrictive covenants (Gelpern et al (2023)). These covenants may have discouraged investment from other lenders (Kondo et al (2026); Box A). Interestingly, most BRI loans were denominated in US dollars rather than renminbi, limiting the latter’s share in international credit (Box A; Box B).
Following the initial surge in BRI investment, dynamics similar to those during the debt crises in the 1980s began to emerge after 2020. Many African borrower countries faced mounting challenges in servicing their debt due to the fall in commodity prices, rising interest rates, the economic fallout from the Covid-19 pandemic and the food price shock in the wake of the Russian invasion of Ukraine (Horn et al (2025)). At the same time, Chinese banks faced headwinds due to falling real estate prices at home. In response to these growing difficulties, lending from China to Africa slowed significantly after 2020.
Cross-border bank lending to Africa started to expand again in 2025 – this time driven by French, South African and US banks (Graph 4.A). While this expansion helped to diversify the mix of Africa’s creditors, borrowing by many African countries remained concentrated in only a few lending bank nationalities. At end-2025, 24 borrowing countries received more than half of their cross-border loans from banks of a single nationality (Graph 4.B).
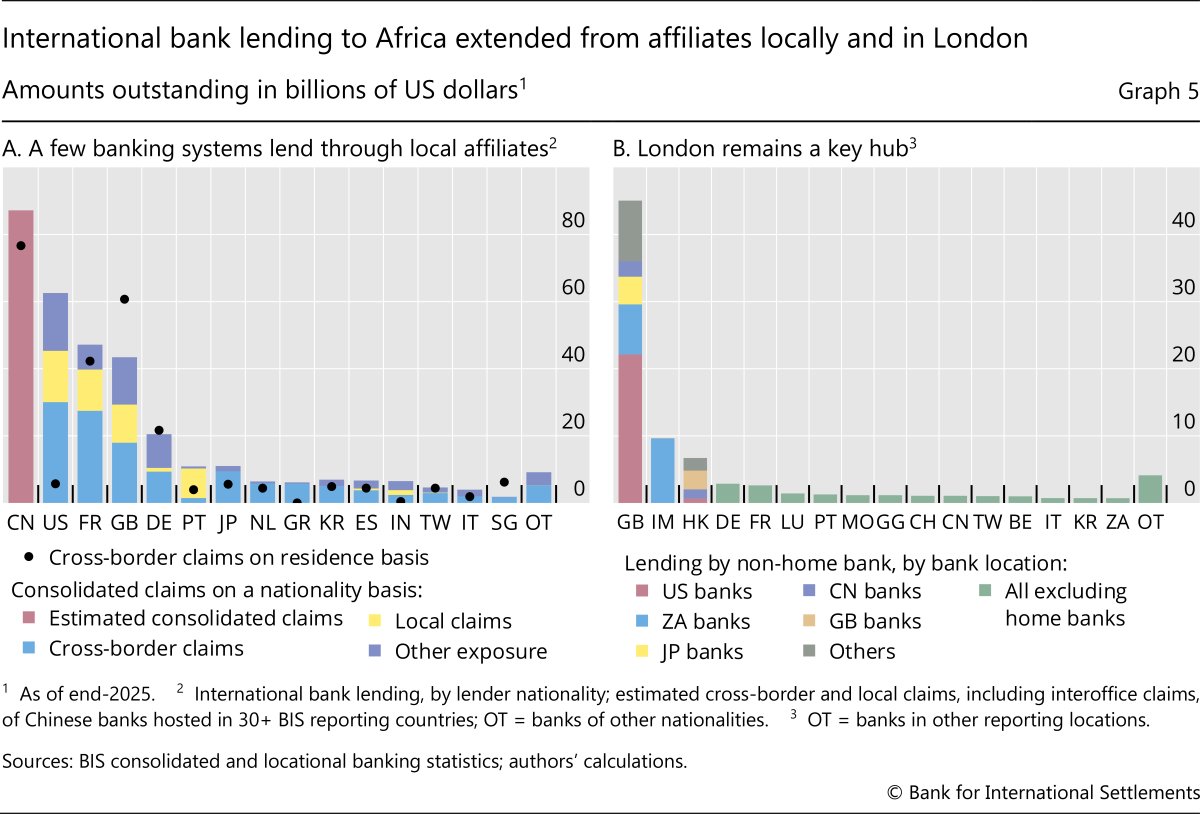
In addition to engaging in cross-border lending, many foreign banks also lend locally from their subsidiaries or branches located in Africa. The BIS consolidated banking statistics capture banks’ consolidated positions across their affiliates worldwide, for both local lending and cross-border lending. These data show that four banking systems stand out with a significant local presence in Africa: United States, France, United Kingdom and Portugal (Graph 5.A, yellow bars). Local lending by Chinese banks remains unquantified, as China does not report data to the consolidated banking statistics. Nevertheless, a conservative estimate shows that Chinese banks continue to be the largest lenders to Africa by a considerable margin (red bar).7 In addition to direct lending, some banking systems also have contingent credit and other off-balance sheet exposures (eg credit lines, guarantees or derivatives – purple bars).
While most banks lend either directly from their home office or via local affiliates, London remains a key hub for routing credit to Africa (cf Hardy et al (2024)). Comparing cross-border bank lending of different lending banking systems (Graph 5.A, blue bars) with the volume of such lending by banks located within each country (dots) provides an indicator of whether banks are lending directly from home or through other affiliates outside Africa. When the dot is close to the bar, as with China and the Netherlands, this suggests most lending is done from the home country. When the dot is lower than the bar, as with the United States and Japan, this suggests that more lending is done by affiliates abroad. The data show that US banks channel more than US $20 billion in credit through London, where many other (non-British) banks also locate affiliates that lend to Africa (Graph 5.B). Interestingly, South African banks also route significant lending back to Africa from affiliates in London as well as the Isle of Man.
Bryan Hardy, Swapan-Kumar Pradhan and Előd Takáts
Sub-Saharan African countries (hereafter “Africa”), like many other emerging market and developing economies, have historically been unable to borrow from abroad in their own currency – the so called “original sin”.
The US dollar was, and continues to be, the dominant currency for African borrowers (Graph B1). Dollar borrowing allows African countries to benefit from the depth of US dollar markets and match debt denomination with dollar-invoiced commodity export revenues. However, dollar usage varies over time, with the euro taking away some of the dollar’s share after its introduction and again during the post-Covid-19 monetary tightening cycle.
Most African countries rely mainly on dollars in their cross-border bank borrowing (Graph B1.A). However, the euro plays an important role in a few economies. Members of the West African Franc zone, such as Côte d’Ivoire, Senegal, Benin and Togo, use euro-denominated cross-border bank borrowing, mainly due to their peg to the euro as well as their historical connections with France and persistent links with French banks. Furthermore, only about 6% of cross-border loans are denominated in renminbi, despite the prominent role of Chinese banks and the Belt and Road Initiative (BRI) in Africa. Indeed, most BRI loans are denominated in dollars (Box A). Renminbi usage was concentrated in only a few borrowing countries, most notably Kenya. This reflects in part loans from Chinese lenders that were originally in US dollars but were later converted to renminbi to cut debt service costs.
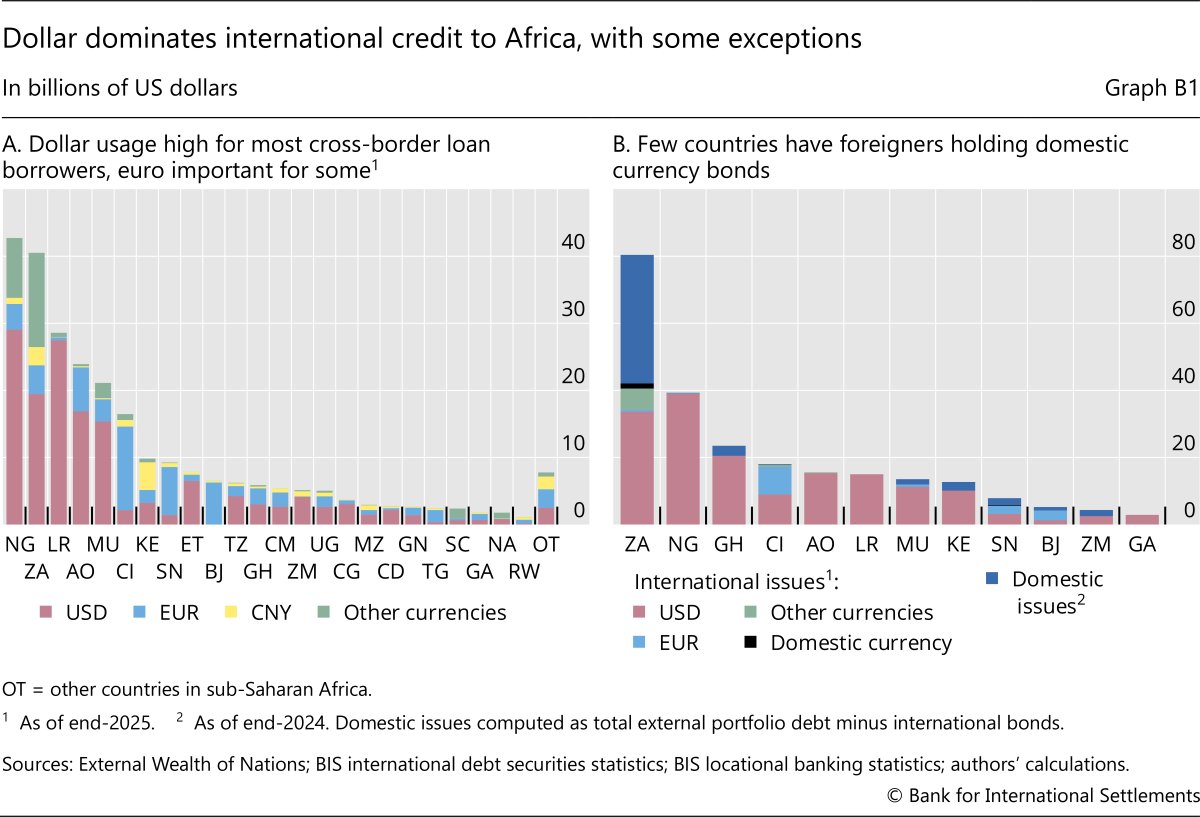
Very few African countries have made headway in local currency borrowing in bond markets, the traditional setting for original sin. Most international bonds issued by African entities are denominated in US dollars (Graph B1.B).
South Africa is the leading exception in overcoming original sin. Borrowers there – mainly the government – can borrow from foreigners in domestic currency to a significant degree. Rand-denominated bonds account for only 4% of South Africa’s outstanding international issues, but foreign investors purchase domestically issued bonds in large quantities (Graph B1.B, dark blue bars). Our calculation suggests that domestically issued bonds (likely in domestic currency) purchased by international investors account for about half of South Africa’s externally held bonds. This number rises to around 80% when focusing on government bonds.
As African economies make progress in overcoming original sin, they face additional trade-offs maintaining fiscal sustainability and financial stability. Moving to domestic currency debt reduces currency risk for the borrower but also shifts currency risk to the investor.

New borrowers and new instruments
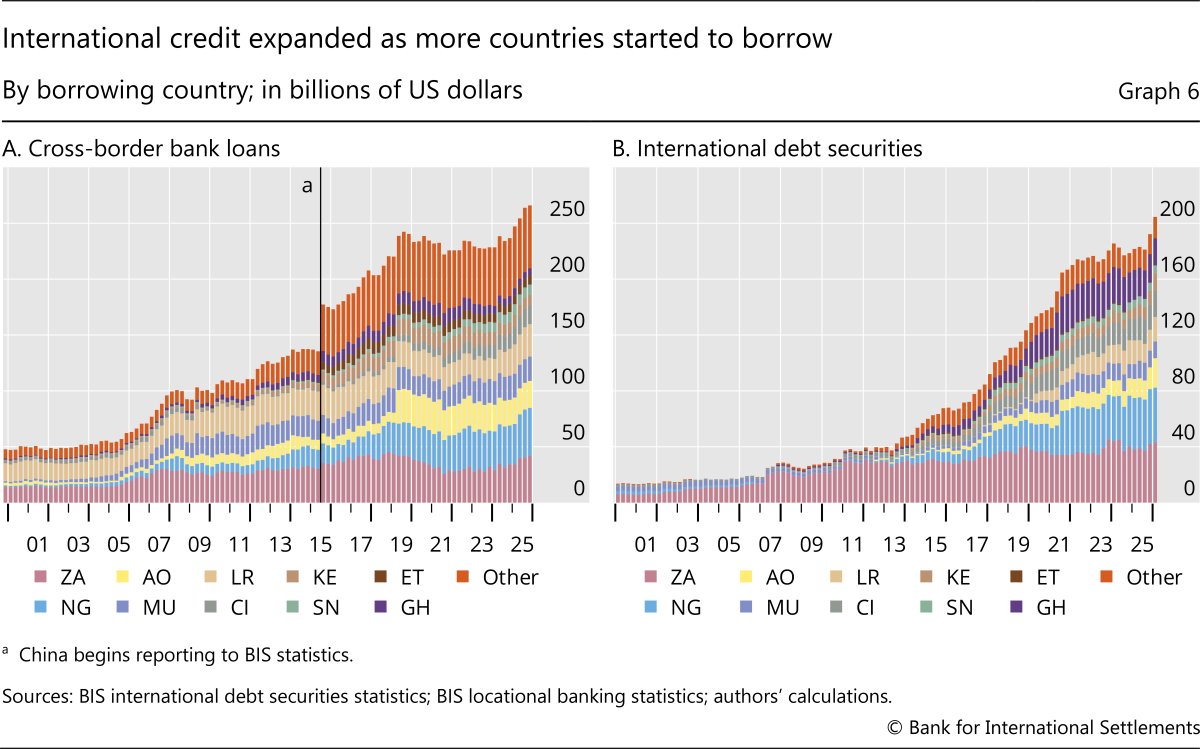
The post-GFC growth in international credit to Africa was driven primarily by new borrowers in both loans and bonds. In cross-border bank lending, Nigeria, Angola and Mauritius joined South Africa and Liberia as larger borrowers (Graph 6.A). Many other smaller countries collectively saw a large increase in loans (orange bars), possibly linked to BRI investments (Box A). In international bond markets, Nigeria, Angola, Ghana, Côte d’Ivoire and others joined South Africa in issuing bonds at scale (Graph 6.B).
Substantial bond borrowing is novel in international credit to Africa. Three developments fostered this broad-based acceleration of bond issuance. First, the post-GFC low interest rate environment prompted search for yield among bond investors, who welcomed an expansion of the set of issuers (Calomiris et al (2022)). Second, borrowers saw improved macroeconomic fundamentals, including from rising commodity prices (Kogan et al (2024)). And third, official debt relief removed debt overhang and provided fiscal space for non-concessional borrowing in international bond markets. The Nigerian government, for instance, was able to successfully issue Eurobonds from 2011 to address fiscal shortfalls and make infrastructure investments following an earlier Paris Club deal. Another case is Côte d’Ivoire, which completed its debt relief programme in 2012 and created fiscal space to access new non-concessional financing for development purposes (IMF (2012)).
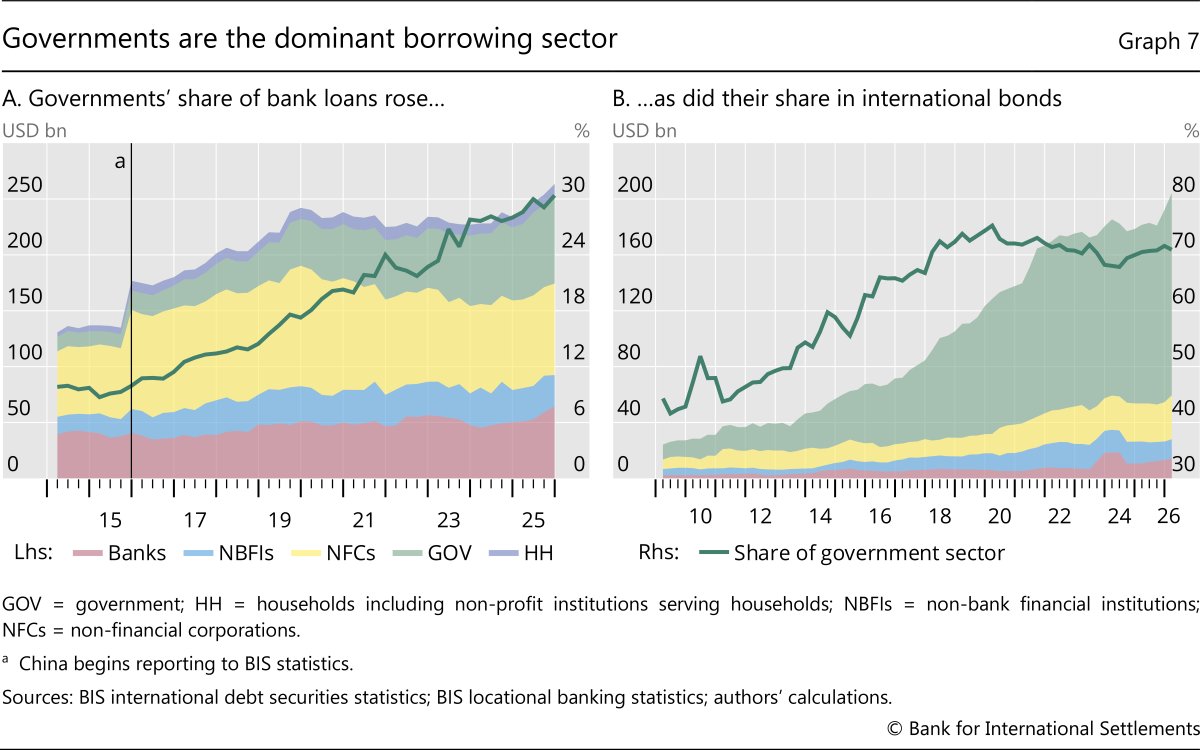
While cross-border bank lending to Africa was oriented towards the private sector historically, governments have increasingly tapped this funding source. The share of loans directly to government borrowers has climbed steadily since 2014, from less than 10% up to 30% in 2025 (Graph 7.A, green area and green line) – on par with non-financial corporations (yellow area). Such loans to governments include some lending from policy banks, such as those in China facilitating BRI loans. Cross-border bank lending, including official flows from policy banks, typically form a key part of government funding for countries with poor access to international bond markets.8 The latest increase in total cross-border loans in 2025 was driven by both governments (green area) and financial sector borrowers (red and blue areas).
Similarly, governments have been the dominant African borrowers in international bonds as well. They account for around two thirds of all outstanding international debt securities issued by entities in Africa (Graph 7.B). From 2010 to 2025, international debt securities expanded by roughly $163 billion, with government debt accounting for $124 billion of the increase. Indeed, the share of debt securities issued by governments rose as international bond issuance grew. Most African governments borrow internationally in foreign currencies, particularly in US dollars. However, some, notably South Africa, can attract international investors to buy local currency bonds issued in domestic markets (Box B).
Conclusion
The rapid expansion of international credit to Africa provides much needed financing. However, increased debt burdens and challenging headwinds in global markets could impair the sustainability of this debt. High concentration in bank lenders poses further risks, as a contraction in credit from one creditor (eg China or France) can significantly affect total financing for many borrowers. The advent of international bonds broadens the investor base to market investors, offsetting this concentration, but these investors can be flighty when global financing conditions turn (Ehlers et al (2025)).
The importance of prudent policies to support debt sustainability in Africa matters beyond what the headline financing figures might suggest. Africa is home to an increasingly large share of the global population, and international credit plays a key role in how this population will prosper. A deeper understanding of international credit will help policymakers navigate the path ahead.
1 The views expressed in this publication are those of the authors and not necessarily those of the BIS or its member central banks. We thank Iñaki Aldasoro, Stefan Avdjiev, Rashad Cassim, Gong Cheng, Michael Chui, Torsten Ehlers, Leonardo Gambacorta, Gaston Gelos, Patrick McGuire, Benoit Mojon, Nwabisa Ndzama, Daniel Rees, Andreas Schrimpf, Frank Smets, Goetz von Peter and Philip Wooldridge for helpful comments.
2 “Africa” in this article comprises the following 45 countries: Angola, Benin, Botswana, Burkina Faso, Burundi, Cameroon, Cabo Verde, the Central African Republic, Chad, Comoros Islands, Côte d’Ivoire, the Democratic Republic of the Congo, Equatorial Guinea, Eritrea, Eswatini, Ethiopia, Gabon, Gambia, Ghana, Guinea, Guinea-Bissau, Kenya, Lesotho, Liberia, Madagascar, Malawi, Mali, Mauritius, Mozambique, Namibia, Niger, Nigeria, the Republic of the Congo, Rwanda, São Tomé and Príncipe, Senegal, Seychelles, Sierra Leone, South Africa, South Sudan, Tanzania, Togo, Uganda, Zambia and Zimbabwe.
3 The significantly higher oil prices increased oil-exporting countries’ revenues beyond what their domestic economy could absorb. Hence, these petrodollars were deposited in international banks, which would lend them to less developed countries with higher expected returns on investment, such as those in Latin America and Africa (Wiegand (2008)).
4 Most cross-border loans in the data are reported from banks located outside Africa. South Africa is currently the only country in Africa that reports data to the BIS banking statistics. For some analysis of cross-border investment of African banking groups within Africa, see Mathieu et al (2019).
5 Available evidence indicates a steady expansion of Chinese lending to Africa since the early 2000s. However, the BIS international banking statistics include data for China only starting from end-2015. The observed increase in reported loans in the fourth quarter of 2019 primarily reflects expanded coverage of Chinese banks.
6 Fast-growing BRI lending propelled China to become the largest official creditor globally by 2017, surpassing traditional official creditors such as the IMF and the World Bank (Horn et al (2021)).
7 We proxy claims by Chinese banks’ local affiliates in Africa with the amount of intragroup funding sent by Chinese banks to their affiliates in the region. This assumes all intragroup funding is on-lent to local borrowers in Africa. Local positions of Chinese bank affiliates could be much larger, supported by other cross-border and local funding sources. Hence, this estimate is a lower bound for Chinese bank lending.
8 Countries with impaired credit histories face difficulties in accessing bond markets. When a government issues new bonds during a restructuring, those new bonds often share an equal legal ranking (pari passu) with existing debt. While this ensures all unsecured creditors have equal rights to repayment, the same ranking with defaulted bonds deters new investors. At the same time, countries with impaired credit histories may still be able to borrow from banks by providing collateral, as the collateral can be used independently of past defaults (Arellano et al (2023); Schumacher et al (2021)).
Alter, A, K Khandelwal, T Lemaire, H Mighri, C Sever and L Tucker (2025): “Navigating the evolving landscape of external financing in sub-Saharan Africa”, IMF Working Papers, no 2025/139, https://doi.org/10.5089/9798229016100.001.
Arellano, C, X Mateos-Planas and J-V Ríos-Rull (2023): “Partial default”, Journal of Political Economy, vol 131, no 6.
Beck, T, S M Maimbo, I Faye and T Triki (2011): “Financing Africa – through the crisis and beyond”, World Bank
Bhattacharya, A, P Montiel and S Sharma (1997): “Private capital flows to sub-Saharan Africa: an overview of trends and determinants”, in Z Iqbal and S M Ravi Kanbur (eds), External finance for low-income countries, International Monetary Fund.
Calomiris, C, M Larrain, S Schmukler and T Williams (2022) “Large international corporate bonds: investor behavior and firm responses”, Journal of International Economics, vol 137, 103624.
Ehlers, T, B Hardy and P McGuire (2025): “International finance through the lens of BIS statistics: the international dimensions of credit”, BIS Quarterly Review, March.
Fliss, L, R Xu and U Teksoz (2024): Unpacking Africa’s debt: towards a lasting and durable solution, United Nations Office of the Special Adviser on Africa.
Gelpern, A, S Horn, S Morris, B Parks and C Trebesch (2023): “How China lends: a rare look into 100 debt contracts with foreign governments”, Economic Policy, vol 38, no 114.
Graf von Luckner, C and S Horn (2026): “Beyond market exclusion: creditor attrition after sovereign default”, mimeo.
Hardy, B, P McGuire and G von Peter (2024): “International finance through the lens of BIS statistics: the geography of banks’ operations”, BIS Quarterly Review, December.
Horn, S, C Reinhart and C Trebesch (2021): “China’s overseas lending”, Journal of International Economics, vol 133, 103539.
——— (2025): “China’s lending to developing countries: from boom to bust”, Journal of Economic Perspectives, vol 39, no 4.
International Monetary Fund (IMF) (2012): “Côte d’Ivoire: enhanced heavily indebted poor countries initiative: completion point document and multilateral debt relief initiative; press release”, July, www.imf.org/external/pubs/ft/scr/2012/cr12170.pdf.
Kogan, J, R Kazandjian, S Luo, M Mbohou Mama and H Miao (2024): “The role of IMF arrangements in restoring access to international capital markets”, IMF Working Papers, no 2024/173.
Kondo, I, C Sosa-Padilla and Z Swaziek (2026): “Borrowing in the shadow of China”, mimeo.
Manger, M S, D Mihalyi, U Panizza, N Rescia, C Trebesch and K L Wong (2023): “Africa’s domestic debt boom: evidence from the African debt database”, Kiel Working Papers, no 2303.
Mathieu, P, M Pani, S Chen and R Maino (2019): “Drivers of cross-border banking in sub-Saharan Africa”, IMF Working Papers, no 2019/146.
McGuire, P (2004): “A shift in London’s eurodollar market”, BIS Quarterly Review, September.
Schumacher, J, C Trebesch and H Enderlein (2021): “Sovereign defaults in court”, Journal of International Economics, vol 131, 103388.
Wiegand, J (2008): “Bank recycling of petro dollars to emerging market economies”, IMF Working Papers, no 2008/180.