Bank executive compensation and risk-taking

This article investigates the evolution of bank compensation practices since the Great Financial Crisis (GFC) and how it relates to bank risk. Despite the lessons learned from the GFC, performance metrics for bank executives generally do not account for risk. EU regulation requiring banks to extend their deferral horizons has reduced risk-taking. By contrast, our evidence is not conclusive regarding restrictions on the share of variable compensation. A case study of the 2023 banking turmoil indicates that bank governance failed to ensure that compensation schemes accounted for risk-taking, to recognise the deterioration of performance and to adjust compensation accordingly.
JEL classification: G21, G28, J331
Bank regulation has long sought to constrain excessive risk-taking by addressing the misalignment of incentives created by limited liability, deposit insurance and implicit too-big-to-fail guarantees. The cornerstones of this effort have been capital regulation, which requires banks to hold loss-absorbing equity so that shareholders retain meaningful “skin in the game”, and liquidity regulation, which mandates that banks hold adequate liquid assets to safely carry out maturity transformation.
The Great Financial Crisis (GFC) highlighted the need to complement traditional prudential requirements with reforms in the area of compensation to ensure prudent risk behaviour. In 2009, the Financial Stability Board (FSB) adopted principles and standards for sound compensation (FSB (2009a, 2009b)). These specify that banks should align compensation policy with long-term, risk-adjusted performance. Measures include mandatory deferrals of compensation, malus and clawbacks.2
Following this, the issue received less attention. While the FSB monitored implementation progress, it has not systematically assessed the impact of compensation regulation on bank risk. And the wave of research investigating this topic after the GFC subsided over time. The 2023 banking turmoil brought the issue back to the fore. Weak compensation practices were widely regarded as significant contributors to the failures of both Silicon Valley Bank and Credit Suisse (FSB (2024)). Switzerland is now planning a stricter regulation of compensation. In the United States, a proposal to revise compensation guidelines was also launched after the 2023 turmoil but is now on hold. The United Kingdom, for its part, has softened its compensation guidelines, citing concerns over preserving international competitiveness.
- Global standards for bank executive compensation, developed to curb excessive risk-taking, have been implemented differently across jurisdictions. Accordingly, compensation practices have not converged.
- There is little evidence that banks use risk-adjusted performance targets in determining manager compensation. Return on equity, a measure rewarding leverage risk, continues to play a large role.
- Empirical evidence supports the use of deferrals – where part of compensation is withheld and paid out later – to reduce bank risk. By contrast, the evidence on bonus caps is not conclusive.
Our article examines how compensation practices and their regulation have evolved following the GFC, and how bank executive compensation relates to bank risk. In particular, we ask the following questions: To what extent have banks across jurisdictions shifted towards longer-term deferred compensation and has this led to a reduction in risk? What performance metrics do banks target in their compensation schemes, and to what extent are they risk-adjusted? What specific weaknesses in compensation schemes has the recent banking turmoil exposed?
The main insights from our analysis are as follows.
First, banks’ compensation practices diverge across jurisdictions, reflecting differences in the adoption of FSB standards. While the United States adopted principles-based guidelines, the European Union implemented a bonus cap, limiting the ratio of variable pay to fixed compensation, and deferral requirements, mandating that a portion of variable pay be delayed over a minimum period. Accordingly, EU banks have a lower variable-to-fixed compensation ratio and longer deferral horizons than US banks.
Second, we find little evidence that banks adjust their performance metrics to reflect the risk taken on. Accounting profits and stock market performance clearly dominate in the calculation of compensation, and these metrics rarely account for the cost of equity, which reflects the compensation required by shareholders for the risk they incur. Return on equity (ROE), which rewards leverage risk, continues to play a strong role.
Third, we find that longer deferrals come along with lower bank risk. In line with broader literature, we do not find conclusive evidence on the effects of variable compensation on bank risk.
Finally, our case study (see Box A in the Annex) indicates that banks that failed during the 2023 turmoil were not outliers in terms of deferrals. Rather, bank governance failed to ensure that compensation schemes reflected risk-taking and recognise the deterioration of performance in a timely manner. This highlights the role of governing boards and supervisors in overseeing both the design and the operation of compensation schemes.
Compensation regulation: rationale and post-GFC reforms
Key elements of banks’ compensation schemes
Executive compensation typically combines a fixed component with a variable component (cash, equity or options). The payment of variable compensation is subject to a multi-stage process. The bank first sets a firm-wide bonus pool. The pool is then allocated across divisions, and staff members receive a grant reflecting their contribution to performance. Part of the grant is paid out immediately. The remainder is deferred, with its payout subject to a vesting process over a predefined horizon.
Vesting is the process by which a manager acquires legal ownership of the grant. It can be time-based, depending on continued employment over a predefined period, or performance-based, depending on whether predefined targets are met. Under performance-based vesting, the same initial grant of shares (or cash amount) can yield a different final number of vested shares (or cash amount), depending on outcomes such as profits or stock market performance.
Graph 1.A. illustrates a performance-based vesting scheme tied to ROE. The manager is granted 100 shares corresponding to a target return of 10%. Vesting will be 100 shares when the manager meets the target. Below a 5% return, the grant is forfeited entirely; between 5% and 15% the number of vested shares rises linearly, up to a cap of 150. Banks usually combine accounting- and market-based metrics and weight them to determine overall performance.
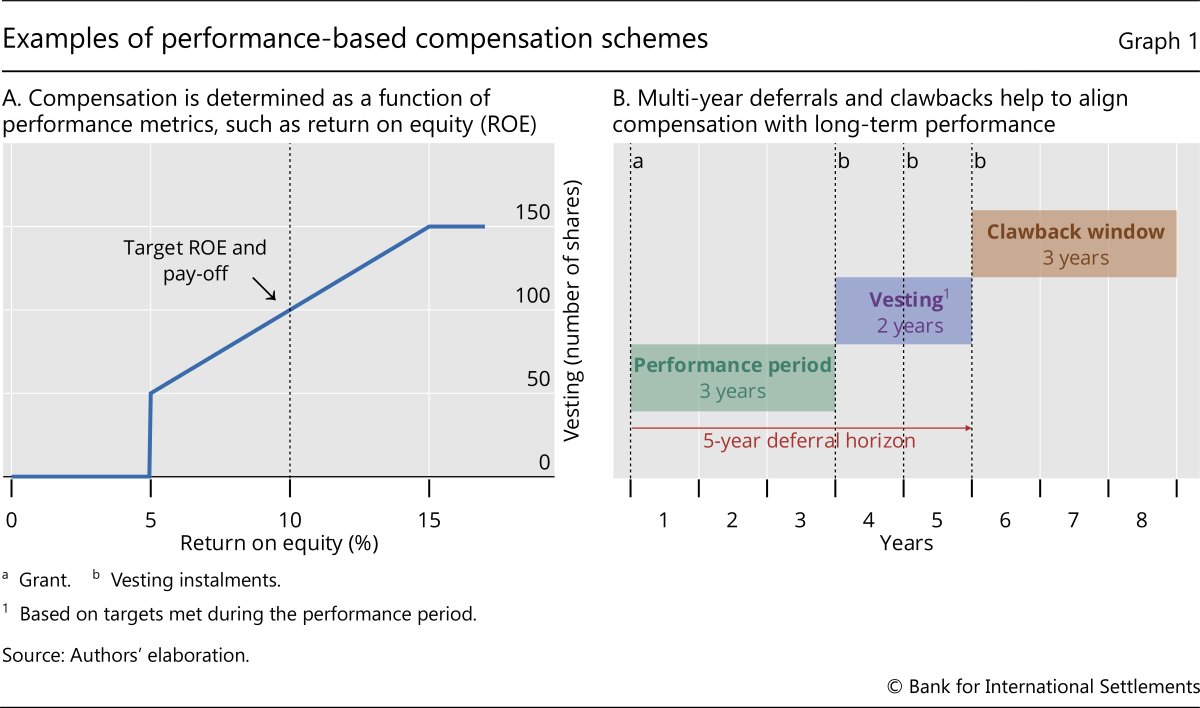
Banks can structure deferrals in several ways to align pay with long-term performance. In a five-year deferral, variable compensation can for example be paid out in five annual tranches depending on how ROE evolves in each year. Another approach would be to average ROE, say, over the first three years (Graph 1.B.). Compensation would then vest in three instalments at the end of years three, four and five, based primarily on this average performance. In years four and five, a malus would apply. For example, if the capital ratio falls below some critical level in year five, vesting could be zero for that year.
Further reading
• How post-crisis regulation has affected bank CEO compensation
• Bank boards - a review of post-crisis regulatory approaches
• The 2023 banking turmoil and liquidity risk: a progress report
Clawback clauses offer an additional layer of discipline. They allow the bank to require managers to return all or part of variable compensation after legal ownership has been transferred. They apply only in exceptional circumstances such as severe misconduct or fraud.
Rationale for regulating compensation
Economic theory provides a rationale for regulating bank compensation but also warns about some pitfalls.
While the traditional literature on executive compensation has focused on aligning managers’ incentives with those of shareholders, from a societal perspective, the key issues in bank executive compensation lie elsewhere. Fundamentally, bank shareholder interests are likely to differ from those of society since the presence of deposit insurance and state guarantees tend to provide incentive for excessive risk-taking.
Moreover, banks operate with high leverage, and deposits – which represent the core of their liabilities – are spread across a large number of holders with limited incentives to monitor banks’ management. Banks are inherently opaque because their loan portfolios tend to be illiquid and information-intensive. These characteristics make it more difficult to contain the so-called risk-shifting problem – the incentive for shareholders to take on excessive risk due to limited liability (Jensen and Meckling (1976)).
In such a configuration, compensation regulation can play a counterbalancing role and prevent banks from designing pay schemes that incentivise managers to take risks at society’s expense (John et al (2000); IMF (2014)). Theory generally supports mandatory deferrals. By making bonuses contingent on later performance, they can discourage risk-taking by exposing managers to the long-term consequences of their actions (Hoffmann et al (2022)). But the choice of the horizon is not straightforward (Jarque and Prescott (2010); Hoffmann et al (2022)). When too short, the horizon will fail to capture the materialisation of risk. When too long, it may discourage effort, by making payoffs more distant and uncertain. When effort is related to risk management, an excessively long deferral can even backfire in terms of risk (Hoffmann et al (2022)).
With regard to the bonus cap, theory is split. From a static perspective, a cap can mitigate risk-taking incentives to shift risk onto the taxpayer (IMF (2014); Hakenes and Schnabel (2014)). However, if banks increase fixed pay to compete with sectors or jurisdictions not subject to this requirement, the bonus cap can backfire: projects with a high probability of failure can become attractive. The reason is that the higher fixed pay offers the manager better insurance against failure, while the bonus, even if capped, still offers some reward in case of success (IMF (2014)). Moreover, fixed compensation creates cost rigidities and reduces banks’ ability to absorb losses (Asai (2016); Efing et al (2023)).
One stream of the literature recommends linking compensation to risk metrics such as risk premia on banks’ debt (Bolton et al (2015); Thanassoulis and Tanaka (2018)). It warns that performance-based vesting, if linked solely to profitability or stock performance, can increase risk incentives. Even a longer deferral cannot fully address this problem, as it does not, per se, prevent shareholders from shifting losses onto the rest of society. Shareholders could still respond by making managers’ compensation rise very rapidly with bank value in case of success, to compensate the manager for the downside implied by the deferral (Thanassoulis and Tanaka (2018)).
FSB principles and standards
As part of its response to the malpractices laid bare by the GFC, the FSB set out the principle that significant financial institutions should risk adjust compensation to: (i) reflect risks incurred by employees before these risks materialise;3 and (ii) be sensitive to realised risk outcomes, ensuring that employees bear the consequences of their decisions (FSB (2009a, 2009b)).
The FSB defined the following standards for pay structures:
- A substantial proportion of compensation should be variable and linked to performance measures that adequately account for risk. The standards do not set a cap on the ratio between variable and fixed compensation.
- Variable compensation should primarily consist of deferred payments tied to multi-year performance. The FSB recommended that, for senior management, a substantial portion – such as 40–60% – of variable compensation be deferred over at least three years.
- Already paid-out variable compensation should be subject to clawbacks (FSB (2018)), especially in cases of misconduct or major risk management failures.
While the standards include some quantitative parameters, the FSB did not regard their transposition into national regulation as a prerequisite for compliance. It emphasised instead the role of supervisors in promoting adherence.
Finally, the FSB lays out standards for the effective governance of compensation. The governing board must oversee both the design and operation of the compensation scheme. Larger banks should have an independent board compensation committee to monitor compensation on behalf of the board. The Basel Committee on Banking Supervision has incorporated the FSB standards in corporate governance principles for banks (BCBS (2015)).
Implementation of the standards
National jurisdictions implemented the FSB standards in markedly different ways.
Some jurisdictions, such as the United States, Canada and Japan, adopted a principles-based approach without prescribing binding quantitative parameters.4 After the 2023 turmoil, US supervisory agencies issued a consultation on revised guidelines that would have introduced quantitative deferral requirements (see Box A in Annex). However, only four of the six agencies whose approval would be required joined the proposal, and the Federal Deposit Insurance Corporation withdrew its initial support in 2025.
The European Union introduced quantitative requirements for compensation structures, particularly through the 2014 Capital Requirements Directive (CRD IV).5 For top executives, significant banks should defer at least 60% of variable compensation over a five-year horizon. The EU also went beyond FSB standards by adding a bonus cap, limiting variable compensation to 200% of fixed compensation. As an EU member at the time, the United Kingdom initially applied the cap but abandoned it in 2023 after Brexit. In 2025, it reduced the minimum horizon of deferred compensation to four years.
Other jurisdictions adopted a hybrid approach. Switzerland, for instance, mandates that a significant proportion of variable compensation be deferred for at least three years, with banks allowed to use a “comply or explain” clause. This regulation is under review following the Credit Suisse crisis (see Box A in the Annex).
Finally, with regard to performance metrics, most jurisdictions set the principle that they should be risk-adjusted, mainly by accounting for the cost of capital needed to cover the risk of the bank’s activities. However, regulation stops short of prescribing specific approaches or metrics.
Changes in bank compensation practices following the GFC
The evolution of banks’ compensation practices since the GFC is largely in line with the regulatory stance adopted in the various jurisdictions (see Graph 2).
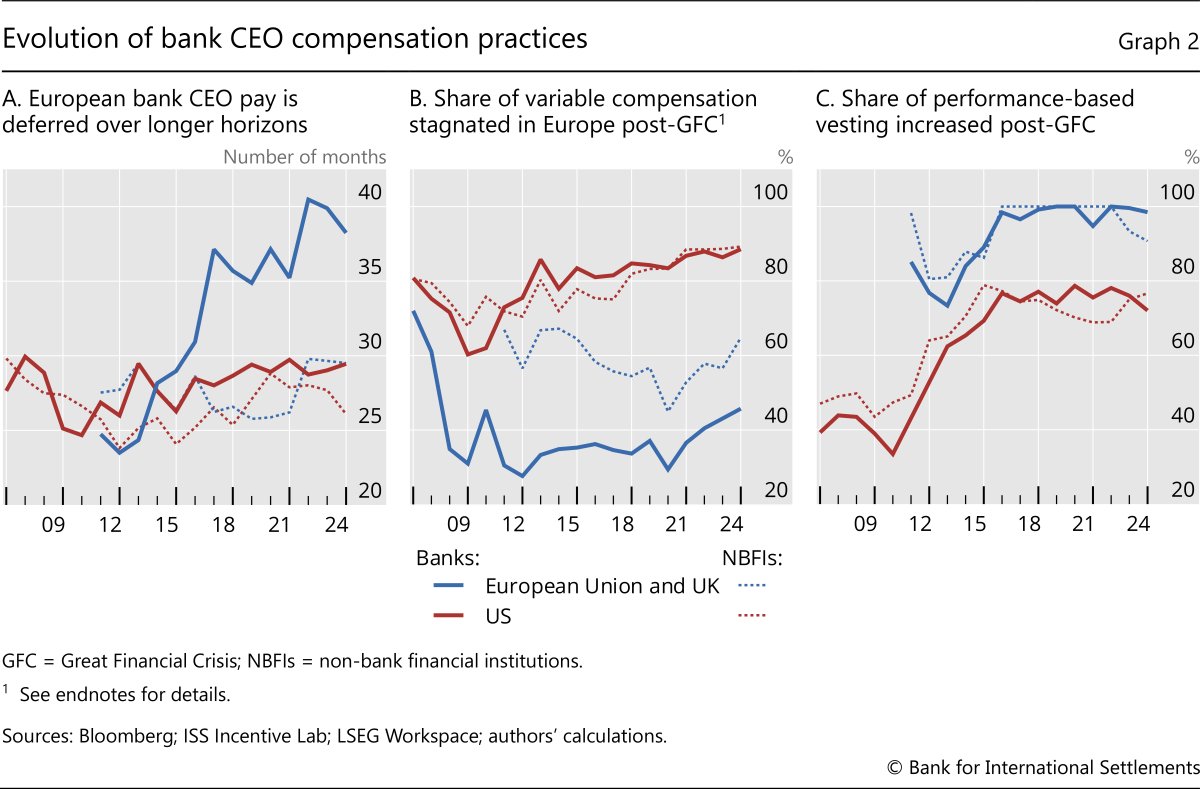
First, after the EU adoption of deferral rules, the average horizon of variable pay at EU banks rose by about 12 months and is now higher than that at US banks.
Second, following a strong decline in both regions during the GFC, the share of variable compensation remained low at EU banks, consistent with the imposition of the bonus cap. It has, however, risen somewhat in recent years. At US banks, the share of variable compensation returned to pre-crisis levels.
Third, the share of performance-based vesting has increased significantly, reflecting a corresponding decline in the share of time-based vesting, in line with the regulatory expectation that compensation should reflect performance. The shift is stronger at US banks, because performance-based vesting was less frequent in the United States before the GFC.
Greater reliance on performance-based vesting has made performance metrics key for managers’ incentives, but there is little evidence of adjusting them for risk in line with the FSB principles. ROE remains the target with the highest weighting (Table 1). This metric can be artificially inflated by leverage, especially if deposit insurance and implicit state support reduce the cost of bank debt (Pennacchi and Santos (2021)). By contrast, the weight for risk-adjusted metrics such as economic value added (EVA) is low and declining.6 Total shareholder return (TSR) dominates stock-related performance, while metrics adjusting for the volatility of the stock return – akin to the Sharpe ratio – are rare. The weight assigned to capital management and environmental, social and governance (ESG) has grown over time, but the weight of risk metrics (eg non-performing loans ratio, cost of risk, compliance measurement) remains very low.7 Comparing regions, US banks tend to weight ROE more than European banks, and they put less emphasis on ESG and capital.
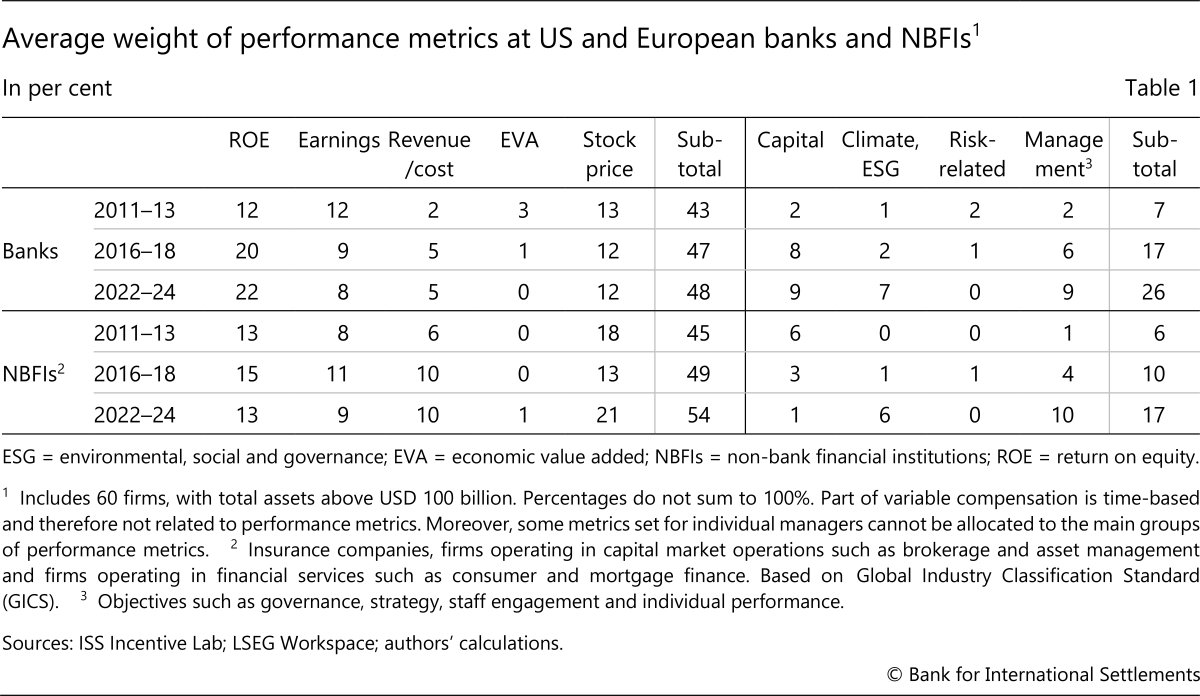
Banks place a higher weight on ROE than do NBFIs, even insurers or capital market firms.8 Thus, banks’ reliance on ROE is unlikely to result from competitive pressure from NBFIs’ remuneration policies.
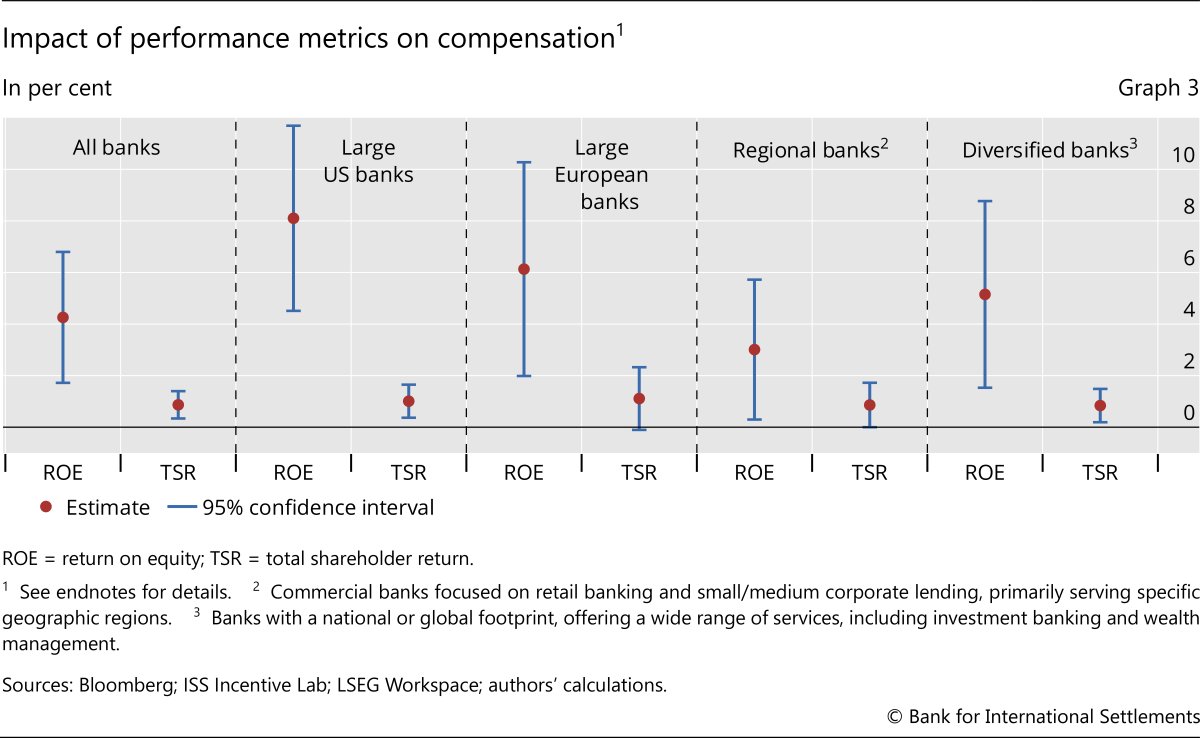
Regression analysis confirms banks’ stronger reliance on ROE than on TSR in determining variable compensation (Graph 3). We regress paid compensation on granted compensation, ROE and TSR for US and European banks. A 1 percentage point increase in ROE is associated with a 4% rise in paid compensation, while a 1% increase in TSR corresponds to a mere 1% rise in pay.9 When capital or risk metrics are included, their coefficient is generally not significant, in line with their low weighting as performance metrics. The stronger reliance on ROE compared with TSR tends to be more pronounced in larger banks, US banks and banks with a diversified business model.
How does compensation design affect bank risk?
Background and empirical strategy
Our empirical analysis on the relationship between compensation design and risk exploits differences in regulatory responses across jurisdictions. We test whether: (i) a higher proportion of variable compensation is associated with more risk; and (ii) longer deferrals are associated with less risk.
We focus on CEO compensation, for which the Institutional Shareholder Services (ISS) Incentive Lab provides an extensive database on compensation design. The sample comprises 73 US and European (EU and non-EU) banks, which together offer a sharp contrast in regulatory treatment as well as comprehensive data on the design of CEO compensation.
We consider market-based, rating-based and accounting-based risk metrics. Specifically, we measure risk using the expected loss of market value of the bank during a systemic crisis (long-run marginal expected shortfall, or LRMES), the translation of this loss in capital shortfall (systemic risk, or SRISK), Moody’s one-year expected default frequency (EDF), Fitch ratings and an accounting-based distance to insolvency referred as the z-score (see endnotes for the definitions). We complement this set of risk metrics with indicators measuring banks’ capital adequacy management: the risk-weighted capital ratio, leverage and, in the case of global systemically important banks (G-SIBs), the capital buffer held above the regulatory requirement.
We use two regression approaches. The first examines the relationship between compensation design and bank risk since the GFC. The second examines changes in compensation practice and in bank risk during episodes of regulatory change. This latter approach comes closer to a causal analysis.
Relationship between compensation design and bank risk
We first investigate the relationship between changes in compensation design and bank risk since the GFC. Bank risk is regressed on the deferral horizon applicable to the CEO, the share of variable compensation and variables controlling for banks’ characteristics. We estimate the following equation:

where Xi,t includes control variables (total assets, dummy variables for the GFC period (2008–10), deposits over short-term liabilities), αi is bank fixed effects, and λt is year fixed effects. The two-year lag for compensation variables assumes that changes in the compensation design take some time to affect risk measures.10 Standard errors are clustered at the bank level.
Compared with the differences-in-differences setup of the next section, this approach allows us to consider longer time windows, which are not restricted to episodes of regulatory change. However, the approach is susceptible to reverse causality: for instance, more prudent banks might naturally adopt compensation schemes that discipline management. Introducing a lag might help reduce endogeneity.
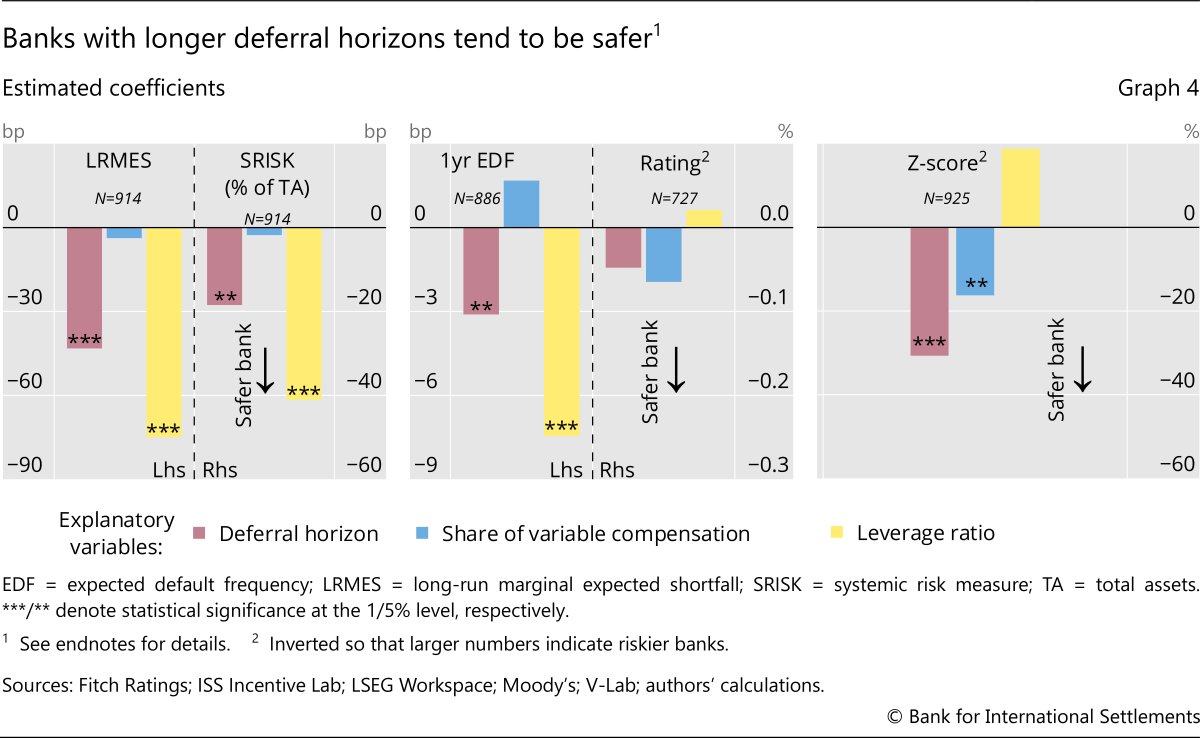
The results indicate that longer deferrals are associated with lower risk for four out of five risk measures (red bars in Graph 4). By contrast, the share of variable compensation is not significantly correlated with risk (blue bars), except for the z- score, where the correlation is negative – in contrast to what would be expected.
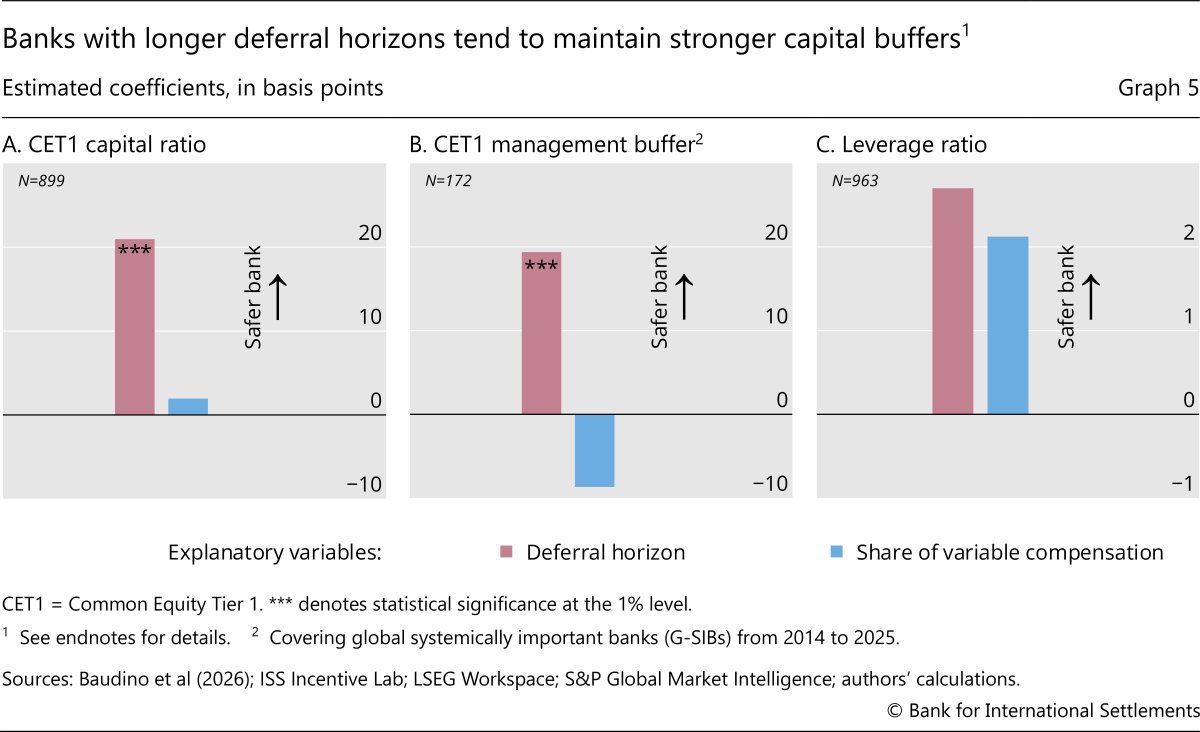
As mentioned above, banks’ risk behaviour may also be observed in their choice of capital buffers or leverage. Accordingly, we regress banks’ management capital buffers, their capital ratios and their leverage ratios on the two variables reflecting compensation design, this time without controlling for leverage. We find that longer deferrals go hand in hand with a higher Common Equity Tier 1 (CET1) capital ratio and with a larger capital management buffer (Graph 5). By contrast, we find no significant effect for the leverage ratio. Finally, we find no significant results for the share of variable compensation as an explanatory variable.
Overall, the correlation analysis shows that longer deferrals are associated with lower risk and more prudent capital management. By contrast, evidence of a possible link between the share of variable compensation and risk is weak.
Impact of episodes of regulatory change
Our second approach uses a differences-in-differences setup and focuses on two regulatory episodes: (i) the EU’s introduction of a bonus cap and a mandatory five-year deferral in 2014; and (ii) the removal of the bonus cap for UK banks in 2023.
For the first episode, we investigate whether those EU banks with a larger gap between their practices and the new regulation were also the ones that reduced their risk more after the regulation came into force. The approach capitalises on the fact that EU banks entered that regulatory episode with different compensation practices and that non-EU banks (ie US banks and other European banks) were not subject to the same rules.
The regression analysis compares, for each bank, the evolution of its risk between the periods 2012–13 and 2014–16 and its distance from the new compensation regulation measured as of 2013. For example, if a bank had four-year deferrals, its distance was one year. For the deferral horizon, we estimate the following equation:
Riski,t = β + δ × 1 {i ∈ EU} × 1{t ≥ 2014} ×|5 years -DeferralHorizoni,2013|++αi + λc,t +εi,t,11 (2)
where αi is the bank fixed effect and λc,t is the country-by-year fixed effect.
This approach is better suited for identifying causal effects of compensation regulation, because it exploits the differential impact of the new rules on the risk behaviour of banks with varying levels of compliance.12 The approach requires that the “treated group” (subject to regulation) and the “non-treated group” be clearly distinct.13 Moreover, the treated and non-treated groups must evolve in parallel in the absence of treatment (the so-called parallel trend assumption).
Overall, we find that EU banks needing to increase deferrals more to comply with regulation reduced risk significantly more (Graph 6). Focusing on the risk measures for which the parallel trend assumption is not rejected, we note that longer deferrals lead to a reduction in the systemic risk metric (SRISK) and to an improvement in ratings – which reflect the systemic and idiosyncratic risk, respectively. An increase of one year in the deferral horizon is associated with a reduction in SRISK representing about 15% of its year-to-year variability. For the share of variable compensation, by contrast, we find no impact on risk. A separate regression targeting EU banks – which allows us to concentrate on a more homogeneous sample – delivers similar results for both deferrals and the share of variable compensation.
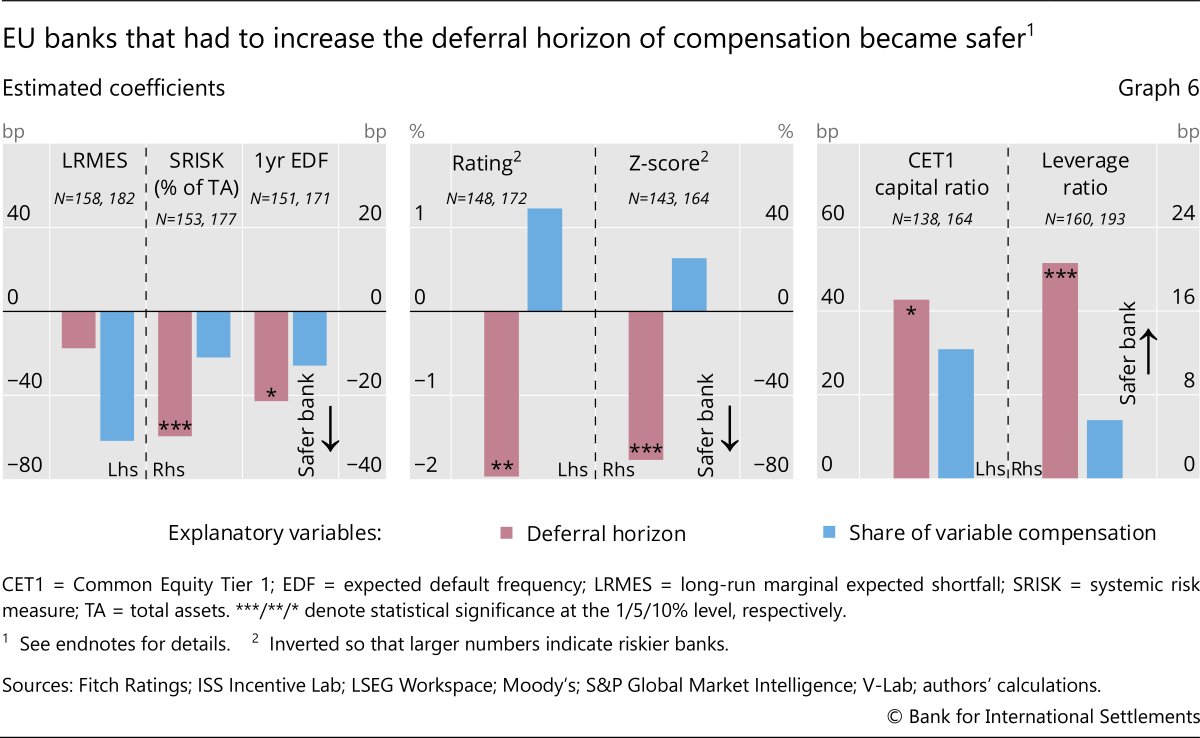
We also find that an increase in deferrals leads to a significant increase in the CET1 capital ratio and in the leverage ratio, implying more prudent capital management. We find the bonus cap has no significant effects.
As our second causal test, we examine the effects of the removal of the bonus cap in the United Kingdom in 2023. We specifically examine whether UK banks that increased variable pay beyond the former regulatory limit of two thirds of total compensation (the equivalent to the 200% cap14) experienced an increase in risk during the period 2024–25 compared with 2022–23. Here, we exploit the fact that their EU peers are still subject to the bonus cap. We estimate the following equation:

where αi is the bank fixed effect and λt is the year fixed effect. Standard errors are clustered at the bank level.
Focusing on risk metrics for which the parallel trend assumption is not rejected, LRMES and SRISK, we find a significant rise in risk at UK banks that increased variable compensation (Graph 7). By contrast, when looking at capital management metrics, we find no impact for the leverage ratio or the CET1 ratio.
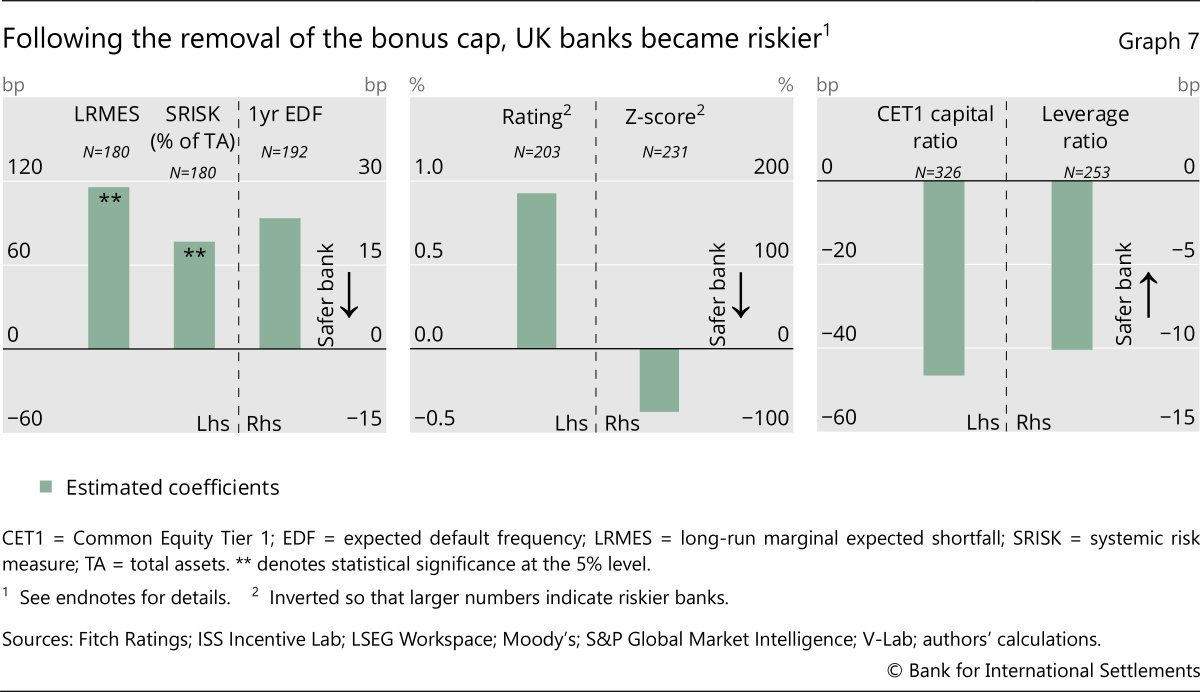
Overall, our regulatory impact analysis suggests that longer deferral requirements mandated by EU regulation led to a reduction of risk and to more prudent capital management. While this result is consistent with the broader literature, we are the first to examine the effects of EU deferral requirements (see Box B in the Annex). For the bonus cap, our evidence is inconclusive. We find no effect on risk from the introduction of the cap in the European Union, but an impact of its removal in the United Kingdom. The broader literature reveals an even starker divergence (see Box B in the Annex). The introduction of the EU cap leads to an increase of bank risk for some metrics (Colonnello et al (2023)). But its later removal in the UK is also associated with higher risk (De Angelis et al (2025)).
Conclusions
The implementation of the FSB standards on bank compensation varies widely, with some jurisdictions imposing quantitative requirements on the structure and horizon of pay, and others adopting a principles-based approach. This has led to significant differences in banks’ practices, both in terms of deferrals and variable compensation.
Our regression analysis suggests that longer deferrals reduce risk, while the results regarding the effectiveness of the bonus cap are inconclusive. This aligns with both theoretical and empirical literature, providing stronger support for deferrals as a risk-reducing mechanism. The effectiveness of the bonus cap can be undermined when market pressure from banks in other jurisdictions (or NBFIs) not subject to this requirement leads to an increase in fixed compensation.
Our results also highlight that measuring bank risk and its relationship with compensation design and regulation is inherently complex. This underscores that regulatory impact analyses need to be broad-based, both in terms of risk indicators and econometric approaches.
Looking at the 2023 turmoil, the failed banks were not fundamentally different from their peers in terms of deferrals (see Box A in the Annex). Rather, bank governance failed to ensure that compensation schemes reflected risk-taking and recognise the deterioration of performance in a timely manner. The turmoil highlights the role of governing boards and supervisors in overseeing the operation of compensation frameworks.
Annex
Bertrand Rime
The 2023 banking turmoil was the most significant episode of system-wide stress since the Great Financial Crisis (GFC). Credit Suisse and three US regional banks suffered a massive loss of confidence, making state intervention necessary. The failures highlighted weaknesses in governance, risk management and oversight as well as the vulnerabilities of some banks’ business models. Compensation, as part of the banks’ governance frameworks, was identified as one important contributor to the failures (FSB (2024)).
Our case study indicates that the failed banks’ compensation schemes were not fundamentally different from peer banks in terms of structure. But they relied on performance metrics that did not reflect long-term, risk-adjusted profitability, which especially weakened the disciplining effects of deferrals. This highlights the role of governing boards and supervisors in fostering sound governance.
Credit Suisse
For Credit Suisse, looking at the period 2015–17 seems particularly insightful, as this reveals a material and persistent divergence between compensation and performance, well before the bank’s destabilisation.
Credit Suisse was not an outlier in terms of compensation structure. The bank applied deferrals of five years for around 50% of variable compensation, with performance measurement over three years and a malus system. These features were broadly in line with its international peers as well as the guidelines of the banking supervisor, the Swiss Financial Market Supervisory Authority (FINMA), which stipulate that a significant percentage must be deferred for at least three years.
The compensation scheme allowed the distribution of compensation despite prolonged low profit or even losses. The bank adjusted performance metrics for the calculation of compensation by excluding goodwill impairments, restructuring expenses and litigation provisions, arguing that this would better reflect operational performance. These adjustments were very material, so that profitability metrics relevant for compensation remained positive over the period 2015–17, despite the bank reporting a cumulative loss under accounting standards. Capital-related performance metrics, which received a high weighting in the bank’s compensation scheme at the time, were also adjusted upward: the numerator excluded the effect of losses and provisions related to litigation, while the risk-weighted assets (RWA) calculation partially excluded operational risk surcharges ordered by FINMA.
While the executive board voluntarily cut its own variable compensation in 2017 following controversies with large shareholders, incentive compensation at the bank level declined only moderately. Hau and Rochet (2024) estimate that after accounting for the cost of capital, the period 2015–17 saw an economic loss of CHF 16 billion, while incentive compensation amounted to around CHF 9 billion. Similarly, for the period 2010–22, they estimate an economic loss of CHF 34 billion, compared with incentive compensation around CHF 40 billion.
In its lessons learned report, FINMA (2023) noted that the lack of financial consequences for misconduct and the exclusion of what the bank deemed extraordinary events encouraged an inappropriate risk culture. In this regard, it pointed at the responsibility of the governing board’s compensation committee and noted that shareholders approved all compensation proposals.
FINMA also observed that variable remuneration in years of substantial losses conflicted with one key principle in its guidelines, stipulating that poor performance should lead to the reduction or elimination of the compensation pool. At the same time, FINMA noted that its guidelines permitted deviations if they were justified and disclosed under the “comply or explain” approach. In its 2016, compensation report, Credit Suisse mentioned, in particular, staff retention as a justification for variable compensation levels.
In response to the collapse of Credit Suisse, Switzerland plans to establish binding quantitative deferral requirements, retention periods and clawbacks for variable remuneration, at least for systemically important banks (Swiss Federal Council (2026)). Misconduct and violations of supervisory laws would be penalised by a reduction or cancellation of variable remuneration.
US regional banks
The collapse of three US regional banks in March 2023 also illustrates that compensation schemes can fail to align payouts with long-term performance and risk, even when their structures do not appear as outliers compared with peers.
The US Government Accountability Office (GAO (2025)) compared the compensation structures of the three failed banks with their peers and found them broadly similar, including in terms of deferral horizons, performance periods and clawbacks. At the same time, the GAO observed that a three-year performance period could fail to capture risks that emerged over long time frames. Substantial variable compensation was paid out or granted during the two years preceding the banks’ failures.
In its review of the Silicon Valley Bank (SVB) failure, the Federal Reserve (2023) concluded that compensation packages of senior management were tied to short-term earnings and equity returns and did not include risk metrics. Therefore, managers had a financial incentive to focus on short-term profit over sound risk management. The report did not determine whether SVB was an outlier in this regard but recommended that supervisors consider how to strengthen alignment of compensation with risk management and long-term performance. It also highlighted that SVB’s increasing unrealised losses on its securities portfolio were not adequately captured in the standard accounting metrics used to assess profitability and financial health.
In 2024, four US supervisory agencies proposed revised compensation guidelines requiring a minimum four-year deferral for at least 60% of qualifying incentive-based compensation for senior executives at level 1 institutions. The GAO supported finalisation of the reforms. However, this finalisation would require the approval of two other regulators who did not join the initiative, and the Federal Deposit Insurance Corporation withdrew its initial support in 2025.

Gaston Gelos, Bertrand Rime and Kevin Tracol
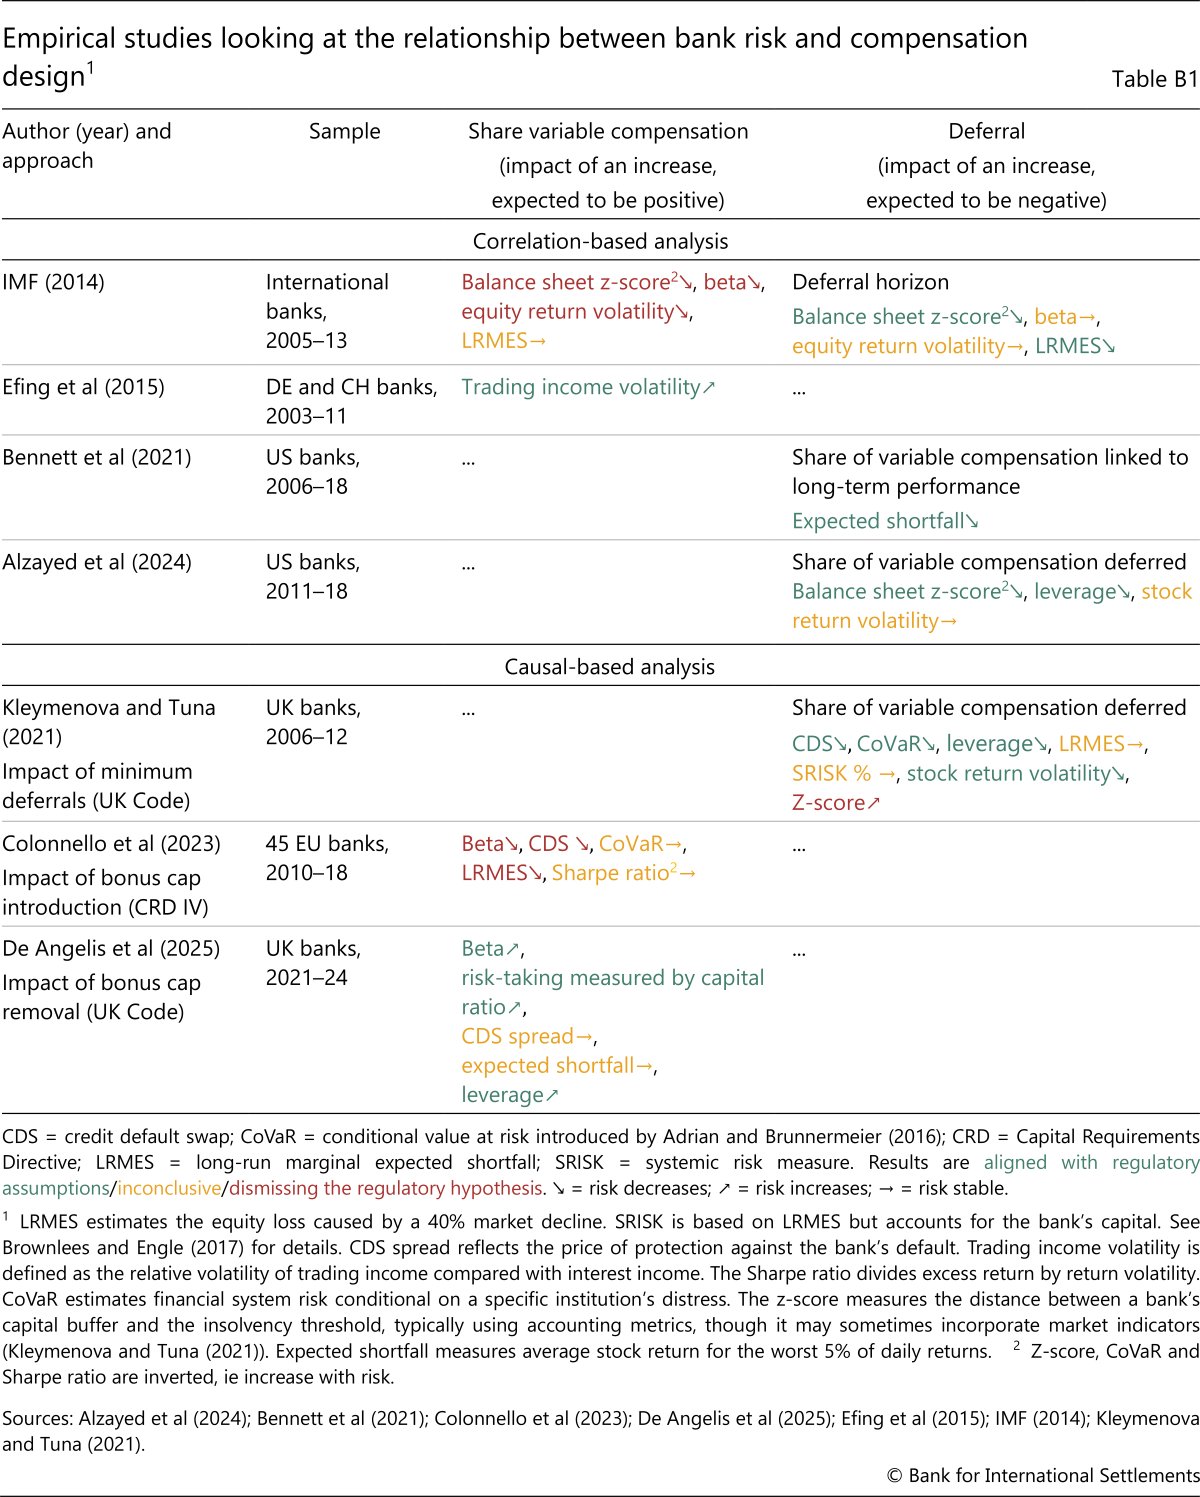
This box summarises the broader empirical literature on the relationship between bank risk and compensation design. It discusses seven empirical studies published since the Great Financial Crisis (GFC) that focus on the share of variable compensation, deferrals and their relationship to risk.
The first group of studies (upper block in Table B1) looks at the relationship between bank compensation design and risk in the sense of a correlation analysis, as we do with the first approach. The second group tries to causally identify the impact of specific episodes of regulatory changes on compensation practice and risk, as we do in the second approach.
The studies cover a wide spectrum of risk metrics that overlaps with ours (see footnotes of Table B1 for further details):
- Market-based risk indicators: in addition to long-run marginal expected shortfall (LRMES) and systemic risk (SRISK) described above, they also cover stock volatility, the Sharpe ratio, the credit default swap (CDS) spread, the conditional value at risk (CoVaR), which is an alternative measure of systemic risk introduced by Adrian and Brunnermeier (2016), and the expected shortfall of stock return.
- Accounting-based risk indicators: in addition to the balance sheet z-score and leverage ratio covered in our regressions, they consider return on equity (ROE) volatility, or trading income volatility.
Table B1 provides an overview of the results. To improve comparability, we distinguish between two “regulatory” hypotheses: (i) a higher share of variable compensation is associated with higher risk, supporting the bonus cap; and (ii) longer deferrals are associated with lower risk, supporting mandatory deferrals.
The proportion of results supporting the regulatory hypothesis (marked in green) is higher for deferrals than bonus caps, where results rejecting the hypothesis (in red) or inconclusive ones (in yellow) dominate. Our own results point in the same direction.
Focusing on regulatory impact studies, we note a contrast between Colonnello et al (2023), who find that the introduction of the bonus cap in the European Union either had no impact on bank risk or even increased it, and De Angelis et al (2025), who find that its subsequent removal in the United Kingdom either had no impact on bank risk or increased it. We also find mixed results across the two regulatory episodes.
On deferrals, the only regulatory impact study is Kleymenova and Tuna (2012), who find that mandatory deferrals introduced in 2011 under the UK remuneration code are associated with risk reduction. While we obtain a similar result for the introduction of deferral requirement in the European Union, the results are not directly comparable, since Kleymenova and Tuna (2021) focus on the deferred share of variable compensation, while we focus on the deferral horizon.
1 The views expressed in this publication are those of the authors and not necessarily those of the Bank for International Settlements or its member central banks. We thank Alan Villegas for excellent research support and Puriya Abbassi, Iñaki Aldasoro, Marc Farag, Pablo Hernández de Cos, Ulf Lewrick, Daniel Rees, Fernando Restoy, Andreas Schrimpf, Frank Smets, Costas Stephanou and Nikola Tarashev for helpful comments. All remaining errors are our own. The authors acknowledge the use of artificial intelligence in research assistance and editorial refinement. Responsibility for all errors remains with the authors.
2 Malus allows banks to reduce or cancel a granted compensation before it has been paid out. Clawbacks can force managers to return compensation after it has been paid out.
3 The FSB recommends in particular that risk adjustments account for the cost and quantity of capital required to support the risks taken.
4 For instance, the 2010 US inter-agency guidance on sound incentive compensation states: (i) “compensation should balance risk and financial results in a manner that does not encourage imprudent risk taking”; and (ii) “incentive compensation arrangements are likely to be better balanced if they involve deferral of a substantial portion over a multi-year period”.
5 The EU deferral requirement was introduced in several steps. Under the 2011 CRD III, 60% of variable compensation had to be deferred for a horizon of at least three years, with an indication that five years could be appropriate in some cases. Under the 2014 CRD IV, the European Banking Authority specified a minimum of five years for senior management at significant institutions.
6 EVA represents a risk-adjusted performance metric since it compares profits with the economic cost of capital, which is an increasing function of risk (Stoughton and Zechner (2007)). ECB (2010) discusses the limits of ROE and reviews alternative bank performance metrics.
7 Some banks set capital targets to facilitate the transition to new capital regimes, such as Basel III. They sometimes also define “hurdle” capital ratios, below which compensation is subject to malus (see previous section). ESG is a framework for assessing sustainability and ethical practices in environmental, social and corporate governance areas.
8 The weighting of ROE is 11% for insurance companies and 6% for capital market firms (classification based on GICS). Bennett et al (2021) also find that US banks put a greater weight on ROE than non-banks. Cerasi et al (2017) report that the share of variable compensation is sensitive to ROE, but that this sensitivity has declined following the GFC.
9 Since TSR varies more widely than ROE, comparing coefficients alone can be misleading. The Shapley decomposition, which calculates the marginal contribution of each variable to explained variance, confirms that ROE plays a stronger role in explaining compensation than TSR.
10 We also ran regressions with no lag. For the z-score, the coefficients are no longer statistically significant, likely due to the fact that it is calculated using a four-year moving window. The other results remain significant, except for the Common Equity Tier 1 management buffer.

12 However, the pre-reform gap may also capture other factors influencing risk-taking behaviour. While some endogeneity may persist, including US banks in the analysis, for which the reform does not apply regardless of their pre-reform gap, helps to mitigate this concern.
13 The fact that only EU banks were subject to the bonus cap and to quantitative deferral requirements (for both the share to be deferred and the horizon) supports their identification as treated banks. The contrasting evolution for the deferral horizon and the share of variable compensation between the European Union and the United States also indicate that these banks were treated differently, both in terms of regulation and supervision.
14 The default bonus cap is set at 100%, but this limit is not constraining since shareholders have the option to increase it to 200%.
Adrian, T and M Brunnermeier (2016): “CoVaR”, American Economic Review, vol 106, no 7.
Alzayed, N, R Eskandari, A Eshraghi and H Yazdifar (2024): “Revisiting corporate governance and financial risk-taking”, International Journal of Finance & Economics, vol 29, no 4.
Asai, K (2016): “Is capping executive bonuses useful?”, IMF Working Papers, no 2016/196.
Basel Committee on Banking Supervision (BCBS) (2015): Corporate governance principles for banks.
Baudino, P, J Beissinger, R Corrias, M Drehmann, E Eren, B Erik and N Tarashev (2026): “On the comparison of capital requirements for global systemically important banks”, FSI Insights on policy implementation, no 76.
Bennett, B, R Gopalan and A Thakor (2021): “How are bankers paid?”, Review of Corporate Finance Studies, vol 10, no 4.
Board of Governors of the Federal Reserve System (2023): Review of the Federal Reserve’s supervision and regulation of Silicon Valley Bank.
Bolton, P, H Mehran and J Shapiro (2015): “Executive compensation and risk-taking”, Review of Finance, vol 19, no 6.
Brownlees, C and R Engle (2017): “SRISK: A conditional capital shortfall measure of systemic risk”, Review of Financial Studies, vol 30, no 1.
Cerasi, V, S Deininger, L Gambacorta and T Oliviero (2017): “How post-crisis regulation has affected bank CEO compensation”, BIS Working Papers, no 630.
Colonnello, S, M Koetter and K Wagner (2023): “Compensation regulation in banking”, Journal of Accounting and Economics, vol 76, no 1.
De Angelis, D, H Doshi, M Liang and V Yerramilli (2025): “The effect of unlimiting bankers’ incentive pay on bank’s risk profile and value”, SSRN Electronic Journal, 10.2139/ssrn.5422814.
Efing, M, H Hau, P H Kampkötter and J-C Rochet (2023): “Bank bonus pay as a risk sharing contract”, Review of Financial Studies, vol 36, no 1.
Efing, M, H Hau, P Kampkötter and J Steinbrecher (2015): “Incentive pay and bank risk-taking: evidence from Austrian, German and Swiss banks”, Journal of International Economics, vol 96, supplement 1.
European Central Bank (ECB) (2010): Beyond RoE – How to measure bank performance, appendix to the report on EU banking structures, September.
Financial Stability Board (FSB) (2009a): Principles for sound compensation practices.
——— (2009b): Implementation standards for the FSB principles for sound compensation practices.
——— (2018): Supplementary guidance to the FSB principles and standards on sound compensation practices.
——— (2024): Legal and regulatory challenges to the use of compensation tools.
FINMA (2023): Lessons learned from the CS crisis, Bern.
Government Accountability Office (GAO) (2025): Bank regulation: agencies should finalize rulemaking on incentive compensation, GAO-25-107032.
Hakenes, H and I Schnabel (2014): “Bank bonuses and bailouts”, Journal of Money, Credit and Banking, vol 46, no s1.
Hau, H and J-C Rochet (2024): “Eine Analyse der Finanzlage der Credit Suissse”, report for the PUK.
Hoffmann, F, R Inderst and M Opp (2022): “The economics of deferral and clawback requirements”, Journal of Finance, vol 77, no 4.
International Monetary Fund (IMF) (2014): “Risk taking by banks: the role of governance and executive pay”, Global Financial Stability Report, chapter 3, October.
Jarque, A and E S Prescott (2010): “Optimal bonuses and deferred pay for bank employees: implications of hidden actions with persistent effects in time”, Federal Reserve Bank of Richmond Working Paper Series, no 10-16.
Jensen, M and W Meckling (1976): “Theory of the firm: managerial behavior, agency costs and ownership structure”, Journal of Financial Economics, vol 3, no 4.
John, K, A Saunders and L Senbet (2000): “A theory of bank regulation and management compensation”, Review of Financial Studies, vol 13, no 1.
Kleymenova, A and I Tuna (2021): “Regulation of compensation and systemic risk”, Journal of Accounting Research, vol 59, no 3.
Pennacchi, G and J Santos (2021): “Why do banks target ROE?”, Journal of Financial Stability, vol 54, 100856.
Stoughton, N and J Zechner (2007): “Optimal capital allocation using RAROC™ and EVA®”, Journal of Financial Intermediation, vol 16, no 3.
Swiss Federal Council (2026): Explanatory report on the amendment of the Banking Act, August.
Thanassoulis, J and M Tanaka (2018): “Optimal pay regulation for too-big-to-fail banks”, Journal of Financial Intermediation, vol 33, January.
Graph 2.B: Metrics calculated for banks with total assets above USD 50 billion. The share of variable compensation is based on compensation paid (instead of granted) to cover the period since the GFC (Bloomberg and ISS Incentive Lab). In contrast, the bonus cap is based on granted compensation, which can lead to deviations depending on effective performance. The average deferral horizon and the share of performance-based compensation are calculated based on ISS Incentive Lab data.
Graph 3: We estimate the following equation:


Compensation is expressed in natural log. Since we focus on the vesting process, we introduce a two-year lag between granted compensation and paid compensation, and we measure performance (ROE and TSR) over the corresponding time interval. We use panel data regression over the period 2005–24 with errors clustered at the firm level and firm-specific fixed effects. The regressions in the panels labelled “All banks”, “Regional banks” and “Diversified banks” include banks with total assets exceeding USD 100 billion (ie 53 banks). The regression in the panels labelled “Large US banks” and “Large European banks” focus on banks with total assets exceeding USD 250 billion (ie 35 banks). The business model classification follows the Global Industry Classification Standard (GICS).
Graphs 4, 6 and 7: The risk-related explained variables are defined as follows:
- LRMES estimates the equity loss caused by a 40% market decline (see Brownlees and Engle (2017)).
- SRISK is based on LRMES but accounts for the bank’s capital (see Brownlees and Engle (2017)). It is normalised by bank size.
- Moody’s EDF estimates a company’s probability of default by combining balance sheet and market-based information, such as equity value and stock volatility.
- The rating reflects Fitch’s bank individual rating before 2011 and viability rating since 2011. It was rescaled from 0% for the best rating to 100% for the worst. Inverted so that larger numbers indicate riskier banks.
- The z-score measures the distance between a bank’s capital buffer and the insolvency threshold, expressed in terms of standard deviations of return on assets. Inverted so that larger numbers indicate riskier banks.
Graphs 4, 5, 6 and 7: The explanatory variables are defined as follows:
- The deferral horizon represents the number of years until the CEO receives compensation in full.
- The share of variable compensation is defined as the ratio of performance-based pay to total compensation, based on granted compensation. The coefficient represents the effect of a 10 percentage point increase.
- The leverage ratio (excluded for regressions where capital is the explained variable) is based on accounting instead of regulatory standards to cover the period preceding the introduction of the Basel leverage ratio. The higher the leverage ratio, the lower the leverage. The coefficient represents the effect of a 1 percentage point increase.
Graphs 5, 6 and 7: The capital-related explained variables are defined as follows:
- The CET1 capital ratio is based on CET1 capital and risk-weighted assets.
- The CET1 management buffer (only for Graph 5) is defined as the difference between the actual capital ratio and capital requirements.
- The leverage ratio is based on accounting instead of regulatory standards to cover the period preceding the introduction of the Basel leverage ratio. The higher the leverage ratio, the lower the leverage.
Graphs 6 and 7: Saturating the model with country-by-year fixed effects allows us to purge variation attributable to supervisory and regulatory changes decided at the national level such as macroprudential buffers (Colonnello et al (2023)). For the parallel trend test, the null hypothesis is that pre-treatment coefficients are equal to zero, implying no differential trends between treated and control banks prior to treatment.