Markets recalibrate amid shifting currents
During the review period, financial markets had to adjust to shifting currents. Even though markets initially appeared calm on the surface, there were significant shifts under the surface as investors rotated away from previously high-performing assets. Volatility began to creep up, exacerbated by the conflict in the Middle East in early March.1
Global equity markets saw regional and sectoral shifts in late 2025, with investors moving away from US large cap and growth stocks. European and Japanese equities posted gains, while emerging market economy (EME) equities saw an even greater boost. Despite solid earnings, concerns over artificial intelligence (AI) spending and disruption weighed on richly valued technology companies. Value and small cap stocks outperformed. While index volatility rose, it was eclipsed by significantly greater individual stock volatility.
Foreign exchange (FX) market shifts signalled growing investor unease in an increasingly fragile risk landscape. Through most of the review period, the US dollar depreciated as is typical of risk-on environments, but at the same time the Swiss franc appreciated notably, a hallmark of global risk-off episodes. The escalation of geopolitical tensions in the Middle East reversed the depreciation of the dollar, consistent with both its positive correlation with oil prices in recent years and the intensification of the risk-off sentiment.
Precious metals and energy prices also experienced notable volatility. Gold and silver surged early in 2026, reflecting a unique mix of investors' quest for safe havens and speculative interest. However, the rally ended abruptly in late January, in part due to leveraged position unwinds. Rising geopolitical tensions in early March drove oil and natural gas prices significantly higher. Amid these shifts, precious metals came under renewed pressure, trading more like risk assets than safe havens.
Credit markets remained fairly stable but showed some differences across segments. Spreads for investment grade and high-yield bonds stayed near historical norms, supported by resilient investor appetite for yield, despite impacts from escalating tensions. While issuance in bond markets broadly held up, activity in leveraged loans and private dealmaking declined from earlier peaks. Concerns over AI-driven disruption refocused attention on private credit portfolios, especially those with significant software exposures, as investor redemptions intensified.
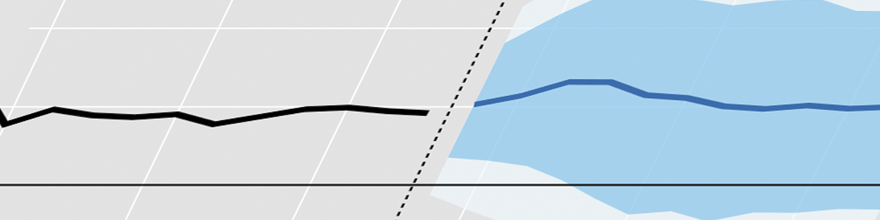
Sovereign bond markets diverged across advanced economies (AEs). Long-term yields rose sharply in Japan, while those in the United States and the euro area moved sideways. After initial narrowing, euro area sovereign spreads widened again after the conflict broke out. Inflation expectations edged up, leading investors to revise expectations of policy rates upwards and push back the expected timing of US rate cuts. Bond yields moved up and yield curves mildly flattened as a result, reversing some of the previous steepening.
EME assets initially rose, driven by a weaker dollar, carry trades and portfolio inflows, but momentum waned with intensifying geopolitical frictions. Latin American and Europe, the Middle East and Africa (EMEA) currencies outperformed, while Asian currencies saw modest gains. Portfolio inflows fuelled equity rallies, especially in commodity-exporting EMEs, and debt markets reflected favourable financing conditions. However, this positive trend was disrupted in early March due to heightened geopolitical risks.
- Risky asset returns diverged amid rotation shifts across regions and sectors, while elevated uncertainty and spikes in energy prices on the back of rising geopolitical tensions triggered bouts of volatility.
- Sovereign yields moved unevenly across AEs, and investors adjusted monetary policy expectations in response to higher expected inflation amid heightened geopolitical strains.
- Asset markets in EMEs initially rallied, supported by a softer US dollar and renewed investor appetite for carry trades, but momentum waned with escalating geopolitical tensions.
Cross-currents: selective risk-taking collides with geopolitical tensions
Despite geopolitical flare-ups, investors' risk appetite broadly remained resilient through most of the review period, but risk-taking was selective. Solid corporate fundamentals and macroeconomic data releases contributed to this resilience. Investors' tolerance for risk was put to the test as a resurgence of tariff-related uncertainty, sharp moves in precious metal prices and rising geopolitical tensions triggered bouts of volatility. Concerns about high valuations called into question the sustainability of the momentum in technology stocks and led to underperformance as investors rotated to other sectors. Yet risky assets held their ground for the most part, with equity markets posting modest gains and credit spreads remaining compressed.
The equity market resilience that characterised the second half of 2025 was tested on several occasions during the review period, but broadly carried over into 2026. Equity indices rose, supported by solid risk appetite and fundamentals (Graph 1.A). The rise in US equity markets was relatively subdued, while European and Japanese equities posted stronger gains, reflecting improved sentiment towards their respective economies' outlooks and diversification flows away from US stocks. Rising tensions in the Middle East reversed some of the gains in early March, in particular for European and Asian equities, given their greater exposure to energy-related supply disruptions.
Large US technology stocks faced volatility despite strong earnings, as concerns over elevated valuations and future capital spending emerged. Guidance on higher capital spending raised fears of potential earnings disappointments, particularly for AI "hyperscalers" (see Box A). While corrections lowered valuations, price/earnings (P/E) ratios for the broader market remained above historical norms and approached dotcom bubble levels, though big tech firms' ratios were comparatively lower (Graph 1.B). As the Magnificent 7 (M7) stocks had driven their share of the S&P 500 index to nearly 35%, declines in these stocks began to drag on market indices.
Signs of regional rotation emerged as investors diversified away from concentrated US large cap exposure, with concerns over the scale of AI-related capital expenditure denting sentiment. Equity fund flows appeared to shift from the United States towards EMEs and other AEs, particularly those in Europe (Graph 1.C).

Egemen Eren, Ingomar Krohn, Karamfil Todorov
Investment in artificial intelligence (AI) infrastructure, particularly data centres, has risen rapidly and now accounts for a substantial share of investment in advanced economies. Against this backdrop, big US tech firms – "hyperscalers" – have accelerated their capital expenditures (capex) (Graph A1.A). But, as these expenditures have grown significantly beyond their usual investments, a rising share of spending is funded through borrowing.
Corporate bond markets have been hyperscalers' primary source of financing. Their gross issuance increased markedly, topping $100 billion in 2025 (Graph A1.B). Most issuance was longterm, with maturities over five years, locking in funding for multi-year build-outs. However, credit default swap (CDS) spreads rose (Graph A1.C), especially for hyperscalers with lower credit ratings, reflecting both the volume of supply and uncertainties around the projects' payoffs.
Alongside traditional bonds, hyperscalers have turned to off-balance sheet arrangements to finance infrastructure expansions, often in partnership with private credit firms. A common structure involves a dedicated vehicle – often a joint venture or special purpose entity – that acquires or develops data centre assets. The vehicle is capitalised with equity from a consortium of sponsors and raises debt through private placements. The hyperscaler typically holds a minority stake, commits to long-term operating leases or capacity offtake agreements (longterm commitments to purchase or reserve power and compute capacity), and may provide various guarantees. Economically, this substitutes upfront capex with multi-year operating expenses while keeping most of the associated debt off the hyperscaler's balance sheet. The debt is serviced by lease cash flows and is held by private credit funds and other institutional investors, sometimes with investment grade features supported by asset backing and contractual guarantees from hyperscalers with investment grade credit ratings.

These arrangements amount to "shadow borrowing": obligations that are economically akin to debt but largely reside outside corporate balance sheets. By channelling sizeable private credit into AI infrastructure, these structures strengthen links between hyperscalers and non-bank investors such as private credit vehicles and insurers. Banks support the vehicles with funding lines, potentially creating new shock transmission channels – eg via refinancing pressures at the vehicle level, procyclical shifts in private credit appetite or the activation of guarantees.
The views expressed here are those of the authors and not necessarily those of the BIS or its member central banks. These include firms such as Amazon, Alphabet, Microsoft, Meta and Oracle. See also I Aldasoro, S Doerr and D Rees, "Financing the AI boom: from cash flows to debt", BIS Bulletin, no 120, 2026.
Supported by the dollar's depreciation, EMEs rallied for most of the review period, outperforming US equities (Graph 1.A, orange and blue lines). Asian AEs like Japan and Korea also delivered strong gains.
Within the United States, investors shifted from the M7 and high-momentum tech stocks to value and cyclical sectors, with small caps outperforming while software stocks faced pressure (Graph 2.A). Banks, energy, industrials, consumer staples and materials led gains (Graph 2.B), with banks benefiting from rising profitability in a resilient economy, and other sectors reflecting a broader rotation from growth to value stocks (Graph 2.C). Globally, software equities struggled due to concerns over AI-driven revenue disruptions, which also affected private credit firms with exposure to the sector (see Box B).

Index volatility crept up, reflecting sustained investor demand for downside protection, but it masked the even sharper rise in single-stock volatility under the hood. As volatility trended higher, geopolitical flare-ups brought about spikes to the VIX, but these were relatively short-lived. The dispersion index, which measures the gap between average singlestock and index volatility, climbed (Graph 3.A, red line). This signalled higher idiosyncratic risk relative to the uptick in indexlevel risk.
Currency movements diverged from their usual trends. A depreciating US dollar through most of the period was consistent with sustained risk appetite amid the rotation shifts. At the same time, appreciation pressures on the Swiss franc, which typically coincide with global risk-off episodes, underscored that investors balanced risk exposure with a demand for safety (Graph 3.B). The dollar depreciation was reversed after the outbreak of the Middle East conflict, reflecting the intensification of the risk-off sentiment after the conflict began and the dollar's positive correlation with oil prices in recent years.2
The conflict in the Middle East triggered turbulent moves in oil and gas prices towards the end of the review period. Prices of oil and natural gas (especially in Europe) jumped (Graph 3.C, blue and purple lines) and oil volatility spiked (Graph 3.A, blue line), reflecting the significant uncertainty in energy markets. Oil and gas futures curves shifted upwards, with the largest increases concentrated in shorter-term contracts.
Sebastian Doerr, Egemen Eren, Ingomar Krohn, Karamfil Todorov
Lending by private credit funds to software-as-a-service (SaaS) firms has grown rapidly and makes up a substantial share of funds' loan portfolios. Outstanding loans to SaaS firms increased from almost $8 billion in 2015 to over $500 billion, or 19% of total direct loans, by end-2025 (Graph B1.A). By now, a third of private credit funds have extended loans to the SaaS sector, on top of their rising exposure to big US tech firms and other artificial intelligence (AI) companies (see Box A). In this box, we zoom in on business development companies (BDCs) to get a consistent picture of private credit lending to SaaS firms. BDCs are publicly traded and have quarterly disclosures. As such, they provide a window into the opaque private credit space. Moreover, BDCs account for one fifth of all direct loans in the United States and extended over 15% of their loans to SaaS firms in 2025.
Concerns that AI may disrupt traditional SaaS business models have led to notable price adjustments in the software sector. Software companies' stocks collapsed by almost 30% between October 2025 and February 2026 (Graph B1.B, red line), while BDCs' stock prices fell by about 10% on average (blue line). Meanwhile discounts to net asset value, which is largely determined by the book value of illiquid private loans, deepened (yellow line), potentially signalling worries about underlying valuations.

BDCs with higher SaaS exposure have underperformed their peers (Graph B1.C). Since October 2025, BDCs with high exposure to software firms have performed around 5 percentage points worse than those with low exposure. These developments highlight investor concerns that further advances in AI tools may disrupt the SaaS sector amidst redemption pressures from private credit's push towards retail investors.
The views expressed here are those of the authors and not necessarily those of the BIS or its member central banks. Globally, private credit stands at over $2 trillion; see F Avalos, S Doerr and G Pinter, "The global drivers of private credit", BIS Quarterly Review, March 2025. See I Aldasoro, S Doerr and K Todorov, "Retail investors in private credit", BIS Bulletin, no 106, 2025.
Precious metals posted gains over the period but were subject to large price swings. Gold and silver extended their 2025 momentum, reflecting a unique mix of safe haven demand and amplification by trend-following investors and leverage (see Box C).3 Gold reached fresh highs in January 2026, and silver benefited additionally from industrial demand and supply shortages (Graph 3.C). The price of silver, which had doubled in 2025, increased over 50% in January 2026 alone. However, a sharp drawdown occurred in late January as gold and silver sold off rapidly amid the resolution of uncertainty surrounding the future chair of the Federal Reserve. Silver recorded its largest one-day loss since the 1980s, falling by nearly 30%. Precious metal prices extended their decline despite the escalation of the Middle East conflict, a situation that would typically boost demand for safe haven assets.
Crypto saw large sell-offs as part of the general rotation away from growth assets, but also an upswing amid the escalation of geopolitical tensions. Following the drop in technology stocks, bitcoin slumped by about 50% from its 2025 highs and touched 2024 levels (Graph 3.C). These moves were probably exacerbated by liquidations of leveraged long crypto positions.4 Bitcoin's behaviour amid the escalating tensions early March was puzzling, but overall it ended the period above pre-conflict levels, pausing its prior decline.

Egemen Eren, Ingomar Krohn, Karamfil Todorov
After a prolonged rally through 2025 and into early 2026, prices of precious metals such as gold and silver reversed abruptly in late January and February 2026. Retail-driven exuberance, increasingly channelled through exchange-traded funds (ETFs), set the stage for outsize moves, continuing the trend from 2025. The daily rebalancing of leveraged ETFs and margin-triggered liquidations amplified the swings, particularly in silver.
Following substantial gains in 2025 and a further surge in early January 2026, gold and particularly silver prices plunged in late January (Graph C1.A). After doubling over 2025 and rising by over 50% in January 2026, the silver price fell by about 30% in a single day in late January (blue line). Gold broadly followed a similar but less extreme pattern (red line). The precious metals crash seemingly coincided with shifts in expectations about the US dollar and the path of monetary policy, but was hard to square with broader changes in fundamentals. The abrupt price drop and the spike in precious metals' volatility point to the role of retail flows, and amplification of price moves due to forced sales by leveraged ETFs, trend-following investors such as commodity trading advisers (CTAs) and margin dynamics.

Fund flow data indicate that retail investors were the main source of inflows into silver and gold funds in the run-up to the episode. In contrast, institutional investors maintained stable positions or even trimmed exposure (Graph C1.B). Moreover, futures positioning reveals long leveraged exposure among smaller speculative participants. "Non-reportables" – typically smaller investors – were long silver futures heading into the correction. As prices fell sharply and exchanges raised margin requirements, these investors probably had to reduce positions quickly. "Managed money" – including CTAs and institutional investors – also cut long positions, while dealers stepped in to provide liquidity by cutting short positions (Graph C1.C).
For some time, retail investors have found it attractive to use ETFs to obtain precious metal exposure. Sustained premia of gold and silver ETFs over their net asset value (NAV) signalled strong, one-sided buying pressure that outpaced primary market arbitrage (Graph C2.A). Such persistent premia arise when demand for ETF shares exceeds the capacity of authorised participants to create new shares and deliver physical metal to bring market prices down to NAV. As prices reversed in late January, these premia compressed rapidly, and for silver turned into pronounced discounts, consistent with one-sided selling pressure and a sharp turn in flows.

Leveraged silver ETFs contributed to the turmoil because of their amplification mechanics. To maintain fixed daily leverage, these funds rebalance each day. When prices rise, they buy the underlying asset (often via silver futures) to restore target leverage and when prices fall, they sell the underlying asset. This predictable, momentum-like trading creates feedback loops that reinforce prevailing trends and can distort prices.
The footprint of leveraged ETFs' destabilising trading appears to have grown amid the retail-driven exuberance in precious metal markets. The leverage rebalancing multiplier, a summary measure of the market impact of leveraged ETFs' daily rebalancing flows, doubled over the course of 2025 (Graph C2.B, blue line). The share of ETFs in the market followed similar dynamics (red line). This indicates that leveraged ETF activity became a larger part of the market and intensified price trends.
Margin-triggered liquidations further amplified the sell-off. Rapid price declines increased variation margins on futures positions, and several exchanges tightened initial margin requirements during the episode (Graph C2.C). The resulting funding pressures forced deleveraging among participants most exposed to the downdraft, akin to past stress episodes. The liquidations of investors' positions, alongside systematic selling from leveraged ETF rebalancing into the decline, probably added to downward pressure, creating a self-reinforcing loop of lower prices and further margin calls.
The views expressed here are those of the authors and not necessarily those of the BIS or its member central banks. G Cornelli, M Lombardi, and A Schrimpf, "Bubble conditions in US equities and gold?", BIS Quarterly Review, December 2025. K Todorov, "When passive funds affect prices: evidence from volatility and commodity ETFs", Review of Finance, vol 28, no 3, May 2024. BIS, "Carry off, carry on", BIS Quarterly Review, September 2024.
Credit spreads remained compressed compared with their historical norms in the United States and Europe, especially in the high-yield segment (Graph 4.A). Resilient macroeconomic fundamentals and solid risk appetite helped to sustain valuations in these markets in spite of negative impacts from escalating tensions in the Middle East.
Despite compressed spreads and healthy investor demand, credit markets were marked by sluggish bond issuance and renewed focus on private credit portfolios. Investment-grade bond issuance remained relatively subdued despite usual seasonal upswings (Graph 4.B). Leveraged loan spreads broke their downward trend and picked up notably towards the end of the review period, signalling a negative shift in market sentiment (Graph 4.C). Leveraged loan issuance and private deal-making experienced significant declines from their previous peaks, highlighting a broader slowdown in riskier segments of the credit market (Graph 4.B, red and yellow lines). Strains emerged in private credit as investor redemptions intensified and some funds imposed redemption restrictions.
One notable development in credit markets was the increased borrowing of large technology firms. These firms, known as AI hyperscalers, provide the infrastructure, storage and specialised hardware necessary to develop and run large-scale AI models. To finance their massive infrastructure investments, these firms have increasingly raised funds through corporate debt and other complex funding structures. Market concerns about the sustainability of such borrowing were reflected in the widening of CDS spreads for some AI hyperscalers (see Box A).

Sovereign bond markets diverged amid changing monetary and fiscal policy outlook
Sovereign bond markets evolved unevenly across AEs. Long-term yields on Japanese and Australian government bonds increased markedly (Graph 5.A, yellow line and purple line), while they moved sideways in the United States and Germany (Graph 5.A, red and blue lines). The volatility of US Treasuries edged up during the review period, in particular after the start of the conflict in the Middle East, even though it remained subdued by historical standards (Graph 5.B). In the euro area, sovereign spreads over German government bonds reversed their narrowing trend alongside rising geopolitical tensions in the Middle East as increasing oil and gas prices created uncertainties around the fiscal outlook (Graph 5.C).
The Middle East conflict led to a repricing of monetary policy expectations. In the United States, expectations of rate cuts shifted further out into the year, while in other AEs market participants expected more rate hikes during 2026. The re-evaluation of the path of interest rates reflected higher near-term inflation expectations, especially since the start of the conflict (Graph 6.B). Bond yields moved up as a result, further compounded by the anticipated fiscal implications of the conflict with an expected increase in debt supply that would eventually need to be absorbed by markets.


Term spreads also moved differentially over time and across AEs. At the start of the review period, the overall tendency was for a steepening as long-term yields rose more than short-term ones, particularly in Japan. Expectations of large fiscal spending plans and lacklustre demand for long-term bonds by key players, such as life insurance companies, were key factors lifting Japanese long-term yields. Towards the end of the review period, the trajectory of term spreads reversed (Graph 6.C). This configuration primarily reflected a market pricing of higher near-term inflation expectations. In contrast to other AEs, yield curves flattened in Australia throughout the period, extending the earlier trend.
Global repositioning moves EME assets
EME assets initially benefited from the US dollar's weakness and portfolio rotation away from the United States, but the spike in uncertainty due to geopolitical strains later eroded some of the gains. Supportive market conditions towards the end of 2025 filtered through, with most EME currencies firming, bond spreads narrowing and equities advancing. Performance, however, varied across countries, reflecting differences in terms of trade, external vulnerabilities and domestic macroeconomic fundamentals.
EME currencies mostly appreciated against the US dollar throughout most of the review period (Graph 7.A), in line with the sustained initial risk appetite and rotation towards investments outside the United States. Currency gains were strongest among high-yielding, commoditylinked markets in Latin America and EMEA, while appreciation was more modest across Asia. In particular, the South African rand and Mexican peso posted notable increases, continuing the positive momentum built during 2025. These currencies were also supported by favourable interest rate differentials and broadly stable macroeconomic policy settings. With the escalation of the Middle East conflict, however, the resulting broad dollar appreciation halted the momentum across most EME currencies.
The conflict-related volatility in early March also affected carry trade profitability and disrupted the momentum dynamics which had lifted many EME currencies over previous months. While carry-to-risk ratios had picked up significantly in Mexican peso and Brazilian real vis-à-vis Japanese yen, they peaked in 2026, consistent with a rising risk of funding currency appreciation (Graph 7.B). In line with this, currency futures positioning indicated that, early on, leveraged funds increased their net long exposure to EME currencies – notably the Mexican peso – while at the same time keeping short positions in funding currencies such as the yen (Graph 7.C). These short positions were gradually pared back during the first few weeks of 2026 and were further scaled back when markets switched to risk-off in early March.

Bond markets in EMEs broadly followed a similar pattern. Amid the rotation shifts away from US assets, investors extended their search for yield into EME debt. EME sovereign issuance gathered momentum as market conditions improved (Graph 8.A). The momentum faded at the start of 2026 as investment grade supply dwindled and high-yield volumes stayed flat. In parallel, spreads on US dollar-denominated EME sovereign bonds initially tightened but then reversed amid rising geopolitical tensions (black line).
Equity markets in EMEs mostly rallied early on but later reversed part of their gains. The initial momentum was widespread. Commodity-exporting economies in Latin America – particularly Peru, Brazil and Colombia – recorded gains, supported by rising commodity prices (Graph 8.B). Equity returns in EMEA were similarly strong, benefiting from diversified positioning across EMEs. In Asia, returns were lower but mostly positive, with some exceptions. Investor demand for EME assets was also evident in portfolio flows. Building on the pickup in inflows at the end of 2025, investors increased allocations to EMEs, particularly in EMEA and Latin America (Graph 8.C). Such momentum waned amid the conflict-related pressures, with stock markets of countries with large energy market dependencies falling more sharply than their peers.

Graph 1.A: EA = STOXX Europe 600; EMEs = simple average of stock market returns in AR, BR, CL, CN, CO, HU, ID, IN, MX, MY, PE, PH, PL, TH, TR and ZA; JP = Nikkei 225; KR = KOSPI; US = S&P 500.
Graph 1.B: Magnificent 7= Alphabet, Amazon, Apple, Meta, Microsoft, Nvidia and Tesla. The composition of the S&P 500 is fixed on 5 March 2026. Market capitalisation-weighted average. For STOXX 50, the series starts in June 2001. For March 2026, data as of 5 March 2026.
Graph 1.C: Cumulation since January 2025. EMEs = AR, BR, CL, CN, CO, HU, ID, IN, MX, MY, PE, PH, PL, TH, TR and ZA; euro area = BE, DE, ES, FR, IT and NL; other AEs = AU, CA, CH, JP and SE. Data for China until December 2025.
Graph 2.A: Magnificent 7 =Alphabet, Amazon, Apple, Meta, Microsoft, Nvidia and Tesla. For the Magnificent 7 and the rest of the S&P 500, market capitalisation-weighted average. The composition of the S&P 500 is fixed on 5 March 2026.
Graph 2.B: For each sector, average of the respective index constituents' returns.
Graph 2.C: Measured by the S&P 500 Growth and Value indices, respectively.
Graph 3.A: Dispersion index = Cboe S&P 500 Dispersion Index; oil VIX = Cboe Crude Oil ETF USO VIX Index; VIX = Cboe Volatility Index.
Graph 3.B: Five-day moving average.
Graph 3.C: EU natgas = Title Transfer Facility (TTF); precious metals index = simple average across the spot prices of palladium, platinum and silver.
Graph 4.A: Spreads of ICE BofAML index yields to OIS rates with matched maturities. Ten-year OIS for US investment grade, five-year for the rest. The USD OIS rate is based on SOFR starting on 11 December 2018. The EUR OIS rate is based on ESTR starting on 11 October 2019. For US investment grade, the box plot shows data between 31 July 2008 and 5 March 2026, due to data availability of USD 10-year OIS.
Graph 4.B: Twelve-month moving sum.
Graphs 6.A and 6.B: 1 December 2025 = beginning of the review period; 27 February 2026 = last observation prior to the start of the conflict in the Middle East; 5 March 2026 = end of the review period.
Graph 6.C: Ten-year minus two-year government bond yield.
Graph 7.A: Simple average. Asia = CN, ID, IN, MY and TH; EMEA = HU, PL and ZA; Latin America = BR, CL, CO, MX and PE. Five-day moving average.
Graph 8.C: Asia = ID, IN, LK, MN, MY, PH, PK, TH, TW and VN; Latin America = BR, CL, CO, and MX; other EMEs = GH, HU, KE, LB, MK, PL, QA, RO, RS, RU, SA, TR, UA and ZA.
1 The review period covers 29 November 2025 to 5 March 2026.
2 On the changing correlations of oil prices and the US dollar, see B Hofmann, D Igan and D Rees, "The changing nexus between commodity prices and the dollar: causes and implications", BIS Bulletin, no 74, 2023.
3 See also G Cornelli, M Lombardi and A Schrimpf, "Bubble conditions in US equities and gold?", BIS Quarterly Review, December 2025.
4 On the role of risk amplification due to leverage in crypto markets, see also M Schmeling, A Schrimpf and K Todorov, "Crypto carry", Management Science, forthcoming.