Non-bank counterparties in international banking
The BIS has expanded the details that it publishes about banks' balance sheet linkages with nonbank counterparties. These additional details show that banks have increasingly large positions vis-à-vis the non-bank financial sector. Their exposures to non-financial counterparties are highly concentrated, mainly in holdings of advanced economy government debt. At the same time, banks lend significant amounts to non-financial corporations located in financial centres. Banks' cross-border claims on households are relatively small, while their cross-border liabilities to this sector reflect non-resident nationals making deposits with banks in their home country.1
JEL classification: C82, F30, G21, G23.
The 2007-09 financial crisis highlighted many gaps in the data covering banks' international assets and liabilities (CGFS (2012), FSB-IMF (2009)). One critical gap was a lack of information about the sector of banks' counterparties. In particular, information about the size and nature of banks' positions with non-bank financial institutions in specific countries was sorely needed, but mostly unavailable, during the crisis. A granular sectoral breakdown helps in tracking international financial integration and risk-sharing in international capital flows (Alfaro et al (2014), Avdjiev, Hardy, Kalemli-Ӧzcan and Servén (2018)), and in monitoring financial stability vulnerabilities.
The BIS international banking statistics (IBS) have been enhanced to better capture banks' positions with particular counterparty sectors. Since the fourth quarter of 2013, banks have separately reported their positions with non-bank financial institutions. With this Quarterly Review, more detail is now published for their positons with non-financial counterparties (ie governments, non-financial corporations and households).
The IBS are collected on both a locational and a consolidated basis (see Box A for definitions of terms commonly used in the IBS). The two perspectives complement each other and, together with the new counterparty sector breakdowns, offer a more comprehensive view of banks' global balance sheet positions and linkages with non-bank counterparties. These new sectoral breakdowns enable analysis and monitoring previously impeded by lack of data (Cerutti et al (2014)).
Key takeaways
- The BIS now publishes a more detailed breakdown of counterparty sectors in its international banking statistics.
- Banks' claims on and liabilities to non-bank financial institutions, especially those located in financial centres, have increased in recent years.
- Banks' cross-border liabilities to households largely reflect cross-border deposits by nationals living abroad.
The first section below is an overview of the sectoral breakdowns in the statistics and the coverage of the new data. Coverage of the breakdowns varies by data set, reporting banking system and counterparty country and sector. For example, virtually all reporting banks break out their positions with non- bank financial institutions. Thus, when aggregated across reporting banks, the sectoral coverage is excellent for nearly all counterparty countries and for the global total. By contrast, fewer reporting banking systems break out their positions with the non-financial subsectors, resulting in imperfect coverage of these sectors for some counterparty countries and for the global total.
Further reading
The following sections review the data for each sector from a variety of angles to illustrate how the data can be used and to establish some stylised facts. We use the consolidated banking statistics (CBS) and locational banking statistics (LBS) in combination to analyse patterns from the perspective of both reporting banks and counterparty countries.
We show that banks' exposures to non-bank financial institutions (NBFIs) have trended upwards in recent years, particularly to those NBFIs located in a few key financial centres. At the same time, NBFIs have become important sources of cross-border funding for banks, particularly in international currencies.
The feature also shows that banks' balance sheet linkages to non-financial counterparties (ie non-financial firms, households and governments) are likewise concentrated in particular countries or regions. Banks' exposures to non-financial corporations (NFCs) and, even more so, governments are primarily to those in the large advanced countries. Their exposures to NFCs in offshore centres are also significant, reflecting, for example, credit to the financing arms of multinational corporations located there. Across all of the sectors and breakdowns, international banking is highly geographically concentrated.2
Finally, banks' positions with households are less international compared with other non-financial sectors. They tend to be locally booked (ie not cross-border), and are generally denominated in the local currency. While cross-border claims on households are relatively small, cross-border liabilities to this sector made up 14% of banks' cross-border liabilities to all non-bank counterparties at end-March 2019. Non-resident nationals making deposits in banks back home drive many of the patterns observed in the data.
Box A
Terms commonly used in the BIS international banking statistics
The glossary on the BIS website offers definitions of technical terms used in the locational banking statistics (LBS) and consolidated banking statistics (CBS). Selected terms are defined below.
Country - Territorial entity for which data are separately and independently maintained, including, but not limited to, national states as understood by international law and practice. A list of country abbreviations used in the graphs can be found on page iv in this issue.
Counterparty - Entity that takes the opposite side of a financial contract - for example, the borrower in a loan contract or the buyer in a sales transaction. The counterparty country is the country where the counterparty resides.
Reporting bank - Financial institution that participates in the compilation of the LBS or CBS.
Immediate counterparty basis - Methodology whereby positions are allocated to the primary party to a contract. In the CBS, claims on an immediate counterparty basis are allocated to the country and sector of the entity to which the funds were lent.
Ultimate risk basis - Methodology whereby positions are allocated to a third party that has contracted to assume the debts or obligations of the primary party if that party fails to perform. In the CBS, claims on an ultimate risk basis are allocated to the country and sector of the entity that guarantees the claims (or, in the case of claims on branches, the country of the parent bank).
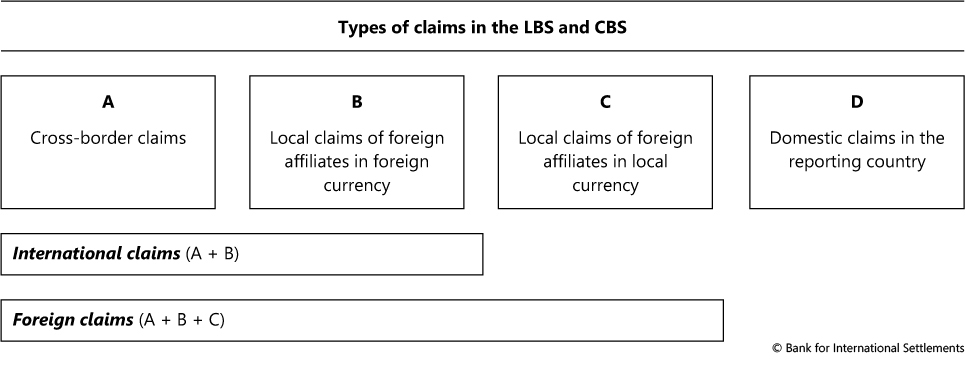
Claim - A financial asset that has a counterpart liability. In the CBS, claims exclude financial derivatives. The different types of claims in the banking statistics are summarised below.
Cross-border position - Position on a non-resident - for example, claim on or liability to a counterparty located in a country other than the country where the banking office that books the position is located.
Local position - Claim on or liability to a counterparty located in the same country as the banking office that books the position. Opposite of a cross-border position.
International claim - Claim on a non-resident or denominated in a foreign currency. International claims comprise cross-border claims in any currency plus local claims of foreign affiliates denominated in non-local currencies.
Foreign claim - Claim on residents of countries other than the country where the controlling parent is located, ie a claim of a domestic bank on non-residents of the reporting country. Foreign claims comprise local claims of the bank's offices abroad as well as cross-border claims of the bank's offices worldwide.
Domestic claim - Claim of a domestic bank on residents of the bank's home country. Domestic claims comprise local claims of the bank's offices in the country as well as cross-border claims of the bank's offices abroad.
Introducing a breakdown of non-bank counterparties
Historically, banks' positions in both the CBS and the LBS were split into bank and non-bank counterparties, but each data set offered unique details for particular sectors (Graph 1, blue boxes). The CBS, with their focus on country risk, provided more detail on banks' exposures to non-banks by separately reporting those to the official sector (government plus central bank) and those to the non-bank private sector. The LBS, with their focus on the evolution of the eurodollar market, put more emphasis on bank counterparties, and thus distinguished between central banks, unrelated banks and own offices.
This historical sectoral breakdown constrained the types of analysis that could be performed, and the 2007-09 financial crisis highlighted these gaps in the statistics. In 2012, the Committee on the Global Financial System (CGFS) endorsed enhancements to the BIS international banking statistics (CGFS (2012)), including greater detail on non-bank counterparties, especially a breakout of non-bank financial institutions and the non-financial sector (Graph 1, yellow boxes). The counterparty sector enhancements applied equally to the LBS and CBS, improving the consistency of sector details.3
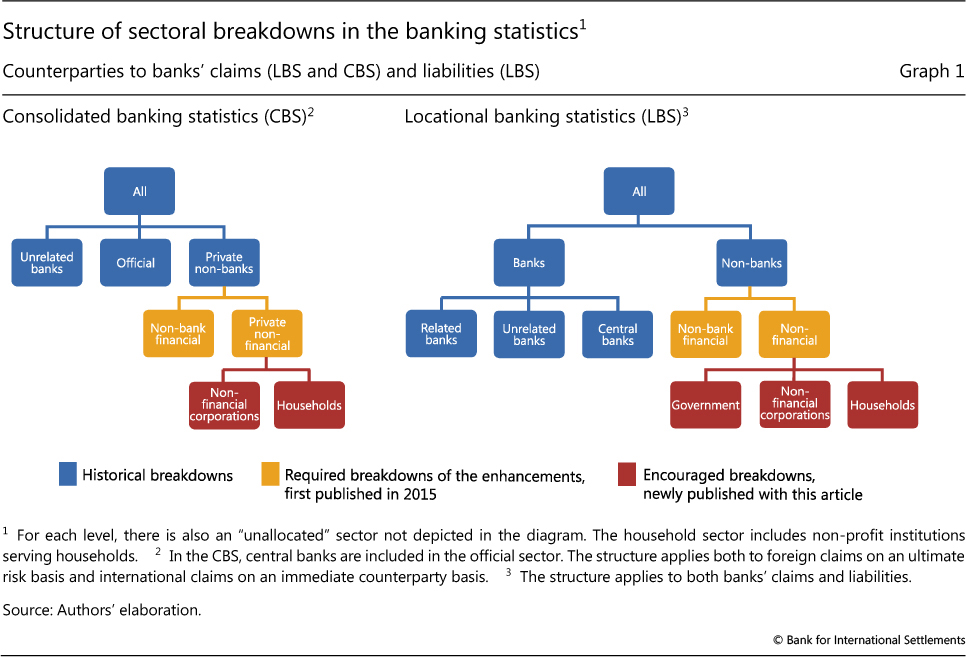
Because of their size and importance, banks' positions with non-bank financial institutions - securities brokers, central counterparties, investment funds, hedge funds, special purpose vehicles and other non-bank financial entities - were given priority in the data collection over the other non-bank sector positions. The split of non-banks into non-bank financials and non-financials was first published in 2015. However, the separate reporting of positions with non-financial subsectors (corporations and households and, for the LBS, also government) was encouraged but not required (Graph 1, red boxes), and thus not all reporting countries provide this information. When working with these breakdowns, especially the encouraged breakdowns published for the first time with this feature, it is important to be mindful of the reporting coverage (Table 1).
Both the LBS and the CBS can be analysed either from the perspective of reporting banks or from the perspective of counterparty countries. For example, from the perspective of reporting banks, we can show that 34% of US banks' consolidated claims (CBS) are on NBFIs. Aggregating across all reporting banks' claims on an individual counterparty country shows the latter perspective, and reveals, for example, that 77% of banks' consolidated claims (CBS) on borrowers in the Cayman Islands are on NBFIs.
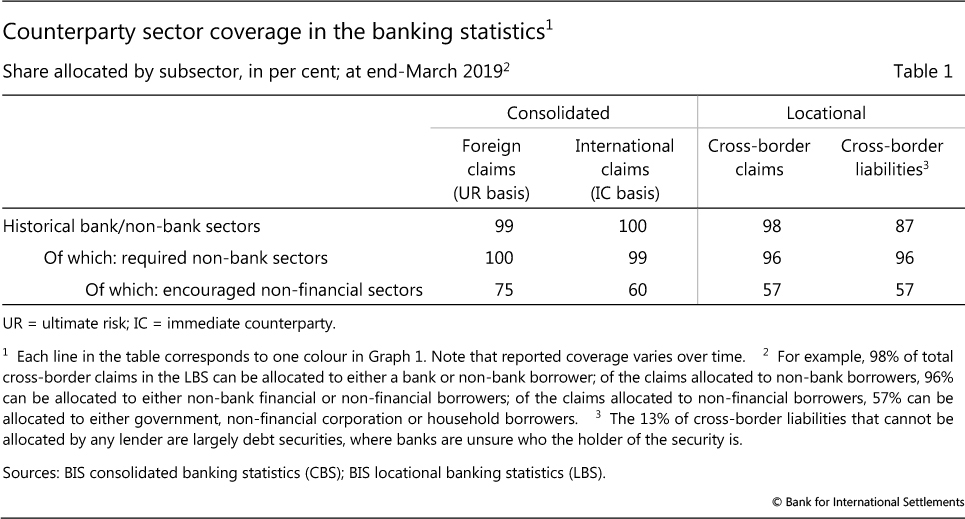
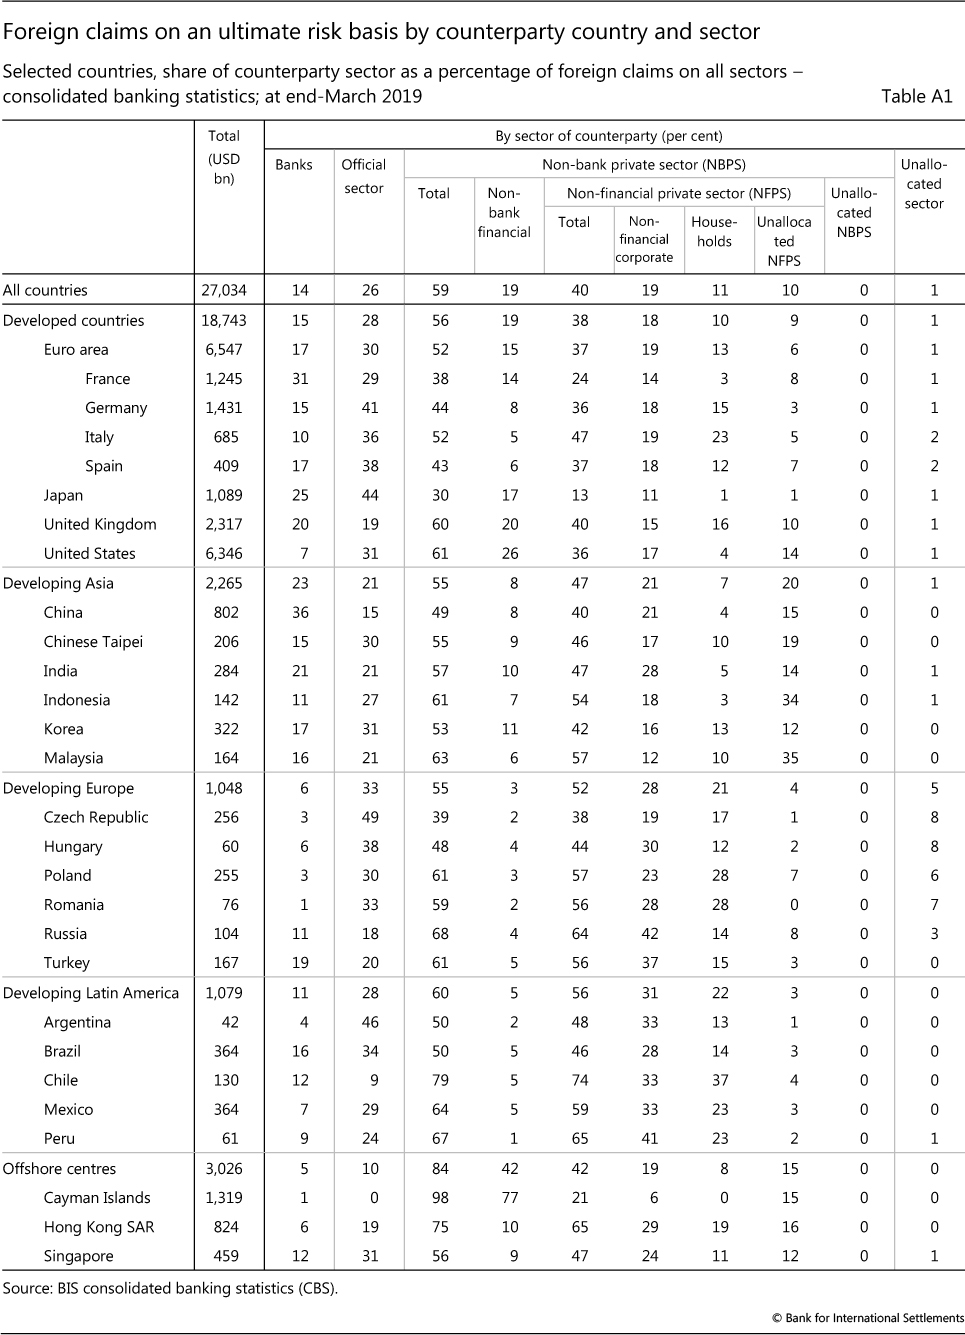
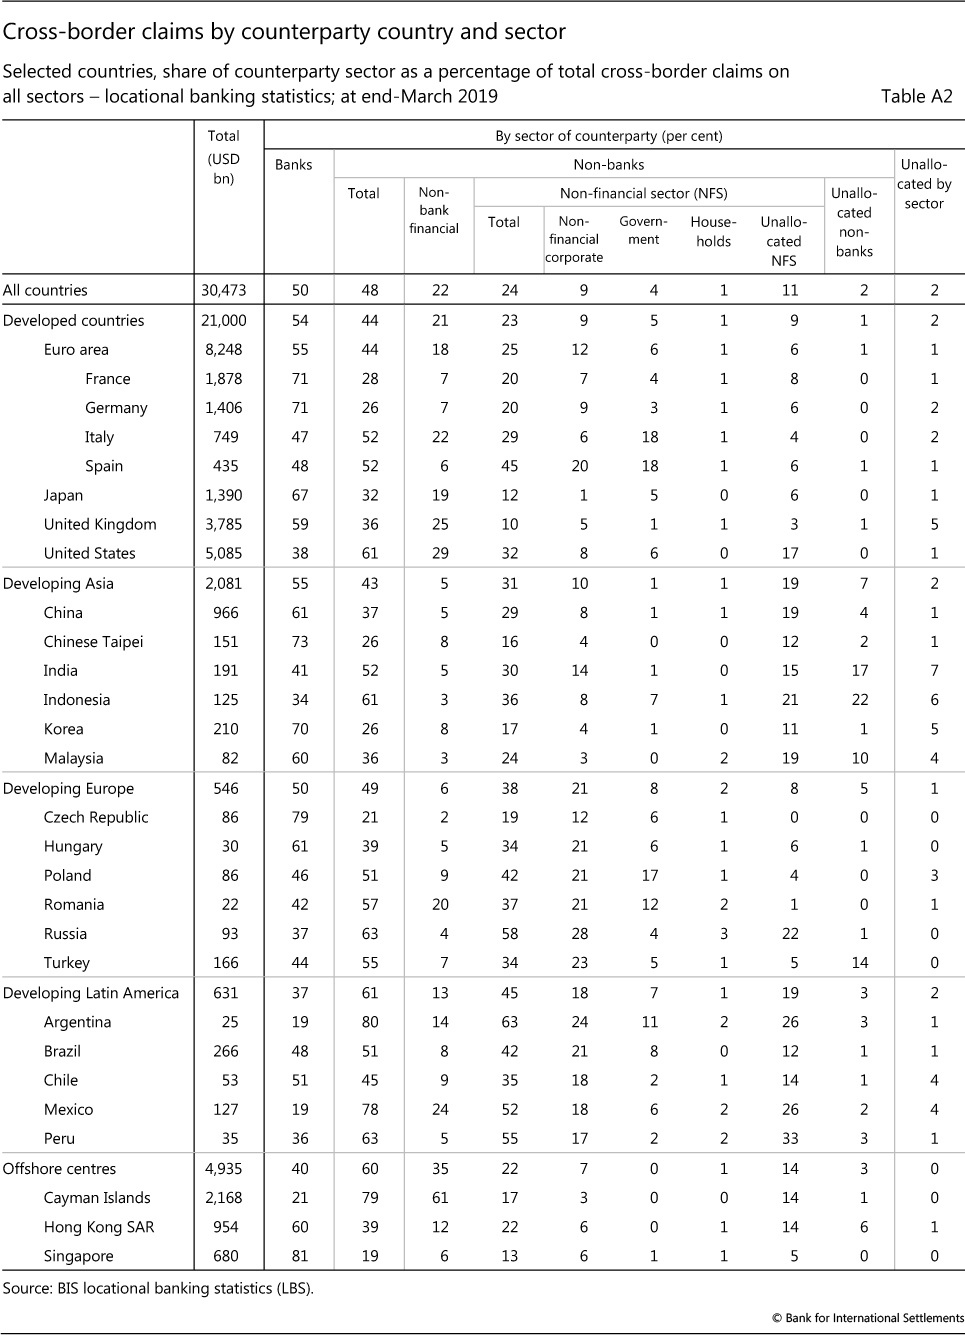
Annex Tables 1 and 2 help to give a sense of the data coverage and the size of the new sector breakouts. They take the perspective of counterparty countries, and show the complete sectoral composition of all reporting banks' foreign claims (CBS; Annex Table 1) and their cross-border claims (LBS; Annex Table 2) on individual counterparty countries. Column 1 lists banks' combined total claims on the country, and the remaining columns show the share of these claims on each sector, including claims that are unallocated by sector. For most counterparty countries, banks' claims on non-banks are almost completely allocated to either the non-bank financial or the non-financial sectors (in both the CBS and the LBS). But the share of banks' claims allocated to the non-financial subsectors varies considerably by counterparty country. For some countries, eg Italy and the Czech Republic, coverage is excellent, in the sense that a relatively small share of the total claims on the non-financial sector (column 6 in Annex Table 1, column 5 in Annex Table 2) is left unallocated to a specific subsector (column 9 in both tables). For others, eg Malaysia and Indonesia, coverage is relatively poor.
As noted above, the LBS and CBS historically emphasised different sectors. Using these data sets in combination yields a more complete sectoral breakdown for several counterparty countries than either data set provides in isolation. For example, as shown in Box B, the CBS, which have near complete coverage of the official sector, can be used to allocate a portion of the unallocated cross-border claims in the LBS. This exercise provides a more representative sectoral breakdown for the global total and shows that, for some countries, the reported LBS data alone do not provide accurate sectoral shares. In what follows, we make use of the data as reported in the CBS and LBS in order to take advantage of the unique dimensionality each data set has to offer (eg instrument and currency breakdowns in the LBS). But we highlight those areas where coverage is poor and caution is thus warranted.
Non-bank financial institutions
Banks' claims on and liabilities to non-bank financial institutions (NBFIs) have been growing in recent years. On a locational basis, banks' cross- border claims on NBFIs increased from 30% of their total claims at end-March 2016 to 35% at end-March 2019 (Graph 2, left-hand panel), or from $4.8 trillion to $6.6 trillion. On a consolidated basis, the share of their foreign claims on NBFIs rose from 18% to 20% during the same period.
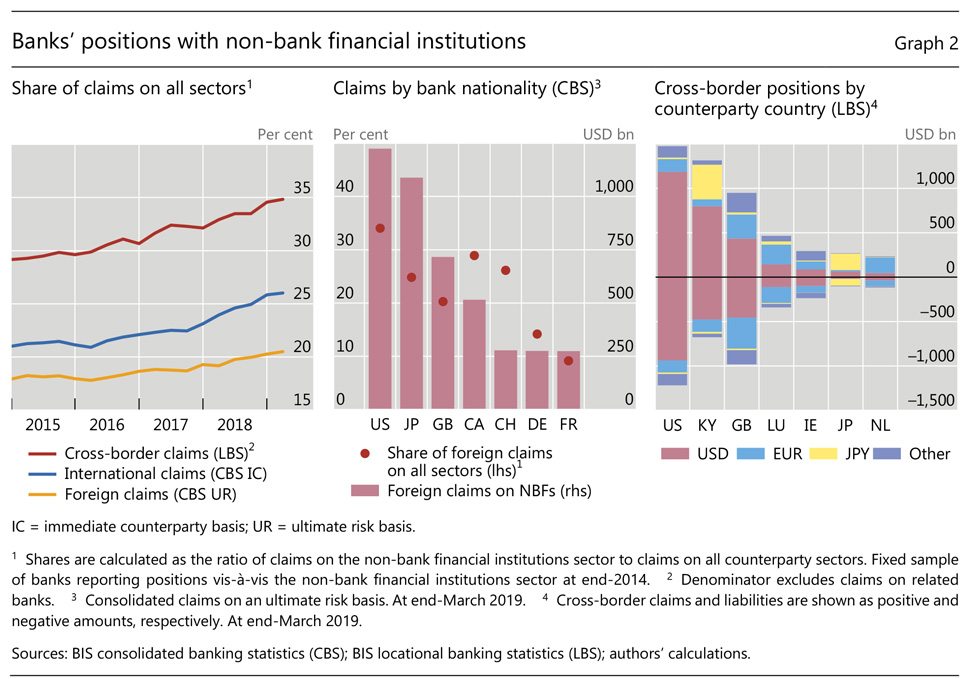
On a consolidated basis, just four banking systems - those headquartered in the United States, Japan, the United Kingdom and Canada - accounted for the bulk (70%) of all banks' total foreign claims on NBFIs at end-March 2019 (Graph 2, centre panel).
Box B
Expanding coverage of non-financial sectors in the locational banking statistics
In the LBS, a significant share (43%) of banks' cross-border claims on the non-financial sector cannot be broken down by subsector. This is because not all reporting banks provide the complete sector split. Reporting countries that do not provide this split host the main creditor banks for some individual counterparty countries. Thus, for these counterparty countries the sector shares derived by aggregating across all creditor banks are incomplete (Annex Table 2). Combining the CBS and the LBS can improve the sectoral breakdown for cross-border claims on some of these countries and indicate whether the sectoral composition in the reported data is representative of total cross-border claims on the country. However, this expanded sector decomposition is limited to total cross-border claims as the CBS do not include breakdowns by currency or instrument, and have limited data on bank liabilities.
The CBS break down international claims on non-banks into those on the official sector and those on the private non-financial sector. The LBS indicate that cross-border claims on central banks and households are relatively small. Thus the breakdown in the CBS corresponds mostly to claims on governments and on NFCs, respectively. Using non-public LBS data by nationality, it is possible to isolate consolidated cross-border claims booked by banks' home offices and compare them with the corresponding LBS amounts. When the two measures are sufficiently close, the CBS (non-bank subsector) shares can be applied to the corresponding LBS amounts.
Even when the match between CBS and LBS is not perfect, international claims are often overwhelmingly with only one non-financial subsector. In such cases, unallocated cross-border claims can be assigned to that sector. For example, the CBS data show small or no amounts of international claims on the official sector for many counterparty countries. As a result, the unallocated claims on those countries can be attributed to NFCs. These countries are either large offshore centres (eg Bermuda, the Cayman Islands) or developing economies (eg Bahrain, Ethiopia).
Applying the method above, the share of global cross-border claims with a non-financial subsector breakdown increases from 57% to 87%. This includes large expansions in coverage for positions with both NFCs and governments (Graph B, left-hand panel). The increase is mainly due to enhanced sectoral breakdowns of banks' positions vis-à-vis developed countries such as the United States, France and the United Kingdom (centre panel). Coverage for major emerging market economies also improves, but remains incomplete for several countries, including China, Brazil and Russia (right-hand panel).
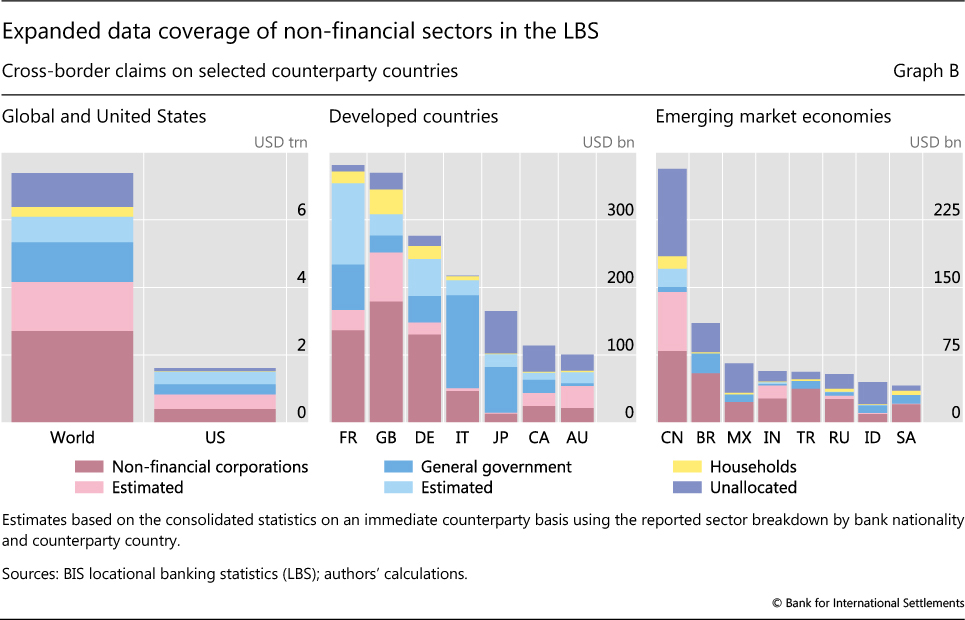
This exercise shows that it would not be accurate to apply the shares from the reported data in the LBS to the unallocated portions to obtain the full sectoral breakdown. For instance, the estimates using the above methodology have a substantially higher government share for some countries (eg France, 50% instead of 30%), but lower shares for others (eg Canada, 39% instead of 42%). Although this exercise was done with non-public data, a rough approximation of the unallocated sector split can be obtained using publicly available data on the international claims on the official sector and the private non- financial sector (CBS) and applying the shares to the unallocated cross-border claims (LBS) for each reporting country.
And for each of these banking systems, claims on NBFIs were a significant share (over 20%) of their total foreign claims on all sectors. For US banks, the largest creditors to this sector, a full third of their foreign claims were on NBFIs, while 25% of Japanese banks' and 20% of UK banks' claims were.
NBFI counterparties tend to be concentrated in just a few countries. From the LBS, the top seven countries accounted for 75% of reporting banks' combined cross-border claims and liabilities to NBFIs (Graph 2, right-hand panel; see also Annex Table 2). Positions vis-à-vis NBFIs in the US, the Cayman Islands and the UK were primarily denominated in US dollars, while those with NBFIs in Luxembourg and the Netherlands were mainly denominated in euros. Claims denominated in yen were a significant component of claims on Japan and the Cayman Islands.4
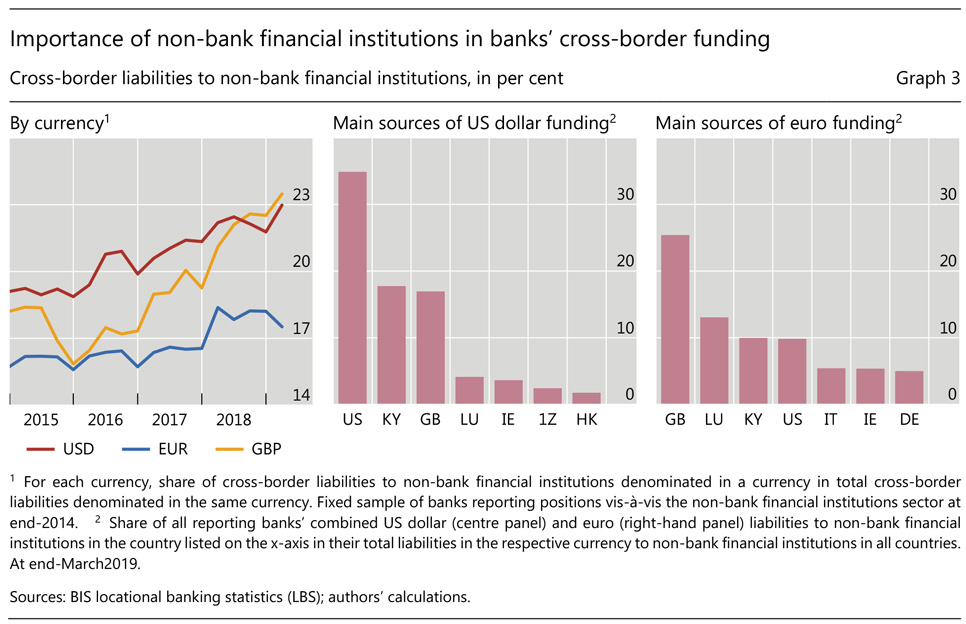
Banks have been increasingly turning to NBFIs for funding in international currencies (LBS; Graph 3, left-hand panel). The share of their cross-border US dollar, euro and sterling liabilities to NBFIs has increased over the past four years. Banks' dollar liabilities to NBFIs were heavily concentrated in those located in three countries - the US, the Cayman Islands and the UK - which accounted for close to 70% of their total dollar liabilities to all NBFIs at end-March 2019 (centre panel).5 While banks' euro liabilities to NBFIs were less concentrated (right-hand panel), those located in four countries (the UK, Luxembourg, Italy and the US) accounted for roughly 60%. Thus, banks' funding in major international currencies could be significantly affected by the behaviour of NBFIs in just a few key locations.
Non-financial sectors
Data that shed light on international banks' claims on and liabilities to non-financial counterparties are essential for analysing the impact of international finance on the real economy.6 Banks are the primary providers of funds to the non-financial sector and their cross-border credit can be fickle (Ehlers and McGuire (2017)), amplifying domestic credit booms and exacerbating busts (Borio et al (2011)). The new non-financial subsectoral breakdowns can illuminate banks' exposures to these sectors as well as the direct cross-border credit they provide.
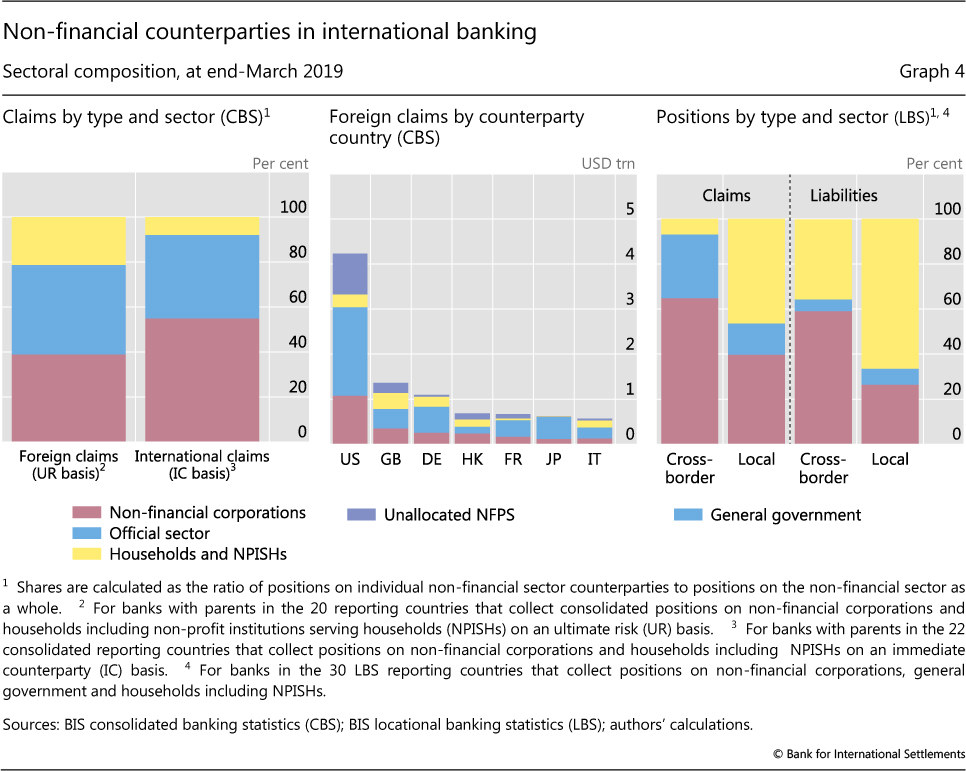
Banks' most significant non-financial counterparties are non-financial corporations (NFCs) and governments. They accounted for roughly 40% each of banks' foreign claims (CBS) on the non-financial sector at end-March 2019 (Graph 4, left-hand panel).7 By counterparty country, claims were largest on these subsectors in the large advanced economies, eg the United States (72%), Germany (76%) and Japan (97%) (centre panel).8
Banks' exposures to the household sector typically capture mortgage lending, which usually is done locally. In the CBS, 21% of banks' foreign claims were on households at end-March 2019, while only 8% of their international claims were. This indicates that the bulk of banks' lending to foreign households is in the form of local currency claims extended by the banks' foreign affiliates in the respective country. Data from the LBS confirm this, as claims on households represent a small share of cross-border claims on the non-financial sector, but a large share of local claims (Graph 4, right-hand panel).
Households are also an important funding source for banks. They are net creditors to banks in terms of both local and cross-border positions. However, less attention has been paid to households' cross-border deposits with banks. Cross-border deposits in our statistics are largely explained by non-resident nationals making deposits with banks back home (Box C). Our statistics can thus be combined with other data to help better distinguish cross-border household assets that reflect remittances and cross-border employment from those related to tax evasion (Alstadsæter et al (2018), Zucman (2013)). The new subsectoral breakdowns thus provide fresh insights into financial inclusion and development and the role of banks in households' cross- border financial activities.
Non-financial corporations
As with other aspects of the international banking statistics, claims on NFCs are highly concentrated. Among the consolidated banking systems that report this breakdown, French banks had the largest credit exposure to NFCs at end-March 2019 (in the CBS; Graph 5, left-hand panel), with the top three banking systems accounting for 44% of total claims on the sector. The importance of NFC exposures varies by banking system: 31% of Italian banks' foreign claims and 29% of French banks' foreign claims were on NFCs, but only 19% of US banks' foreign claims were.
Box C
Households' cross-border deposits
During the last few years, households' cross-border assets have received increased attention. Most of the research and discussion has revolved around the hidden wealth in offshore financial centres (Alstadsæter et al (2018), Zucman (2013)). The newly available data on cross-border bank positions vis-à- vis households in the locational banking statistics (LBS) offer additional insight into the nature of households' cross-border deposits. They can be combined with immigration statistics to help identify cross-border deposits linked to non-resident nationals making deposits with banks back home.
Households (including non-profit institutions serving households) have a limited presence in banks' international operations. At end-March 2019, they accounted for only 4% of BIS reporting banks' cross-border claims on non-banks and 14% of banks' cross-border liabilities to non-banks. Banks in Switzerland are an exception: foreign households accounted for 20% of their cross-border claims on non-banks and 51% of their cross-border liabilities to non-banks. Banks in Switzerland were the largest recipients of cross-border household deposits ($227 billion as of end-March 2019), accounting for 30% of the reported total (LBS).
A significant share of households' cross-border deposits are placed in banks located in emerging market economies (EMEs), largely denominated in the domestic currency of the respective EME. Foreign households also have deposits in countries with relatively high tax rates (eg Austria, Denmark, France, Sweden). With the newly available statistics (including unpublished bilateral data), we examine how the location of non-resident nationals can explain the geographical distribution of households' cross-border deposits with banks.
Deposits from households are strongly correlated with migrant numbers (Graph C, left-hand panel). For each bank location, we estimate the relationship between the number of non-resident nationals in a given destination country and the corresponding stock of cross-border household deposits from that country (right-hand panel). Results show that, for most countries, immigration patterns can explain the geographical distribution of cross-border deposits from households. The estimated coefficients are highly significant, and can be interpreted as the amount of deposits per non-resident national living abroad deposited with banks back home. Estimates range from around $4,000 for Portuguese nationals living abroad to around $20,000 for non-resident French nationals.
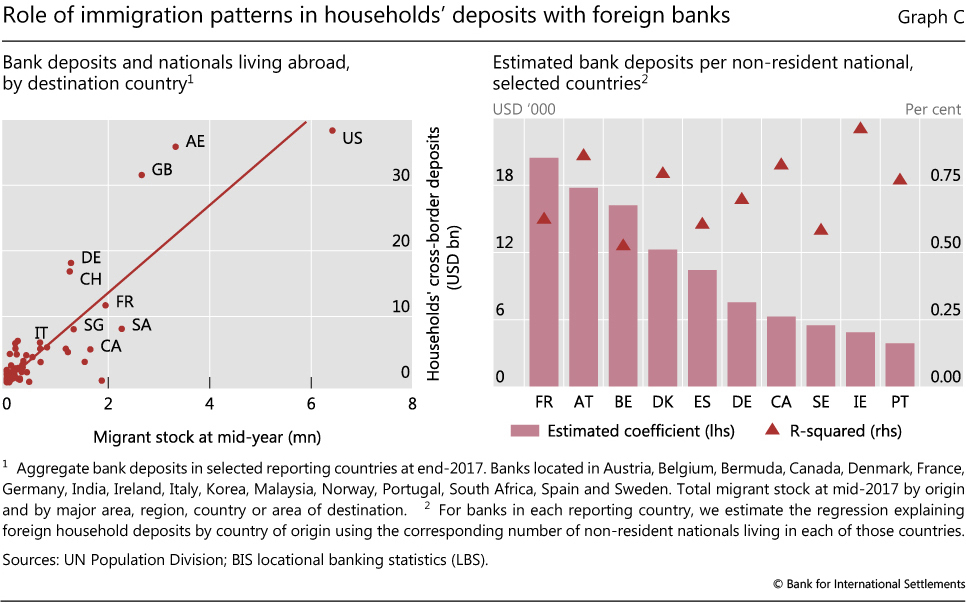
Figure computed for the sample of 31 countries that report the encouraged non-financial sector breakdowns for banks' domestic positions in the LBS.
Banks' cross-border claims (LBS) on NFCs were primarily on those located in advanced economies (Graph 5, centre panel). The bulk of banks' US dollar claims and liabilities were on non-financial firms in the US. Their euro positions, on the other hand, were mainly on those in Luxembourg, the Netherlands, France and Germany.9
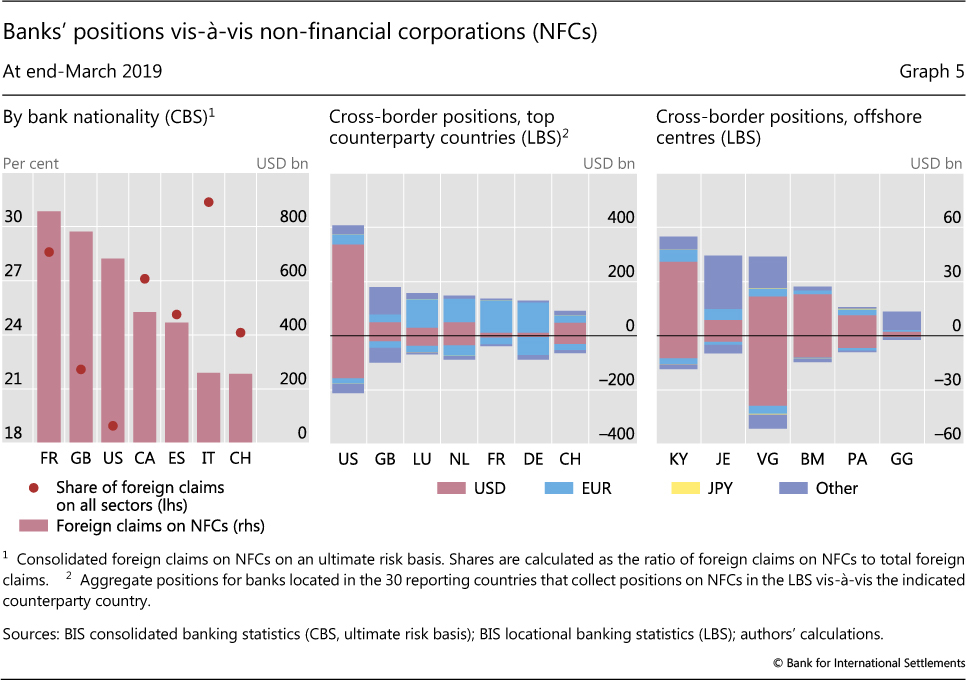
Offshore financial centres are known to host banks and non-bank financial entities; however, banks' cross-border positions with NFCs in those locations are also large (LBS; Graph 5, right-hand panel). This reflects the fact that NFCs' financial activities can span national borders; indeed, corporates regularly set up entities in these centres for the purpose of raising funds (Avdjiev et al (2016) and Avdjiev, Everett, Lane and Shin (2018)). For instance, banks' claims on NFCs in the Cayman Islands were larger than on those in Italy, an advanced economy where data coverage is good. Claims on NFCs in the Cayman Islands are probably substantially larger, as 85% of end-March 2019 claims on non-financial borrowers there are unallocated by subsector, and borrowing by households and government is likely to be small. Banks also had large claims on NFCs in Jersey and the British Virgin Islands.10 These data complement statistics that show an increase in foreign direct investment positions with financial centres, which capture when NFCs in offshore centres transfer the capital raised there to related affiliates elsewhere (Lane and Milesi-Ferretti (2017)).
Government
Government debt is a central element of banks' balance sheets. At end-March 2019, 26% of banks' consolidated foreign claims (CBS) were on official counterparties (including the central bank).11 Japanese, UK, US and French banks reported the largest exposures to the official sector (Graph 6, left-hand panel). For those bank nationalities, the share of the official sector in total credit exposure ranged from a quarter to a third.
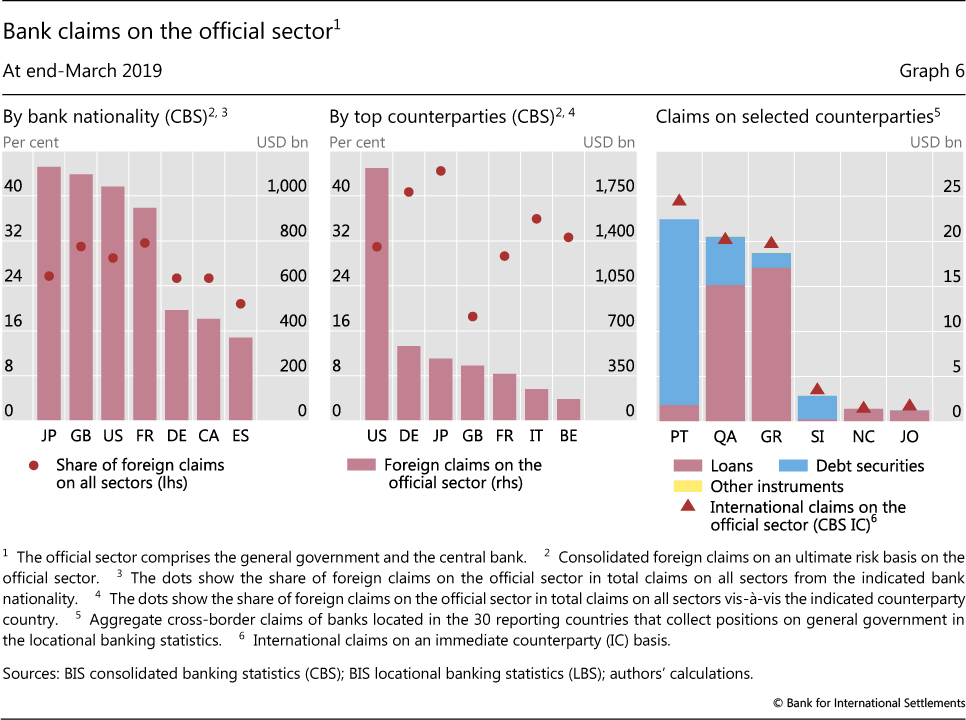
The largest counterparty countries for claims on the official sector tend to be advanced economies. Governments in these countries supply large amounts of debt, and some central banks have implemented quantitative easing programmes, which have boosted banks' holdings of reserves at central banks (Graph 6, centre panel; see also McCauley and McGuire (2014)).12 Claims on the official sector are almost entirely denominated in the issuing country's currency. For example, the largest claims on the official sector are on the United States, all in US dollars. The official sector constitutes 30-40% of all consolidated claims on the US, Germany and Japan (see Annex Table 1 for others).
While the CBS provide no details on the instrument or currency composition of international claims on the official sector, the new government breakdown in the LBS makes it possible to infer these splits when cross-border claims (LBS) match well with international claims (CBS) (Graph 6, right-hand panel).13 Most claims on government were in the form of debt securities (79% of all cross-border claims for which there is a breakout of claims on government at end-March 2019 (LBS)).14 For example, in the case of Portugal and Slovenia, debt securities made up nearly all of the cross-border bank claims on the government. However, loans represented a large share of cross-border claims on some countries (Qatar, Greece, New Caledonia and Jordan). For these countries, claims from banks may follow different dynamics than for countries where all the claims are in the form of securities.
Conclusion
The newly released data on counterparty sectors in the BIS international banking statistics provide a novel and interesting perspective on international banking and the balance sheet exposures and linkages banks have with non-bank counterparties.
Non-bank financial institutions (NBFIs) are increasingly integrated into the funding and lending patterns of international banks. Banks source more and more of their funding in international currencies from NBFIs. This sector is also a growing counterparty for bank lending. Banks' positions with NBFIs are concentrated in few countries, particularly financial centres.
Banks have substantial credit exposure to foreign governments and non-financial corporations, particularly those located in advanced economies. Offshore financial centres also play an important role for non-financial corporations. Exposures to households are concentrated in local positions in local currencies. Households' cross-border deposits can be important, however, and are determined in part by non-resident nationals placing deposits with banks in their home country. Claims and liabilities are highly geographically concentrated in international banking, including for individual subsectors of the counterparties and further breakdowns.
These data will be broadly useful to researchers and policymakers to better understand and address questions relating to international finance and financial stability.
References
Aldasoro, I and T Ehlers (2018): "The geography of dollar funding of non-US banks", BIS Quarterly Review, December, pp 15-26.
----- (2019): "Concentration in cross-border banking", BIS Quarterly Review, June, pp 1-11.
Alfaro, L, Ș Kalemli-Özcan and V Volosovych (2014): "Sovereigns, upstream capital flows, and global imbalances", Journal of the European Economic Association, vol 12, no 5, pp 1240-84.
Alstadsæter, A, N Johannesen and G Zucman (2018): "Who owns the wealth in tax havens? Macro evidence and implications for global inequality", Journal of Public Economics, vol 162, pp 89-100.
Avdjiev, S, M Everett, P Lane and H S Shin (2018): "Tracking the international footprints of global firms", BIS Quarterly Review, March, pp 47-66.
Avdjiev, S, B Hardy, Ș Kalemli-Özcan and L Servén (2018): "Gross capital flows by banks, corporates and sovereigns", BIS Working Papers, no 760. Also published as NBER Working Paper, no 23116.
Avdjiev, S, R McCauley and H S Shin (2016): "Breaking free of the triple coincidence in international finance", Economic Policy, vol 31, no 87, pp 409-51.
Avdjiev, S, P McGuire and P Wooldridge (2015): "Enhanced data to analyse international banking", BIS Quarterly Review, September, pp 53-68.
Borio, C, R McCauley and P McGuire (2011): "Global credit and domestic credit booms", BIS Quarterly Review, September, pp 43-57.
----- (2017): "FX swaps and forwards: missing global debt?", BIS Quarterly Review, September, pp 37-54.
Cerutti, E, S Claessens and P McGuire (2014): "Systemic risk in global banking: what can available data tell us and what more data are needed?", in M Brunnermeier and A Krishnamurthy (eds), Risk topography: systemic risk and macro modelling, 2014, pp 235-60. Also published as BIS Working Papers, no 376, 2012.
Committee on the Global Financial System (2012): Improving the BIS international banking statistics, CGFS Papers, no 47, November.
Ehlers, T and P McGuire (2017): "Foreign banks and credit conditions in EMEs", BIS Papers, no 91.
Financial Stability Board-International Monetary Fund (2009): The financial crisis and information gaps, report to the G20 finance ministers and central bank Governors, Basel/Washington DC, October.
Hardy, B (2019): "Emerging markets' reliance on foreign bank credit", BIS Quarterly Review, March, pp 15-28.
Lane, P and G Milesi-Ferretti (2017): "International financial integration in the aftermath of the global financial crisis", IMF Working Papers, no WP/17/115.
McCauley, R and P McGuire (2014): "Non-US banks' claims on the Federal Reserve", BIS Quarterly Review, March, pp 89-97.
Zucman, G (2013): "The missing wealth of nations: are Europe and the US net debtors or net creditors?", Quarterly Journal of Economics, vol 128, no 3, pp 1321-64.
Annex: Claims by counterparty country and sector
Derivatives trading in OTC markets soars
Philip Wooldridge and Dora Xia
Derivatives trading in over-the-counter (OTC) markets rose even more rapidly than that on exchanges, according to the latest BIS Central Bank Triennial Survey of Foreign Exchange and Over-the-counter Derivatives Markets. The daily average turnover of interest rate and FX derivatives on markets worldwide - on exchanges and OTC - rose from $11.3 trillion in April 2016 to $18.9 trillion in April 2019. OTC trading outpaced exchange trading, continuing the trend that started around 2010 and resulting in exchanges' share falling to a historical low of 41%.
The Triennial Survey is the most comprehensive source of information on the size and structure of OTC markets. Close to 1,300 financial institutions located in 53 countries participated in the latest Survey, which was conducted in April 2019. When the results are combined with the BIS statistics on exchange-traded derivatives, they provide a global (albeit infrequent) snapshot of activity in interest rate and FX derivatives markets.
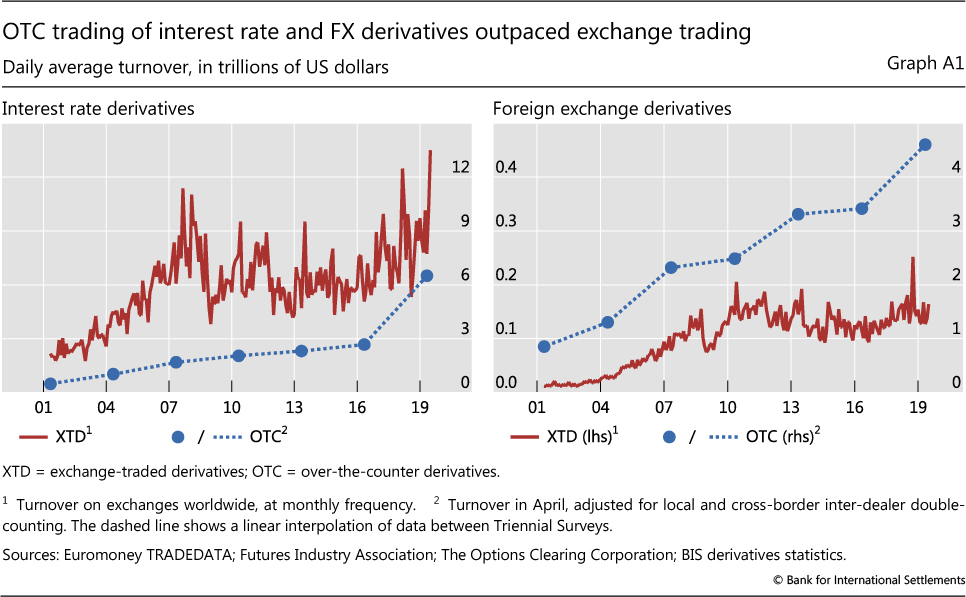
The turnover of interest rate derivatives increased markedly between April 2016 and April 2019, especially in OTC markets, where trading more than doubled from $2.7 trillion per day to $6.5 trillion (Graph A1, left-hand panel). More comprehensive reporting contributed to the increase, yet even after adjusting for this, OTC trading was still up twofold. On exchanges, trading rose by about 50% over this period from $5.1 trillion per day to $7.7 trillion. Consequently, the proportion of interest rate derivatives traded on exchanges fell from 65% in April 2016 to 54% in April 2019. As recently as 2010, this proportion had been close to 80%.
A key driver of the rapid growth in interest rate derivatives trading was changing expectations about the path of monetary policy. In the mid-2010s, a sustained period of low and stable policy rates in advanced economies had reduced hedging and positioning. US dollar activity - which accounts for the majority of trading - started to pick up in late 2016, when the US Federal Reserve embarked on a series of rate hikes, and in 2019 dollar turnover surpassed its previous highs, in the context of renewed monetary stimulus. The turnover of interest rate contracts denominated in euros, yen and other major currencies also increased substantially between 2016 and 2019.
Derivatives referencing short-term interest rates are increasingly traded OTC, though the bulk of activity in such instruments is still on exchanges, in particular for US dollar-denominated contracts. A shift in OTC trading towards short-term instruments would tend to boost turnover because such contracts need to be replaced more often. A maturity breakdown of interest rate derivatives is not collected in the Triennial Survey; nevertheless, it can be approximated from the instrument breakdown because the maturity of overnight index swaps (OIS) - which were collected for the first time in the 2019 Survey - and forward rate agreements (FRAs) is typically less than one year. The instrument breakdown suggests that in April 2019 OTC trading of derivatives on short-term interest rates probably surpassed that on long-term rates. While the share of FRAs in OTC trading has shown no trend since 2010, fluctuating around 30%, the share of OIS appears to have increased, rising above 30% in April 2019 (Graph A2).
OTC trading benefited from innovations that made OTC instruments more attractive. Historically, exchanges had the advantage of centralised trading and, through their use of central counterparties, simpler counterparty risk management. The Great Financial Crisis led to initiatives to strengthen the resilience of OTC markets, such as central clearing, trade compression and swap execution facilities. In effect, these initiatives reformed OTC markets so that they more closely resembled exchanges.
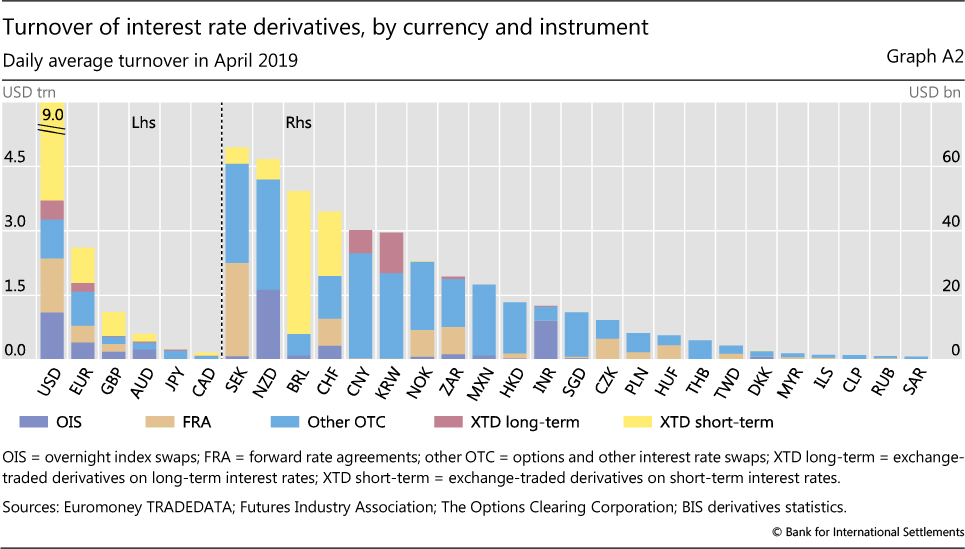
In emerging market economies (EMEs) too, the turnover of interest rate derivatives increased significantly, driven by OTC trading. For all EME currencies combined, turnover rose from $182 billion in April 2016 to $280 billion in April 2019. Whereas the turnover of listed derivatives increased by around 10%, that of OTC instruments increased by almost 75%. The most actively traded contracts were denominated in the Brazilian real ($52 billion), Chinese renminbi ($40 billion) and Korean won ($40 billion) (Graph A2). Activity denominated in EME currencies is more concentrated in a few instruments than that of major currencies. Interest rate swaps (including OIS) accounted for the largest share: over 60% of trading in most EME currencies compared with 21% for the US dollar and 35% for the euro. This is partly because there are very few actively traded futures contracts denominated in EME currencies. The real, renminbi and won are the only EME currencies where a significant share of interest rate derivatives are traded on exchanges.
The OTC trading of FX derivatives also rose substantially, according to the latest Triennial Survey. In OTC markets, the daily average turnover of FX derivatives increased from $3.4 trillion to $4.6 trillion between April 2016 and April 2019. By contrast, on exchanges it remained a mere $0.1 trillion (Graph A1, right-hand panel). In only two currencies did exchanges account for a substantial share of FX derivatives activity: the Brazilian real and Indian rupee, where exchanges accounted for 36% and 13% of turnover in April 2019, respectively. OTC markets dominate owing in large part to FX swaps, which accounted for close to 70% of FX derivatives trading. FX swaps are popular as funding instruments because they are collateralised and do not change FX exposures. Furthermore, OTC deals better serve customised demands, such as trading currency pairs not involving the US dollar. Whereas the US dollar was on one side of 99% of trades on exchanges in April 2019, its share in OTC markets was much lower at 90%.
For more about the Triennial Survey, see www.bis.org/publ/rpfx19.htm. The December 2019 BIS Quarterly Review will include several articles that analyse the results of the 2019 survey. BIS, "Triennial Central Bank Survey: OTC interest rate derivatives turnover in April 2019", statistical release, September 2019. See T Ehlers and E Eren, "The changing shape of interest rate derivatives markets", BIS Quarterly Review, December 2016, pp 53-65; and L Kreicher, R McCauley and P Wooldridge, "The bond benchmark continues to tip to swaps", BIS Quarterly Review, March 2017, pp 69-79.
1 The authors thank Stefan Avdjiev, Claudio Borio, Stijn Claessens, Wenqian Huang, Maximilian Jager, Robert McCauley, Patrick McGuire, Benoît Mojon, Swapan-Kumar Pradhan, Hyun Song Shin and Philip Wooldridge for valuable comments. The views expressed in this article are those of the authors and not necessarily those of the BIS.
2 See Aldasoro and Ehlers (2019) and Hardy (2019) for further discussions of concentration in international banking.
3 The enhancements significantly expanded the amount of data reported by banks with international operations. Other enhancements to the LBS include expanded detail on counterparty country by bank nationality, currency composition and banks' domestic business.
4 The LBS track banks' on-balance sheet positions in particular currencies. Off-balance sheet positions in particular currencies, eg FX swaps and forwards, are not captured and thus the reporting amounts may understate bank's claims and liabilities in individual currencies (Borio et al (2017)).
5 See Aldasoro and Ehlers (2018) for a discussion on US dollar liability sources for non- US banks.
6 The non-financial subsectoral breakdowns - into non-financial corporations, households and (in the case of the LBS) government - are an encouraged rather than a required reporting item. As a result, the aggregate coverage for these subsectors from the perspective of a specific counterparty country is not as complete as for higher-level sectoral breakdowns (eg non-bank financial institutions; Table 1 and Annex Tables 1 and 2). US, Japanese, Chinese and Hong Kong SAR banks are among the most important foreign creditors to the non-financial sector. However, as of September 2019, these jurisdictions do not report the non-financial subsectors (in the CBS or the LBS). See the CBS and LBS for tables that show which sectoral breakdowns are reported by which countries.
7 For banks that report the breakdown of the private non-financial subsectors in the CBS. For the full sample, the share of the official sector in total non-financial exposures remains at 40%.
8 All of the unallocated in Graph 4 is either households or non-financial corporations, as the official sector is well reported in the CBS.
9 This represents the geographical distribution of cross-border lending to NFCs only by the banks that report this breakdown. Actual claims on non-financial firms in these countries may be higher. See Annex Table 2 for coverage details by counterparty country.
10 Claims on NFCs in the Marshall Islands and Guernsey were also unusually large given the economic size of the jurisdictions.
11 Claims on the official sector include government securities used as collateral in repurchase agreements.
12 Mostly by local affiliates in local currency. Cross-border claims on central banks tend to be small.
13 The counterparty countries shown in this panel all have more than 85% of claims on the non-financial sector allocated by subsector, so the magnitudes shown are representative of cross-border claims by banks.
14 This figure will probably rise with better reporting vis-à-vis large advanced countries like the US and France, whose government debt is almost entirely in the form of debt securities (Box B).