Enhanced data to analyse international banking
The BIS international banking statistics have evolved over time in response to changes in the international financial system. The latest enhancements to these statistics introduce information about banks' domestic business and add more details about the counterparties with which banks interact. Taken together, the enhancements enrich analysis of banks' lending and funding and of their role in the transmission of shocks across countries.1
JEL classification: C820, F340.
Banks have become larger and more complex over the past 25 years, offering multiple services and products through operations spanning the globe. Some rely heavily on wholesale or non- deposit sources of funding, often from non-bank financial intermediaries about whom information is sparse. Such changes in the international financial system were not well captured in historical data (BIS (2011)). This made it hard to analyse where, in which instruments and on which side of banks' balance sheets vulnerabilities might emerge, and harder still to assess how vulnerabilities in one part of the financial system might affect other parts.
In 2012, the Committee on the Global Financial System (CGFS), which oversees the collection of the BIS international banking statistics (IBS), approved a major set of enhancements to the IBS aimed at filling long-standing data gaps and better capturing the new financial landscape (CGFS (2012)). To a large extent, the enhancements were informed by the Great Financial Crisis of 2007-09, which revealed critical gaps in the information available to monitor and respond to financial stability risks.2
The basic thrust of the enhancements is twofold. First, they expand the coverage of banks' balance sheets to include their domestic positions, not just their international activities. Second, they provide more information about the sector of banks' counterparties, in particular banks' exposures to and reliance on funding from non-bank financial counterparties. The remainder of this feature explains the enhancements in more detail and discusses a few analytical uses of the new data.
Overview of the enhancements
The IBS comprise two data sets - the locational banking statistics (LBS) and the consolidated banking statistics (CBS) - each collected using a different methodology. Jointly, they are a key source of information for assessing risks to financial stability, understanding banks' role in the transmission of shocks across borders, and monitoring changes in internationally active banks' business models.
The principal use of the LBS is to analyse capital flows between countries. They capture the positions of banking offices located in 44 reporting countries on counterparties resident in each of over 200 countries. The LBS are collected following the same principles as national accounts and balance of payments, meaning that their compilation is based on the residence of entities and the data are not adjusted for intragroup or intrasector links.
The CBS provide measures of internationally active banks' country risk exposures. In contrast to the LBS, the CBS are compiled on a nationality basis, using the consolidated approach followed by banking supervisors. The business of offices that are part of the same banking group is consolidated and reported by the country where the controlling parent entity is located.3 Table 1 summarises the breakdowns reported in each data set, and a companion piece in this Review describes the LBS and CBS in more detail.
The enhancements approved by the CGFS focused on five areas.
First, in both the LBS and the CBS, the coverage of banks' balance sheets was extended to domestic positions; previously, the data sets captured only banks' international business. In the LBS, banks are now asked to report their local positions - positions against residents of the country where they are located - in local currency, to complement the existing data on local positions in foreign currencies.4 In the CBS, since end-2013, internationally active banks have reported their worldwide consolidated claims on residents of their home country - the country where the bank's controlling parent is headquartered.
Second, in the CBS, data for the funding side of banks' consolidated balance sheets were introduced. Previously, very little liability-related information was collected in the CBS: only the local liabilities of banks' foreign affiliates, and only those denominated in local currency. Since end-2013, banks have reported their total liabilities on a consolidated basis, with a breakdown by instrument.5 They also report their total equity, selected capital measures, and total assets (comprising financial and non-financial assets).
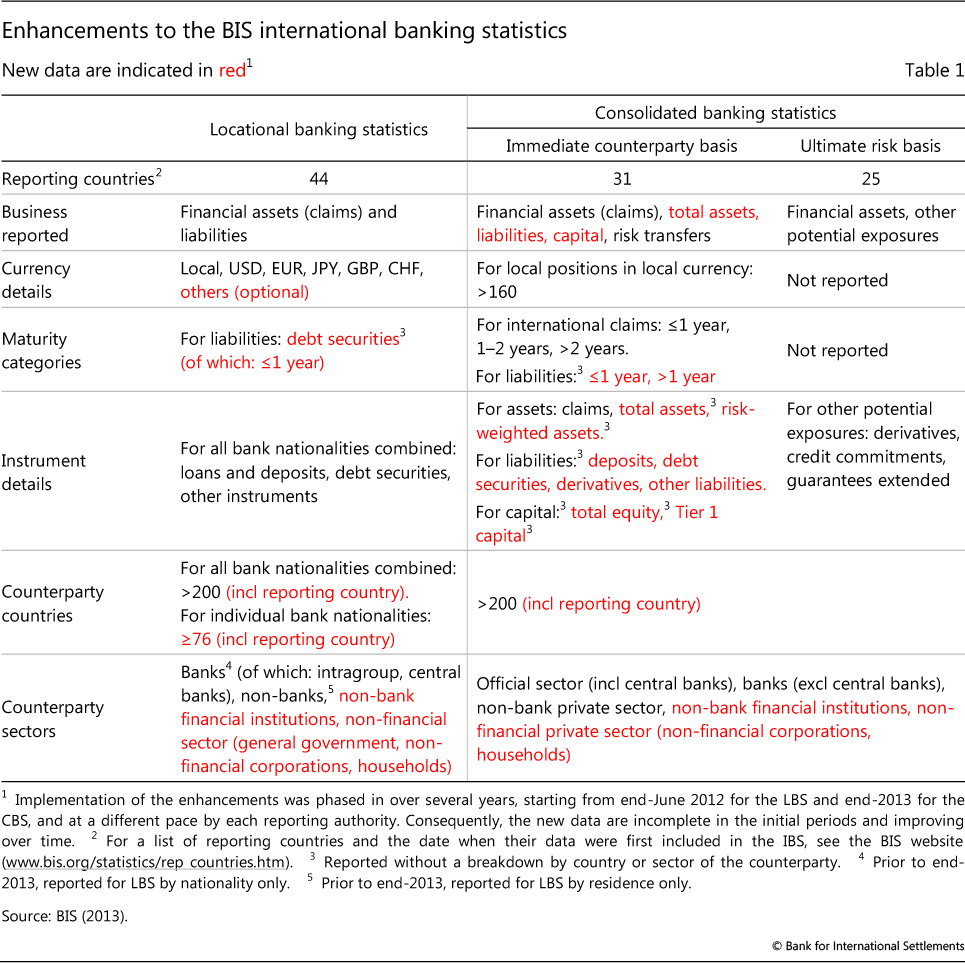
Third, in both the LBS and the CBS, the sectoral breakdown of counterparties was improved. The main improvement was to distinguish between non-bank financial counterparties and non-financial counterparties; previously, the two sectors were grouped together as non-bank entities.6 Banks are also asked to distinguish between different non-financial counterparties: non-financial corporations, households and governments. However, the reporting of the latter breakdown is encouraged, not required, and thus is incomplete (as discussed below). In the LBS, the breakdown of counterparties classified as banks was also improved. Since end-2013, banks have reported different types of bank counterparties - related banking offices (or intragroup affiliates), unrelated banks and central banks - by residence of the counterparty.7
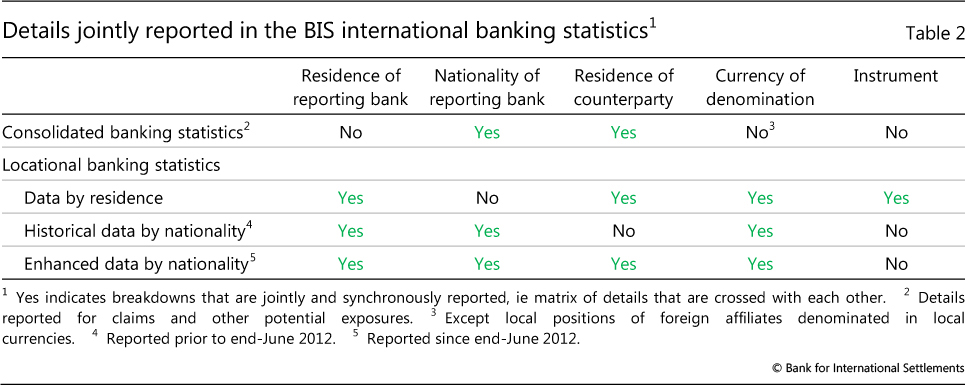
Fourth, the LBS were refined to provide more granular information by nationality of the reporting bank. In particular, since end-June 2012, four dimensions of data have been jointly reported: the residence and nationality of the reporting bank, the residence of the counterparty, and the currency in which positions are denominated. Previously, no more than three of the four dimensions were jointly reported in either the CBS or LBS (Table 2). Box 1 explains how these new data help clarify the geography of banks' operations.
The more granular information by nationality of the reporting bank is often composed of data reported by very few banks. For example, there are many banks in the United Kingdom that have claims on South Africa, and there are several Australian banks that have offices in the United Kingdom, but there may be only one or two Australian banks in the United Kingdom that have claims on South Africa. If an aggregate comprises data from only one or two banks, then its disclosure risks revealing proprietary information about those banks' activities. Consequently, reporting authorities classify a significant part of the enhanced data that they report to the BIS as confidential. Such data cannot be disclosed by the BIS, but they can serve as building blocks in the construction of published aggregates that combine data from many reporting countries.
While the enhancements made the residence and nationality of reporting banks and the residence of counterparties available simultaneously in the LBS, they did not make the distinction between data by residence and nationality redundant. In particular, the instrument breakdown - loans and deposits, debt securities and other instruments - continues to be reported only for LBS by residence (Table 2).
The enhancements also refined the IBS in a number of smaller ways. Banks reporting the LBS are now encouraged to provide an expanded currency breakdown. To complement the LBS by nationality of reporting bank, data by type of bank - branch or subsidiary - are also reported, although without a detailed counterparty country breakdown of cross- border positions. In addition, the quality of the data was improved through closer alignment of reporting practices with the guidelines. For example, authorities in some reporting countries refined sectoral or other classifications. Such methodological changes have sometimes led to significant changes in reported outstanding positions.
Finally, the BIS comprehensively revised the tables presenting the IBS so as to include data collected as part of the enhancements (Box 2). The enhancements also prompted the BIS to revisit the way in which some aggregates are calculated or presented, resulting in changes to previously published data (Box 3).
Putting banks' international business in context
The enhanced IBS provide a more comprehensive picture of the size and scope of internationally active banks' activities. This enables better analysis of the sources and uses of funds and the importance of international business for banks of different nationalities.
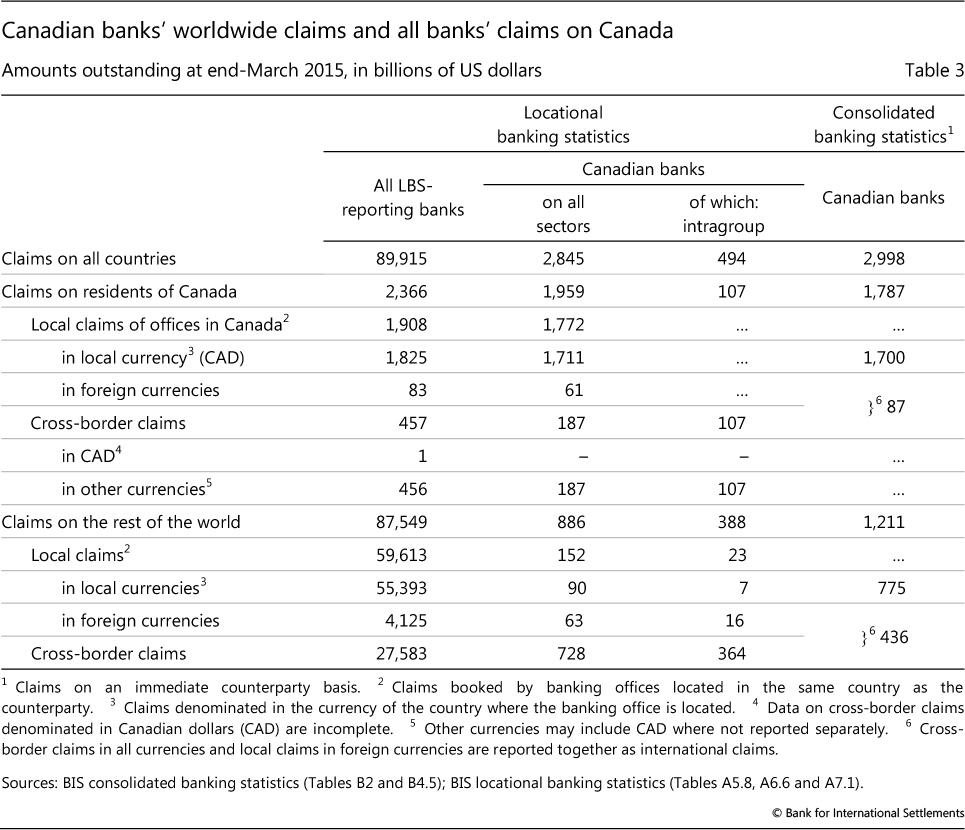
The new data on domestic positions can be used to understand the relative importance of internationally active banks in the provision of total bank credit to borrowers in a particular economy. Previously, such analysis was limited to selected components of bank credit. Table 3 illustrates the enhanced LBS using data for Canadian banks. At end-March 2015, Canadian banks accounted for less than 50% of cross-border credit to Canadian residents, whereas they accounted for over 90% of locally extended bank credit. And Canadian banks' local claims accounted for 75% of all LBS-reporting banks' total claims on Canadian residents.
Box 1
The geography of international banking
Historically, the BIS international banking statistics have provided two alternative views of the geographical composition of banks' balance sheets: in the LBS, an unconsolidated office-level view showing the counterparties of branches and subsidiaries located in a given country; and in the CBS, a consolidated group-level view showing the counterparties of banking groups' worldwide offices. The enhancements to the LBS combine these two views to show the counterparties of banking groups by the location of the groups' offices. In particular, the enhancements make it possible to see simultaneously the location of banking groups' offices, the nationality of these groups and the residence of their counterparties (Table 2). This simultaneous view supports deeper analysis of the transmission of shocks across countries through banks.
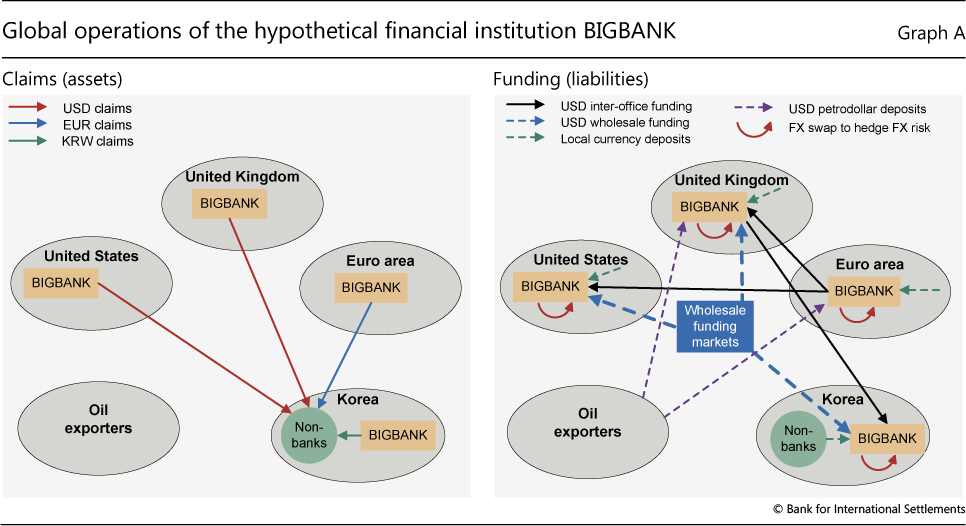
Many internationally active banks are complex organisations, with branches and subsidiaries in countries around the world and transactions in multiple currencies and instruments. Owing to this complexity, neither the office-level nor group-level view is sufficient on its own to elucidate links between sectors and countries (Fender and McGuire (2010), McCauley et al (2012)). To see why, it helps to visualise the operational structure of a hypothetical institution. BIGBANK, shown in Graph A below, represents any multinational financial institution with a large balance sheet and offices in different countries connected via intragroup funding. In this example, four different BIGBANK offices have claims in three different currencies on non-banks in Korea. In turn, BIGBANK's liabilities are a combination of euro-denominated deposits, wholesale US dollar borrowing, commercial paper issuance, petrodollar deposits and euro intragroup funds swapped for dollars. That is, across the offices, four different liability structures support the asset side of BIGBANK.
Consolidated group-level data can provide only a limited picture of the funding risks embedded in BIGBANK's global balance sheet. In such data, offices that are dollar providers to the foreign exchange swap or wholesale interbank markets are netted against those that are dollar borrowers, yielding an overall net borrowing figure for the consolidated entity. This netting implicitly assumes that resources in one location can immediately be used elsewhere - in other words, that the institution's "internal capital market" is frictionless. However, this is unlikely to be the case, given that assets would have to be liquidated and hedges unwound to free up funds - a potentially costly process during a crisis. Moreover, a host country's capital and liquidity regulations might prevent an office from adjusting its balance sheet to support affiliates elsewhere. For instance, in the case of Icelandic banks in 2008, foreign authorities restricted the transfer of affiliates' assets (Friðriksson (2009)).
As this example illustrates, to understand how shocks might propagate across sectors and borders, it is important to take into account the complexity of banks' operations. Data on the geography of banks' operations that capture office- and group-level views simultaneously can shed light on this complexity.
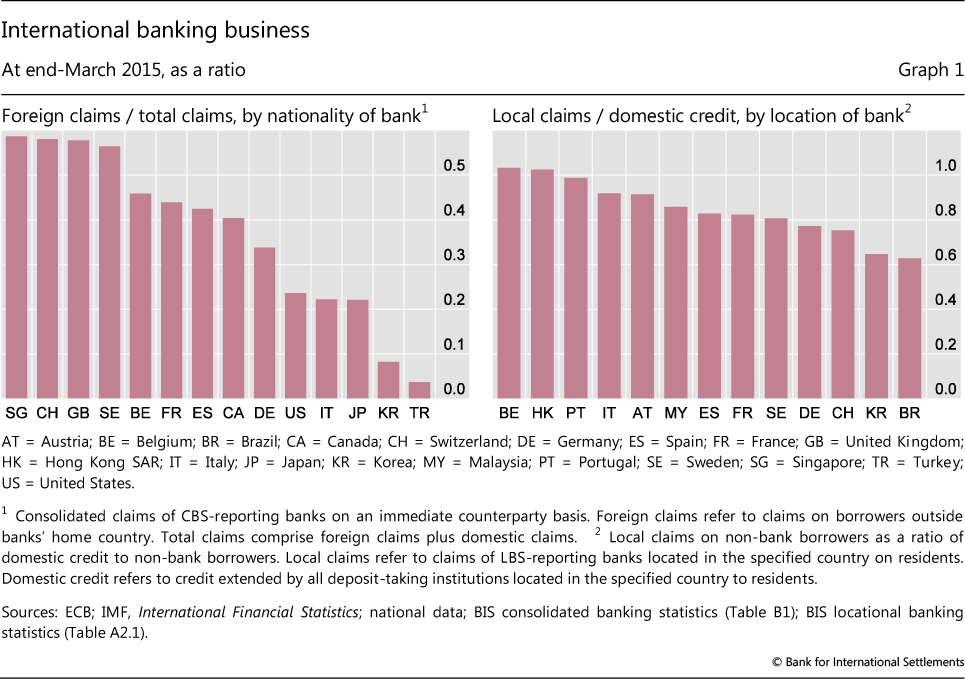
Domestic positions also help to gauge the importance of international business for banks of different nationalities. Banks with large domestic operations may be less vulnerable to economic or financial difficulties in foreign countries.8 At the same time, their portfolios may be less diversified (Buch et al (2005)). The left-hand panel of Graph 1 shows, for internationally active banks of selected nationalities, consolidated foreign claims as a share of total claims. Reporting banks headquartered in Singapore, Sweden, Switzerland and the United Kingdom stand out as having internationally oriented balance sheets, with foreign claims accounting for more than half of their total claims at end-March 2015. By contrast, Italian, Japanese and US banks were more domestically oriented, with foreign claims accounting for less than 25% of their worldwide claims.
When using the data on domestic positions, several caveats should be kept in mind. First, LBS- and CBS-reporting banks are a subset of all banks. The LBS and CBS are reported by internationally active banks, ie those with significant foreign currency or cross-border business. Banks with negligible international business may have sizeable domestic positions. Thus the assets and liabilities of LBS- and CBS-reporting banks may understate those for the population of banks in a given country or of a given nationality. Also, definitions and balance sheet coverage in the IBS might differ from those applied in other data sets, such as national monetary and financial statistics (MFS).
Box 2
New tables on the international banking statistics
The BIS comprehensively revised the tables on the international banking statistics. The new tables include more data, notably new data collected as part of the enhancements to the locational banking statistics (LBS) and the consolidated banking statistics (CBS), and present these data in a more user-friendly way. In particular, the BIS introduced country tables that bring together in one table data for banks' positions on a given country that were previously spread across several tables.
The new tables on the LBS are published in Section A of the BIS Statistical Bulletin, and those on the CBS in Section B. Each section starts with global tables that summarise the data, followed by country tables with more details. While the country tables in the PDF version of the Bulletin show only selected countries, tables covering additional countries are available on the BIS website (www.bis.org/statistics/bankstats.htm) or in the new BIS Statistics Explorer (stats.bis.org/statx/).
Tables A1 to A4 provide an overview of the LBS disaggregated by sector of the counterparty. Table A1 summarises the different breakdowns available: in addition to sector, it presents data by region where the counterparty resides, currency and instrument. Table A2 shows the sectoral composition of LBS-reporting banks' claims and liabilities by location of the bank, ie positions of banks in a given reporting country on all counterparties abroad. Table A3 shows the sectoral composition of claims and liabilities on counterparties in over 200 individual countries, ie cross-border positions of all LBS-reporting banks on counterparties in a given country. Table A4 shows the sectoral composition of cross-border positions for banks of a given nationality. For each table, data on amounts outstanding and break- and exchange rate-adjusted changes are published.
Country tables A5 to A7 present detailed views of the LBS from three different perspectives: location of the reporting bank, residence of the counterparty, and nationality of the reporting bank, respectively. The BIS plans to publish additional data in these tables in the future as their quality and completeness improve. Table A8 presents LBS-reporting banks' claims and liabilities on the central bank sector.
Tables B1 to B3 provide an overview of the CBS reported by banks of different nationalities, albeit without any details by country of the counterparty. Table B1 summarises the total claims of CBS-reporting banks, distinguishing between domestic and foreign claims. Table B1 also presents their total assets/liabilities by instrument and equity. Table B2 shows foreign claims on an immediate counterparty basis, including a breakdown of the international component of claims by sector and remaining maturity. Table B3 presents foreign claims and other potential foreign exposures on an ultimate risk basis.
Country table B4 presents bilateral CBS for banks of different nationalities on counterparties in a given country. While the Bulletin shows data for 29 countries, data for over 200 countries are available on the BIS website. Table B4 distinguishes between foreign banks and domestic banks. The term "foreign banks" refers to banks headquartered abroad (or, more precisely, controlled by parents abroad). These are mostly banks from CBS-reporting countries, but include the unconsolidated positions of banking offices located in CBS-reporting countries and headquartered elsewhere. Domestic banks are those headquartered in the country. For example, in the table for Japan, the claims of Japanese banks on residents of Japan are shown under domestic banks, in the row labelled "Worldwide offices (consolidated)". Under foreign banks, the row for Japan is blank.
The tables in Section A replace Tables 1-8 of the former Statistical Annex, and those in Section B replace Tables 9A-9E. An explanation of where to find data from the old tables in the new tables is available on the BIS website (www.bis.org/statistics/annex_map.htm).< /p>
The right-hand panel of Graph 1 compares the local claims of LBS-reporting banks on non-bank borrowers in a given country with domestic bank credit from MFS. For most countries, the ratio is below but close to one. In a few cases, such as Japan, the ratio exceeds one because the LBS include some assets not included in the MFS. In other cases, such as Brazil and Korea, the ratio is much less than one because the LBS exclude the assets of large domestic banks with little international business.
Furthermore, even though more countries report the LBS than do the CBS, the global coverage of the LBS is less complete than that of the CBS. The CBS are collected on a consolidated basis and so capture the positions of banks' affiliates worldwide. By contrast, the LBS capture only the positions of affiliates in LBS-reporting countries. To the extent that a given banking system has large operations in non-reporting countries, or in reporting countries that do not report all of the requested data, the LBS by nationality of the reporting bank can misrepresent the global activities of the relevant banking system. For example, Canadian banks' consolidated claims on all countries totalled $3.0 trillion at end-March 2015 (Table 3). Of this amount, only $2.4 trillion was captured in the LBS (after subtracting intragroup positions). The main reason for the gap is that local positions booked by Canadian banks' offices in the United States and some Caribbean countries are not included in the LBS because these countries have not yet reported the requested data. In addition, the CBS may include the claims of reporting banks' non-bank subsidiaries that are within their supervisory or accounting perimeter (eg securities dealers), whereas the LBS exclude the claims of such entities.
Understanding banks' counterparties
The IBS have long provided detailed information about the countries where banks' counterparties reside but limited information about the sectors in which these counterparties are active. The enhancements support a more detailed analysis of the build-up of risks in particular sectors, especially within the non-bank private sector, which comprises non-bank financial institutions, non-financial corporations and households.
The Great Financial Crisis revealed the shortcomings of focusing on countries and neglecting sectors. Even when vulnerabilities are not apparent in a given economy, weaknesses in particular sectors can be transmitted globally through cross-border bank exposures and have wider consequences for financial stability. For instance, in the 2000s, some foreign banks built up large exposures to the US household sector, which subsequently exacerbated spillovers from the subprime mortgage crisis. Banks' exposures to special purpose vehicles, securities brokers, hedge funds and other non-bank financial entities - the so-called "shadow banking" system - also built up significantly over this period.9
The enhancements shed light on exposures to the non-bank private sector. Table 4 shows the sectoral composition of LBS reporting banks' cross-border claims on selected regions. Banks in some reporting countries have not yet reported the new sectors, and thus the allocated share of positions is relatively low, less than 75% overall. For this reason, the new tables published in the BIS Statistical Bulletin do not yet show the new sectors for individual counterparty countries; the data will be added once these breakdowns are more widely reported.
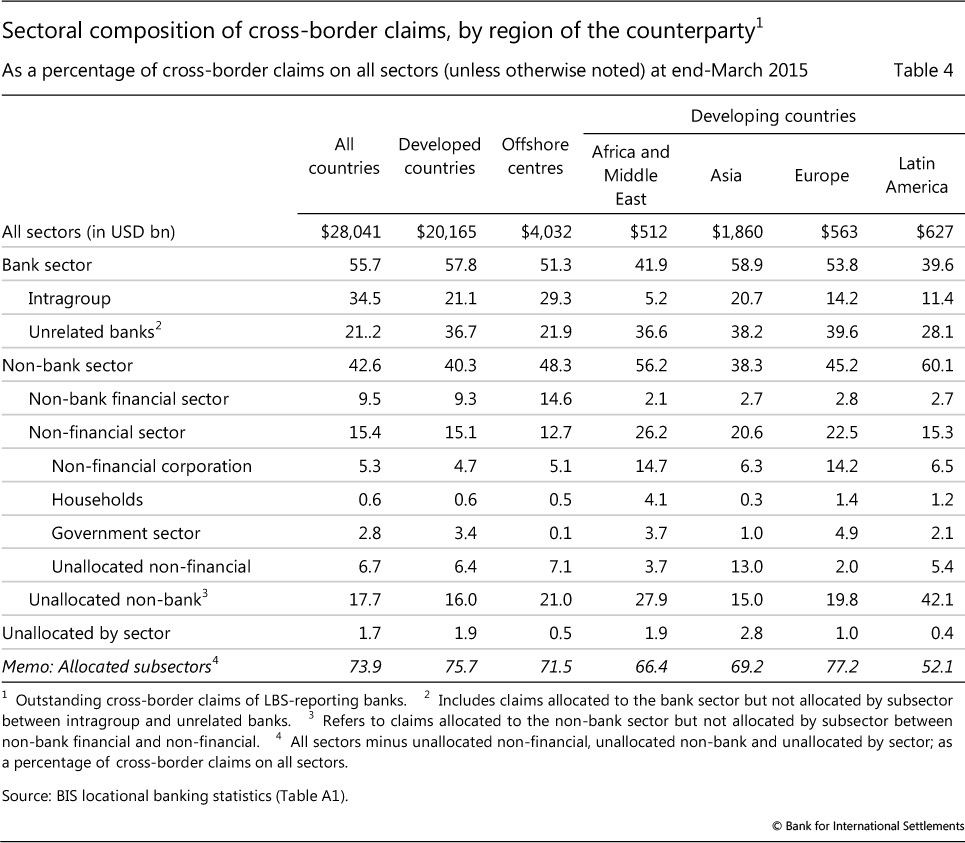
Notwithstanding the large unallocated share, some interesting patterns emerge. Claims on the non- bank financial sector account for a relatively high share of cross-border claims on developed (advanced) economies and offshore financial centres: 9% and 15%, respectively. By contrast, claims on this sector are less than 3% of cross-border claims on each of the four developing (emerging market) regions. In these regions, claims on the non-financial sector, in particular on non-financial corporations, account for a larger share of the total. Finally, intragroup positions account for a sizeable share of claims on most regions.
Monitoring sources of funding
The enhancements shed additional light on how banks fund themselves. High or increasing reliance on non- core sources of funding - funding other than customer deposits - is often associated with a build-up of risk (Hahm et al (2013)).
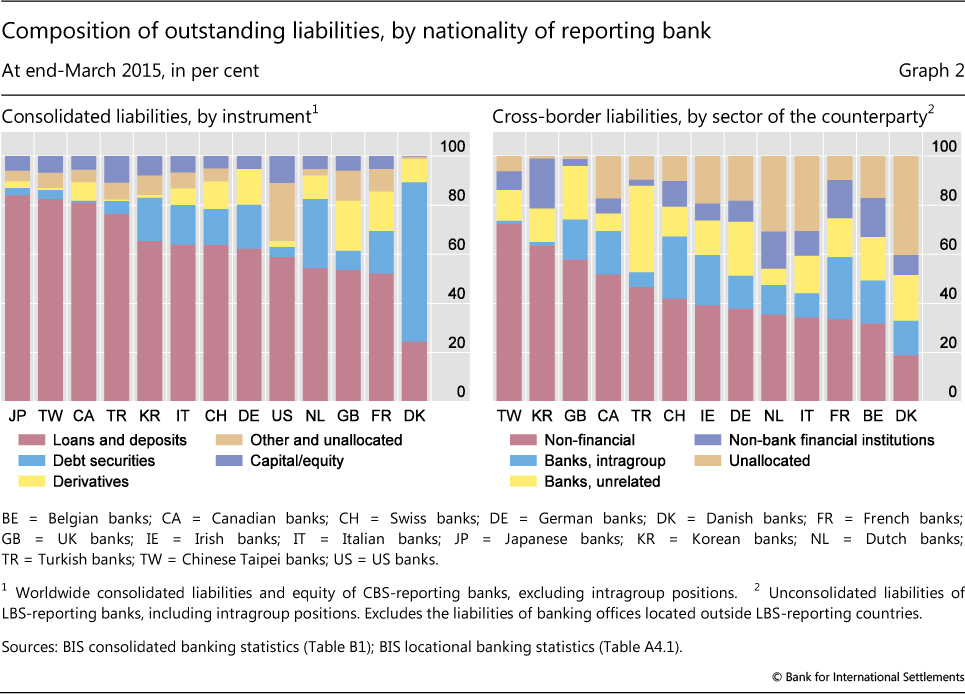
The instrument breakdown introduced in the CBS for liabilities can be used to monitor the components of reporting banks' liabilities over time. At end-March 2015, the share of deposits in total liabilities plus equity varied from more than 80% for Japanese banks to less than 25% for Danish banks (Graph 2, left-hand panel). The share of derivatives with a negative market value (from the perspective of the reporting bank) varied from about 20% for UK banks to less than 5% for US banks.
The rough instrument breakdown for liabilities in the CBS is a starting point for further analysis using other sources of information. Issues to consider include differences in accounting standards and practices, which especially affect the comparability of data on derivatives and repurchase agreements. Under International Financial Reporting Standards, which apply in Europe and many other countries, the ability of banks to offset financial assets and liabilities and report them on a net basis is more limited than under some national accounting standards, notably those of the United States. Another issue to consider is that, in the LBS and CBS, data reported under "loans and deposits" include instruments that could be considered non-core funding sources - in particular, interbank loans and repurchase agreements.
The LBS complement the liability breakdown in the CBS by providing information about the sector and residence of banks' creditors. The sectoral composition of cross- border liabilities has long been available by nationality of the reporting bank. As shown in the right-hand panel of Graph 2, non-bank financial counterparties account for more than 15% of Belgian, Dutch, French and Korean banks' cross-border liabilities (purple bars). Turkish and UK banks are relatively reliant on interbank funding (yellow bars). In addition, the new data enable deeper analysis of the geographical composition of funding (Box 1).
Box 3
Revisions to historical LBS and CBS
In conjunction with the release of new data collected as part of the enhancements, the BIS has revised some data published previously in the LBS and CBS. These revisions take advantage of the new data to improve the quality of aggregates calculated by the BIS. However, they result in some discontinuities in historical data.
In the LBS, data for the bank sector were revised to exclude positions unallocated by counterparty sector. Previously, the BIS estimated positions vis-à-vis the bank sector in individual counterparty countries as all sectors minus the non-bank sector. Consequently, the bank sector included positions unallocated by counterparty sector. From end-June 2012, the BIS began to collect positions unallocated by sector separately as well as positions vis-à-vis bank subsectors allocated by counterparty country. These new data enabled estimates for the bank sector to be improved. While the full history of estimates has been revised, the impact is most noticeable starting from end-June 2012. The impact of the revisions to the bank sector is especially significant for interbank liabilities. As of end-2014, the exclusion of unallocated positions reduced BIS reporting banks' outstanding cross-border liabilities to banking offices by $2.2 trillion to $15.2 trillion. By contrast, their exclusion reduced interbank claims by only $0.5 trillion to $16.2 trillion.
In the CBS, data for the positions of all reporting banks on counterparties in a given country were revised to distinguish more clearly between the positions of foreign and domestic banks, where domestic banks are those headquartered in the respective country. Historically, some data reported by domestic banks were mixed with data from foreign banks in the case of counterparty countries that were also CBS-reporting countries. In particular, claims of all reporting banks on an immediate counterparty basis included the unconsolidated cross-border claims of domestic banks' foreign offices on residents of the banks' home country. For example, claims on Japan previously included the claims of Japanese banks' offices in other CBS-reporting countries. As of end-March 2015, the unconsolidated claims of Japanese banks' foreign offices on Japan totalled $0.5 trillion. The claims of foreign (non-Japanese) banks on Japan totalled $0.8 trillion on an immediate counterparty basis. Whereas these two figures were previously added together in the data published by the BIS for all reporting banks (in what used to be Table 9A), data for domestic and foreign banks are now shown separately (in the new Table B4).
From end-2013, the BIS began to collect domestic positions on a consolidated basis: the worldwide positions of banking groups on residents of the groups' home country. These data are more comprehensive than the data reported by domestic banks' foreign offices. To facilitate historical comparisons, in Table B4 the BIS publishes consolidated data for the worldwide offices of domestic banks as well as the unconsolidated data of their foreign offices. Data for domestic banks are available only for counterparty countries that are also CBS-reporting countries (and some of these do not yet report domestic positions).
Finally, the BIS revised the labels of some data to clarify what they covered. In the CBS, data on an immediate borrower basis were renamed data on an immediate counterparty basis, in recognition of the fact that the data now cover liabilities as well as assets. Also, the public sector was renamed the official sector to clarify that it refers only to positions on the government sector and central bank and does not include positions on publicly owned corporations.
Prior to end-June 2012, the BIS collected data for the bank sector and subsectors without a breakdown by counterparty country; historically, the LBS by individual counterparty country were collected only for all sectors and for the non-bank sector. Prior to end-June 2012, data unallocated by sector are incomplete. This is one of two pieces of unconsolidated data that have historically been included in the total for all reporting banks, the other piece being the unconsolidated cross-border claims of banking offices with parent banks headquartered outside the BIS reporting area. The BIS continues to include the latter piece in the total for foreign banks. Whereas domestic positions are reported by the home country and capture worldwide consolidated positions, data on foreign offices' claims on residents of the home country are reported by countries where the office is located and hence omit the claims of offices located outside the CBS-reporting countries.
Along with the caveats discussed above regarding data on domestic positions, use of the LBS to analyse the composition of liabilities needs to take account of liabilities that banks are unable to allocate by counterparty. Whereas banks should always know the counterparty to whom they lend, they do not necessarily know the counterparty from whom they borrow, particularly when that borrowing takes the form of negotiable instruments such as debt securities. Consequently, liabilities unallocated by counterparty can be large. Cross-border liabilities unallocated by sector of the counterparty equalled $2.2 trillion at end-March 2015, or 9% of outstanding cross-border liabilities.10 Banks' own issues of debt securities accounted for nearly 80% of these liabilities.
Dissecting the currency composition
A unique feature of the LBS is their currency breakdown. The enhancements refine this breakdown and thereby facilitate a more accurate adjustment of quarterly changes in banks' positions for exchange rate movements, as well as a fuller analysis of banks' sources and uses of particular currencies.
One use of the enhanced currency breakdown is to improve estimates of underlying flows between quarters. In the IBS, only amounts outstanding are collected; flows are approximated by calculating changes in amounts outstanding adjusted for discontinuities in the data and exchange rate movements. Even in the absence of any flows, discontinuities can be introduced by changes in methodology, reporting practices or reporting population - so-called "breaks" in time series. Also, movements in exchange rates affect the US dollar value of amounts denominated in non-dollar currencies.11 Any additional information about breaks and the currency composition of positions therefore enables the BIS to improve its calculation of break- and exchange rate-adjusted changes.12
Furthermore, the currency breakdown, coupled with the new more granular counterparty data in the LBS by nationality of the reporting bank, enables the calculation of exchange rate-adjusted changes in claims for banks of a given nationality on residents of a given country. While such bilateral information has historically been available in the CBS for amounts outstanding, the calculation of exchange rate-adjusted changes for bank nationality-counterparty country pairs was not possible because the CBS do not have a comprehensive currency breakdown. Utilising the bilateral exchange rate-adjusted changes in claims derived from the enhanced LBS, Avdjiev and Takáts (2014) identify the demand and supply side drivers of the slowdown in cross-border bank lending to emerging market economies (EMEs) during the "taper tantrum" episode of 2013.
Another use of the currency breakdown is to analyse imbalances in funding markets. During the 2000s, many banks followed similar funding strategies. This funding equivalent of a "crowded trade" created systemic risks that aggravated the Great Financial Crisis (McGuire and von Peter (2012)). The new data provide better insights into the degree to which banks of different nationalities invest in one currency and fund in another. However, it should be kept in mind that, while such funding imbalances can expose banks to liquidity risk, they do not necessarily create currency risk. Banks typically use swaps and other derivatives to hedge mismatches in the currency composition of cash assets and liabilities; such hedges are not captured by the currency breakdown in the LBS.
For the first time, the new tables published in the BIS Statistical Bulletin show the currency composition of cross-border claims on and liabilities to counterparties residing in individual countries. The BIS has started to publish positions denominated in each of five major currencies - the US dollar, euro, yen, Swiss franc and sterling - plus positions in other currencies collectively and positions unallocated by currency. These figures include some estimates made by the BIS to adjust for gaps in the currency details reported by some countries.
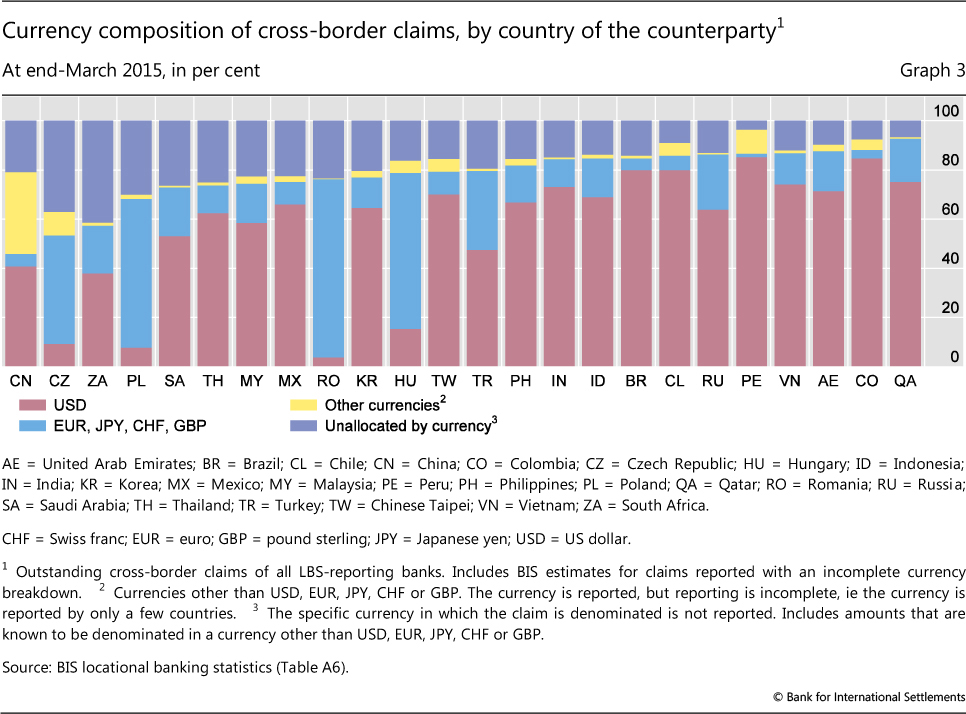
Positions in currencies other than one of the five major currencies - the sum of other and unallocated currencies - have been growing steadily over the past decade, particularly in the case of cross-border lending to EMEs. As of end-March 2015, the share of other and unallocated currencies in cross-border claims was substantial for a number of large EMEs: it exceeded 50% in the case of China, and was between 30% and 50% for the Czech Republic, Poland and South Africa (Graph 3). While data on the currency composition of claims in this category are very incomplete, available information suggests that such positions tend to be denominated in the local currency of the counterparty: for example, the renminbi for cross-border claims on China, and the zloty for those on Poland.13
Completing the enhancements
The failure to anticipate the Great Financial Crisis can be attributed more to the faulty lens through which the existing statistics were examined than to a lack of adequate statistics (Borio (2013)). Nevertheless, the 2007-09 crisis, like many crises before it, highlighted the need for more detailed information. The enhancements to the BIS international banking statistics approved by the CGFS responded to this need and introduced new data to help analysts understand changes in the financial landscape and what consequences they might have for financial stability.
Although implementation of the enhancements began in 2012, it will be several more years before they are completed. In the near future, the global coverage of the IBS is expected to improve. Authorities in additional countries will be joining the reporting population. In particular, as part of the G20 Data Gaps Initiative, those G20 economies that do not yet participate in the IBS - Argentina, China, Russia and Saudi Arabia - are taking steps to join. In addition, the representativeness of aggregates comprising data from all reporting countries will improve as those reporting countries where implementation of the enhancements is currently lagging start to report the requested data.
The granularity of the enhanced data poses challenges (Avdjiev et al (2015)). First, the more granular the data, the greater are their volume and complexity, which in turn require adaptions of information systems by banks, reporting authorities and the BIS to maintain data quality. Second, as discussed above, more granular data are more likely to raise issues of confidentiality. Consolidation in the banking industry and the withdrawal of some banks from international banking activities since the Great Financial Crisis further increase this likelihood. Efforts are under way to address these challenges - for example, by constructing broad indicators that use granular data as building blocks, as well as encouraging individual banks to disclose more information about their international business.
The BIS plans to release additional data in the coming years as their completeness improves and the challenges posed by granularity are addressed. Indeed, one of the enhancements mandated by the CGFS was to make the IBS more widely available. The IBS are intended to help central banks, other policymakers and market participants analyse and manage risks, with greater transparency thereby contributing to financial stability. The new tables published in the BIS Statistical Bulletin are an important step on the road to this goal, and the BIS together with central banks will continue to work towards publishing more data and improving their accessibility.
References
Avdjiev, S, P McGuire and P Wooldridge (2015): "Enhancements to the BIS international banking statistics", IFC Bulletin, no 39.
Avdjiev, S and E Takáts (2014): "Cross-border bank lending during the taper tantrum: the role of emerging market fundamentals", BIS Quarterly Review, September, pp 49-60.
Bank for International Settlements (2011): "Closing data gaps to enhance systemic risk measurement", 81st Annual Report, June, Chapter VI.
--- (2013): Guidelines for reporting the BIS international banking statistics: version incorporating Stage 1 and Stage 2 enhancements recommended by the CGFS, March.
--- (2014): "Guidelines for reporting the BIS international banking statistics: proposed revisions and clarifications to the March 2013 version", July,
Borio, C (2013): "The great financial crisis: setting priorities for new statistics", Journal of Banking Regulation, vol 14, pp 306-17 (also available as BIS Working Papers, no 408, April).
Buch, C, J Driscoll and C Ostergaard (2005): "Cross-border diversification in bank asset portfolios", ECB Working Papers, no 429, January.
Committee on the Global Financial System (2009): "Credit risk transfer statistics", CGFS Publications, no 35, September.
--- (2012): "Improving the BIS international banking statistics", CGFS Publications, no 47, November.
Fender, I and P McGuire (2010): "Bank structure, funding risks and the transmission of shocks across countries: concepts and measurement", BIS Quarterly Review, September, pp 63-79.
Financial Stability Board (2014): Global shadow banking monitoring report 2014, 30 October.
Financial Stability Board and International Monetary Fund (2009): "The financial crisis and information gaps", report to the G20 Finance Ministers and Central Bank Governors, October.
Friðriksson, I (2009): "The banking crisis in Iceland in 2008", remarks prepared for a seminar at the Bank of Finland, 6 February.
Hahm, J, H Song Shin and K Shin (2013): "Noncore bank liabilities and financial vulnerability", Journal of Money, Credit and Banking, vol 45, August, pp 3-36.
McCauley, R, P McGuire and G von Peter (2012): "After the global financial crisis: from international to multinational banking?", Journal of Economics and Business, vol 64, no 1, pp 7-23.
McGuire, P and G von Peter (2012): "The dollar shortage in global banking and the international policy response", International Finance, vol 15, no 2, pp 155-78 (also available as BIS Working Papers, no 291, October 2009).
Vause, N (2011): "Enhanced BIS statistics on credit risk transfer", BIS Quarterly Review, December, pp 85-9.
1 The views expressed in this article are those of the authors and do not necessarily reflect those of the BIS. We are grateful to Claudio Borio, Ben Cohen, Dietrich Domanski, Siew Koon Goh, Swapan Kumar Pradhan, Hyun Song Shin, Bruno Tissot and Christian Upper for comments on earlier drafts of the article, and to Pablo García-Luna and Sebastian Goerlich for excellent research and statistical support.
2 The enhancements to the IBS are part of a broader international effort to close data gaps revealed by the crisis. The CGFS approved an expansion in the coverage of credit default swap statistics, which was implemented in 2011 (CGFS (2009), Vause (2011)). The G20 Data Gaps Initiative recommended improvements to a broad range of statistics (FSB- IMF (2009)).
3 In the IBS, the controlling parent is presumed to be the highest-level legal entity over which consolidated supervision is exercised by prudential authorities (BIS (2014)). For most banking groups, their nationality is synonymous with the country where the head office of the group is located.
4 In the IBS, "local currency" refers to the currency of the country where the banking office that books the position is located. It is not synonymous with the currency of the home country where the parent bank is based. For example, the local currency for the Spanish subsidiary of a UK bank is the euro, not the pound sterling. For any given bank, local positions in local currencies may include many different currencies, depending on the number of countries in which the bank has an office.
5 Liabilities in the CBS are not reported with a breakdown by country of the counterparty, but such a breakdown is reported for liabilities in the LBS on an unconsolidated basis.
6 In the CBS, non-bank financial counterparties were previously reported together with non-financial corporations and households in the non-bank private sector. The government sector has always been reported separately in the CBS, as part of the official sector together with the central bank.
7 Previously, different types of bank counterparties were reported in the LBS by nationality, without information about the residence of the counterparty.
8 Income statement information is also important for assessing the resilience of banks (Borio (2013)). To the extent that foreign operations are more profitable than domestic operations, balance sheet information might provide an incomplete picture of the relative importance of international activities.
9 The shadow banking system can broadly be described as credit intermediation involving entities and activities outside the regular banking system (FSB (2014)).
10 Liabilities unallocated by either sector or residence of the counterparty amounted to a further $2.6 trillion at end-March 2013.
11 Amounts outstanding are reported to the BIS in US dollars. The depreciation of a given currency against the US dollar will result in a decline in the reported US dollar value of positions denominated in that currency, and an appreciation an increase.
12 Adjusted changes may still over- or underestimate underlying flows because of fluctuations in valuations, writedowns, the underreporting of breaks, and differences between the exchange rate on the transaction date and the quarterly average exchange rate used by the BIS to convert changes in non-dollar amounts into US dollars.
13 The BIS continues to analyse the composition of other and unallocated currencies and may at a later date revise its methodology for calculating exchange rate- adjusted changes for these positions. Currently, the BIS assumes that unallocated positions are denominated in the IMF's Special Drawing Right (SDR), which is a basket composed of the US dollar, euro, yen and sterling, and adjusts outstanding positions using the SDR exchange rate against the US dollar.