OTC interest rate derivatives turnover in April 2019
Triennial Central Bank Survey
1. BIS Triennial Central Bank Survey
The BIS Triennial Central Bank Survey is the most comprehensive source of information on the size and structure of global foreign exchange (FX) and over-the-counter (OTC) derivatives markets. The Triennial Survey aims to increase the transparency of OTC markets and to help central banks, other authorities and market participants monitor developments in global financial markets. It also helps to inform discussions on reforms to OTC markets.
FX market activity has been surveyed every three years since 1986, and OTC interest rate derivatives market activity since 1995. The Triennial Survey is coordinated by the BIS under the auspices of the Markets Committee (for the FX part) and the Committee on the Global Financial System (for the interest rate derivatives part). It is supported through the Data Gaps Initiative endorsed by the G20.
This statistical release covers the interest rate derivatives part of the latest Triennial Survey of turnover that took place in April 2019. Central banks and other authorities in 53 jurisdictions participated in the 2019 survey (see page 13). They collected data from close to 1,300 banks and other dealers in their jurisdictions and reported national aggregates to the BIS, which then calculated global aggregates. Turnover data are reported by the sales desks of reporting dealers, regardless of where a trade is booked, and are reported on an unconsolidated basis, ie including trades between related entities that are part of the same group.
Data are subject to revision. The final data, as well as several special features that analyse the data, will be released with the BIS Quarterly Review in December 2019.
Highlights
Highlights from the 2019 Triennial Survey of turnover in OTC interest rate derivatives markets:
- Daily turnover of OTC interest rate derivatives averaged $6.5 trillion in April 2019, up markedly from the April 2016 survey when it averaged $2.7 trillion per day. This rise appears to have been driven mainly by increased hedging and positioning amid shifting prospects for growth and monetary policy. However, other factors also played a role. Much of the turnover in April 2019 was in shorter-term contracts, which are rolled over more often. In addition, the 2019 survey saw more comprehensive reporting of related party trades than in previous surveys. Average daily turnover in April 2019, after adjusting for these trades, is estimated to have been closer to $5.8 trillion in April 2019, up around 120% since the 2016 survey.
- The 2019 survey distinguished for the first time between overnight index swaps (OIS) and other interest rate swaps. Almost half of the average daily turnover of all interest rate swaps ($4.1 trillion) was due to turnover in OIS ($2.0 trillion; Table 1). Turnover of forward rate agreements (FRAs) averaged $1.9 trillion. Combined, turnover in OIS and FRAs - instruments that are typically of short maturities - accounted for 61% of turnover in all instruments.
- Average daily turnover in US dollar-denominated contracts amounted to $3.3 trillion in April 2019. This represented about half of total turnover in all currencies, the same global market share as in 2016. Turnover in euro-denominated contracts came to $1.6 trillion in April 2019, or 24% of total turnover (also 24% in 2016). Turnover in contracts in renminbi amounted to $33 billion, or 0.5% of total turnover (up from 0.4% in 2016), and that in contracts in Korean won reached $27 billion, or 0.4% of total turnover (down from 0.5% in 2016).
- In April 2019, sales desks located in the United Kingdom recorded the highest average daily turnover in OTC interest rate derivatives, at $3.7 trillion (50% of the global market), followed by the United States ($2.4 trillion, 32% global market share) and Hong Kong SAR ($436 million, 6% global market share).
2. Turnover in OTC interest rate derivatives markets
Daily turnover in single currency OTC interest rate derivatives averaged $6.5 trillion in April 2019 (Graph 1 and Table 1). Turnover in April 2019 was significantly higher than in the previous survey in April 2016 ($2.7 trillion per day). This in large part appears to have reflected increased hedging and positioning amid shifting prospects for growth and monetary policy, although other factors also played a role.1 As discussed below, more comprehensive coverage in the 2019 survey boosted the overall turnover figures. In addition, short-term instruments, which are rolled over more often, accounted for much of the turnover in April. Exchange rate movements had only a minor impact on the aggregate turnover figures between 2016 and 2019 (Table 1).
More comprehensive reporting
Part of the increase between the 2016 and 2019 surveys reflected more comprehensive reporting of particular types of trades.
First, dealers in several trading jurisdictions noted an increase in "related party trades" in the 2019 survey - in particular, "back-to-back trades".2 Related party trades, which are reported as an "of which" item (without a breakdown by counterparty sector, instrument or currency), jumped significantly, from 15% of total turnover in the 2016 survey to 24% in the 2019 survey. The increase in these trades accounted for 30 percentage points of the 143% increase in total turnover since the 2016 survey (Graph 1, left-hand panel, red dots). The greater coverage boosted positions between reporting dealers (red bar), but also positions between dealers and "other financial institutions" (blue bar). Overall, after adjusting for these trades (by keeping the share of related party trades constant), average daily turnover in April 2019 is estimated to have been closer to $5.8 trillion, up around 120% since the 2016 survey. This growth in turnover is broadly in line with trends evident in other data sources.3
Second, several reporting dealers also noted that compression trades, which are not reported as a separate item in the survey, contributed more to their turnover figures as reported in the 2019 survey than in the 2016 survey. Compression trades replace existing contracts with new ones to reduce outstanding notional amounts, while keeping net exposures unchanged.4
Graph 1: Turnover of OTC interest rate derivatives
Net-net basis,1 daily averages in April, in billions of US dollars
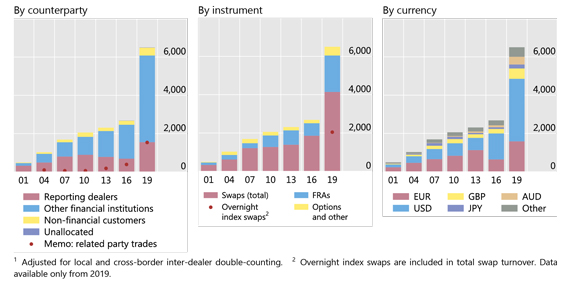
Source: BIS Triennial Central Bank Survey. For additional data by instrument, counterparty and currency, see Tables 1-4 on pages 8-11, respectively.
Turnover by instrument
Interest rate swaps continued to dominate in global OTC interest rate derivatives turnover (Table 1). Turnover of these contracts accounted for 64% ($4.1 trillion) of the global total in April 2019 (Graph 1, centre panel, and Table 2), down from 69% in the 2016 survey. In contrast, FRAs as well as options and other products both took larger market shares than in the previous survey. Daily turnover in FRAs averaged $1.9 trillion, or 29% of total turnover (up from 24% in 2016), and that in options and other products averaged $456 billion, or 7% of global turnover (up from 6% in 2016).
Instruments that are typically of shorter maturity - OIS and FRAs - accounted for more than half (61%) of the total turnover in all instruments. Shorter-maturity instruments tend to boost turnover, since these contracts are replaced more often. Turnover of OIS - reported separately for the first time in this survey - was $2.0 trillion, or 31% of total turnover.
Turnover by counterparty
Since at least the 2007 Triennial Survey, the share of trading among reporting dealers has fallen while trading with other financial institutions has been on the rise (Table 2). This trend continued in 2019, as turnover with other reporting dealers (Graph 1, left-hand panel) increased less rapidly than trades with other counterparties. As a result, the share of turnover with reporting dealers in global turnover fell to 24% in April 2019, down from 26% in 2016 and 47% in 2007 (Table 2). At the same time, the share of turnover with other financial institutions rose to 70% in 2019, up from 66% in 2016 and 44% in 2007. The share of trades with non-financial customers has been relatively stable in all surveys, accounting for 6% of global turnover in 2019, compared with 8% in 2016 and 8% in 2007.
Turnover by currency
Turnover in US dollar-denominated contracts reached $3.3 trillion in April 2019, accounting for about half of total turnover in all currencies, as in the 2016 survey (Graph 1, right-hand panel, and Table 3). This share is up from close to 30% in the 2013 and 2010 surveys. Turnover in euro-denominated contracts amounted to $1.6 trillion in 2019, or 24% of turnover in all currencies (similar to its share in 2016, but down from that in previous surveys). Turnover in sterling amounted to $538 billion per day, followed that in the Australian dollar ($401 billion) and the Japanese yen ($213 billion).
Among the currencies of emerging market economies (EMEs), renminbi-denominated contracts were the most actively traded, at $33 billion per day in April 2019, or 0.5% of total global turnover. This was followed by the Korean won, at $27 billion per day or 0.4%. Turnover in contracts denominated in the Mexican peso (which had been the most heavily traded EME currency in the 2016 survey) fell slightly to $23 billion in April 2019, or 0.4% of the global market.
Contracts denominated in other major emerging Asia currencies increased their global market share, reaching $18 billion for the Hong Kong dollar (0.3% global market share), $17 billion for the Indian rupee (0.3%) and $15 billion for the Singapore dollar (0.2%). Similarly, contracts in the major central and eastern European currencies recorded relatively higher turnover numbers, and correspondingly higher shares in total turnover: $12 billion per day for the Czech koruna (from $1 billion in 2016) and $8.3 billion per day for the Polish zloty (from $5 billion in 2016).
In other major EME currencies, average daily turnover of OTC interest rate derivative contracts remained relatively low. Turnover for contracts denominated in the Brazilian real was $8 billion per day, in the Russian rouble $1.2 billion and in the Turkish lira $0.6 billion.
Geographical distribution of turnover
In April 2019, sales desks located in the United Kingdom recorded the highest average daily turnover in interest rate derivatives on a "net-gross" basis5 (Graph 2 and Table 5). Turnover there amounted to $3.7 trillion, or 50% of the global total. This is a considerably higher share than in the 2016 survey (39%), but in line with the 2013 and 2010 surveys (50% and 47%, respectively). Dealers in the United Kingdom, which has historically been the main trading location for euro-denominated contracts, accounted for 86% of all such contracts in April 2019 (up from 75% in April 2016). They also reported a higher share of contracts denominated in US dollars (33% in 2019, compared with 14% in 2016).
For their part, dealers in the United States accounted for 32% of the global turnover in 2019. This is down from their share in the 2016 survey (41%), but closer to their 23-24% shares reported in previous surveys (Table 5). The change since 2016 in part reflected a lower share of related party trades reported by dealers in the United States in the 2019 survey.
Turnover reported at sales desks in euro area countries remained relatively low, reaching $256 billion, or 3.5% of the total turnover in April 2019. The largest euro area trading centre, France, saw turnover decrease to $120 billion; as a result, its share in global turnover fell markedly, to 1.6% from 4.6% in 2016 and 8.1% in 2007.
The shares of trading in other advanced economies remained relatively stable. Trading in Japan was 1.8% of total turnover in the 2019 survey, the same share as in 2016. The share of total turnover reported by dealers in Canada rose slightly (to 1.7% from 1.1%). By contrast, the share reported by dealers in Australia fell (to 1.3% from 1.9%).
Trading in the major Asian financial centres - Hong Kong SAR and Singapore - diverged. Dealers in Hong Kong reported a higher market share in April 2019 (6%) than in April 2016 (3.6%), driven largely by greater turnover in Australian dollar-denominated contracts. By contrast, turnover reported by dealers in Singapore dropped to 1.5% of the global total in 2019, from 1.9% in 2016.
Sales desks in other EMEs continued to account for a small share of global interest rate derivatives turnover. Only China (0.2%), South Africa (0.2%), Korea (0.1%) and India (0.1%) reached global market shares equal to or above 0.1%. These shares are below the global market shares of their respective currencies, reflecting the fact that contracts in major EME currencies are mainly traded offshore.
Graph 2: Geographical distribution of OTC interest rate derivatives turnover
Net-gross basis,1 daily averages in April
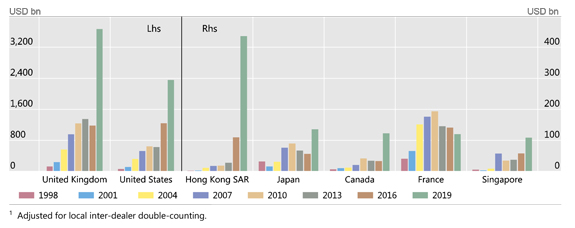
Source: BIS Triennial Central Bank Survey. For additional data by country, see Table 5 on page 12.
1 See BIS, "Markets retreat and rebound", BIS Quarterly Review, March 2019, pp 1-14.
2 Back-to-back deals are linked deals where the liabilities, obligations and rights of the second deal are exactly the same as those of the original deal. They are normally conducted between affiliates of the same consolidated group to facilitate either internal risk management or internal bookkeeping. Feedback from reporting central banks participating in the survey suggest that many reporting dealers that did not include these trades in the 2016 survey were able to report them in the 2019 survey (in line with the survey guidelines).
3 For example, data from Clarus FT point to a similar rate of growth in turnover in OTC interest rate derivatives (FRAs, OIS and other single currency interest rate swaps) from April 2016 to April 2019. These data cover notional trading volumes reported by all major central clearing counterparties (CCPs) globally but are on a post-novation basis, while data collected for the Triennial Survey are on a pre-novation basis. BIS monthly statistics on the turnover of interest rate derivatives on exchanges show a lower rate of growth, about 50%, between April 2016 and April 2019.
4 See A Schrimpf, "Outstanding OTC derivatives positions dwindle as compression gains further traction", BIS Quarterly Review, December 2015, pp 24-5; and T Ehlers and E Eren, "The changing shape of interest rate derivatives markets", BIS Quarterly Review, December 2016, pp 54-65.
5 "Net-gross" turnover is adjusted for inter-dealer trades within the same jurisdiction, but not for cross-border trades between dealers. All turnover numbers by trading location are reported on a "net-gross" basis.