Non-US banks' claims on the Federal Reserve
Non-US banks' affiliates in the United States took on about half of the claims on the Federal Reserve that it created to pay for its large-scale bond purchases. They did so largely through uninsured branches unaffected by a new Federal Deposit Insurance Corporation charge on wholesale funding payable by US-chartered banks. These branches funded the reserves by drawing from their affiliates abroad. Thus, counterintuitively, large-scale bond buying by the Fed drew dollar funding into the United States from the eurodollar market. On a consolidated basis, non-US banks raised dollars by swapping other currencies and increasing dollar liabilities, even as they increased dollar claims outside the United States. In sum, seemingly small national regulatory differences led international banks to make big adjustments in their balance sheets. Looking forward, a large shift of the Fed's liabilities from banks' reserves to reverse repos with non-banks could again induce changes in the global dollar flow of funds.1
JEL classification: E43, E52, E65, G01, G15, G21, G28.
Up to December 2013, the Federal Reserve created $2.2 trillion in bank reserves to fund $4 trillion of US Treasury and mortgage bonds.2 With short-term interest rates near zero, these asset purchases aim to provide additional monetary ease through lower bond yields. From this monetary policy perspective, it does not really matter which banks hold the Fed's liabilities.
Yet from a regulatory perspective it does matter. Non-US banks' branches hold a disproportionate share of those reserves as a result of seemingly small regulatory differences. These have induced massive changes in internationally active banks' balance sheets. This is a point of more than historical interest in a world in which jurisdictions can choose to calibrate regulations differently.
This short feature shows how non-US banks' branches and agencies in the United States drew on dollar funding from the rest of the world to take up almost $1 trillion of reserves at the Fed. Perhaps counterintuitively, the Fed's large-scale bond buying led to a massive inflow of bank funding from the eurodollar market. We follow the money to show how the dollar balance sheets of these banks' offices outside the United States came up with the dollars. The still experimental Fed operations to raise funds directly from non-banks could, if ramped up, again induce large changes in the global dollar flow of funds.
Non-US banks' uptake of reserves at the Fed
Non-US banks operate in the United States in the legal forms of subsidiaries and branches. One key difference for the distribution of claims on the Fed is that non-US banks' branches and agencies in the United States operate without FDIC (deposit) insurance.3 This did not make much of a competitive difference before the crisis of 2007-9, when payments to the FDIC were effectively zero for most US-chartered banks. The Dodd-Frank legislation set a goal of a larger FDIC fund, requiring all insured banks to contribute, and as of April 2011 widened the assessment base from an insured bank's deposits to its total assets less equity, thereby imposing a charge on short-term wholesale funding. As of then, uninsured branches of non-US banks found themselves at a competitive advantage in raising wholesale funding.4
In the aftermath of the global financial crisis, some observers argued for a G20 levy on short-term wholesale bank funding on the grounds that it contributed to systemic instability (Shin (2010)). Proponents feared that, if such a levy were not implemented in a coordinated fashion, regulatory arbitrage would shift assets to those banks not paying the levy. The wider FDIC assessment, though not necessarily motivated for systemic reasons, has had results that support such concerns.
The wider FDIC charge added 2.5 to 45 basis points to the costs of large and complex US chartered banks' short-term wholesale funding. The calculation is complex and its result by bank is not disclosed, but the rate for the largest US bank was said to be 8 basis points (Kreicher et al (2013, page 4)). Short-term wholesale funding includes borrowing from other banks, short-term repos, or funding from affiliates outside the United States. With wholesale rates of 10 basis points or less, the new FDIC charge made bidding for such funds and parking them at the Fed at 25 basis points unattractive for many US-chartered banks but not to the US branches of foreign banks, which pay no FDIC fee.
In the event, the Fed's large-scale bond purchases combined with the FDIC charge had the unintended effect of leaving non-US banks' branches and agencies in the United States holding a disproportionate share of excess reserves at the Fed.5 When the Fed buys bonds, it credits a bank with reserves. The receiving bank may pay them out, but some bank in the United States must ultimately hold them.6 In December 2013, foreign bank branches held $0.958 trillion of the $2.249 trillion in reserves at the Fed, or 43% of the total. This share was clearly out of line with their 13% of banking assets in the United States.7
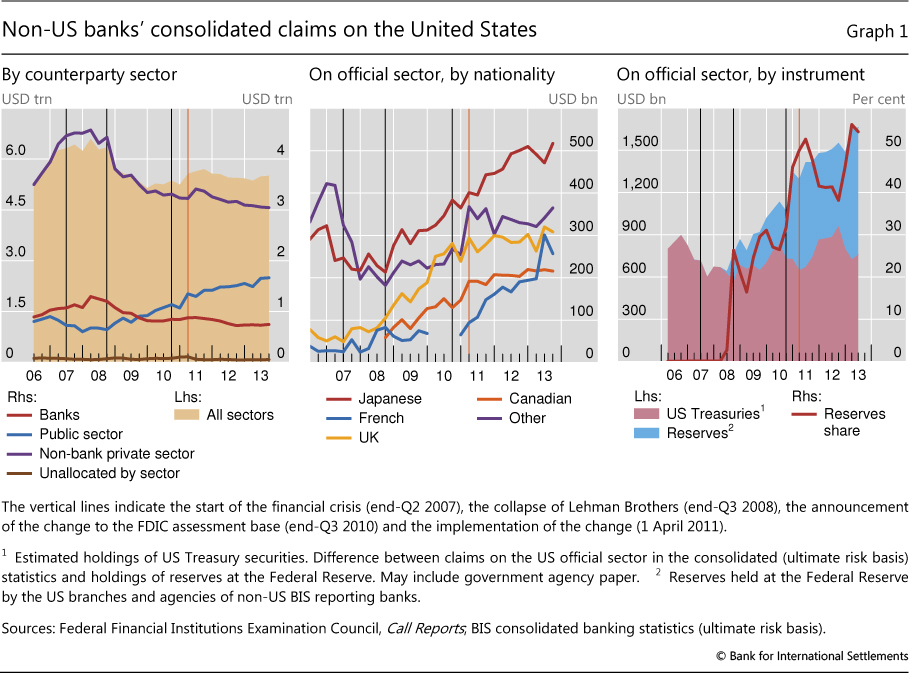
Widening our perspective from the US branch to the consolidated balance sheet of non-US banks, the claims on the Fed drove up their claims on the official sector in the United States. This has tended to offset the post-crisis decline in claims on the US private sector (Graph 1, left-hand panel). Consolidated claims on the non-bank private sector in the United States, including private-label mortgage-backed securities, have declined by about $1.5 trillion since the peak in 2008. Since 2010, an increase in claims on the US official sector has more than offset this decline. Canadian, French, Japanese and UK banks have been especially prominent (Graph 1, centre panel).
Are these non-US banks loading up on Treasury securities? Not much. To illustrate this, Graph 1 combines two data sources: "call reports", which show the claims of non-US banks' US offices on the Federal Reserve, and the BIS consolidated banking statistics (on an ultimate risk basis), which show their worldwide consolidated claims on the US official sector. Note that, in the BIS data, claims on the official sector include both claims on the public sector (ie general government) and claims on the Federal Reserve. Since the global financial crisis, foreign banks have more than doubled their exposure to the US official sector to $1.75 trillion. However, most of this increase reflects overnight claims on the Fed rather than greater holdings of US Treasuries and other bonds (Graph 1, right-hand panel).
Non-US banks' funding of reserves at the Fed
Like US commercial banks in general, non-US banks' branches and agencies in the United States have generally not been selling Treasury and agency bonds to the Fed on a net basis. They thus had to fund their increased holdings of claims on the Fed by other means.
Non-US banks' branches in the United States swap assets
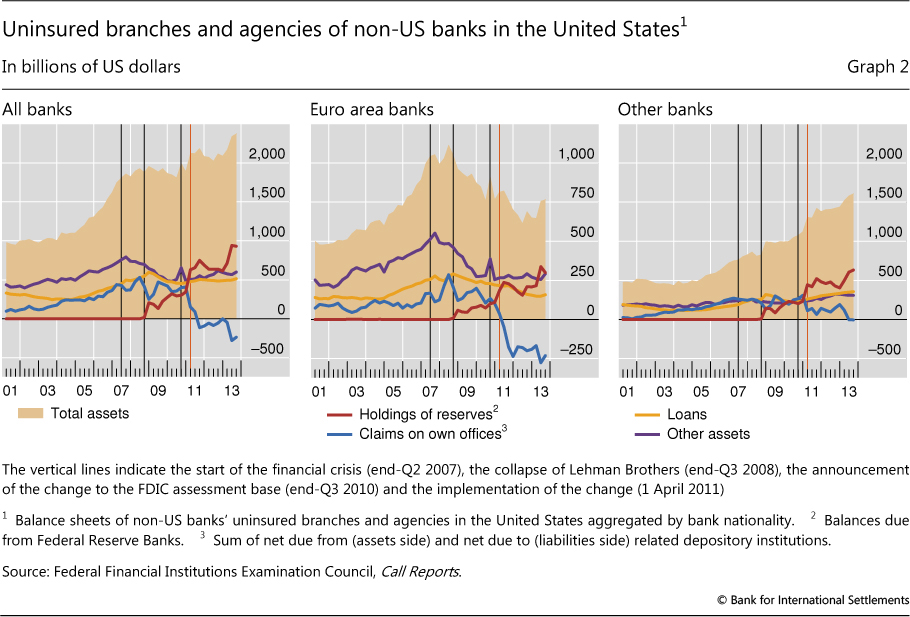
Non-US banks' branches in the United States made room for the claims on the Fed without reducing loans or other assets in aggregate (Graph 2, left-hand panel). Instead, they recalled advances to their affiliates outside the United States (blue line). Even the branches of euro area banks, which shed more than 25% of their assets between 2008 and 2012, built up reserves at the Fed despite the severe funding difficulties they faced in 2011 and 2012 (Graph 2, centre panel).8 The US branches of banks from the rest of the world raised both their US assets and their holdings of excess reserves (Graph 2, right-hand panel).
Prior to the crisis, the US branches of non-US banks operating without FDIC insurance had built up net claims on their own offices outside the United States in excess of $400 billion (Graph 3, left-hand panel). In effect, on top of their intermediation between US lenders and borrowers, these branches borrowed from US money market mutual funds (MMMFs) and others to fund the dollar balance sheets of their parent banks outside the United States (Baba et al (2009)). Following the FDIC regulatory change, they went from being net lenders, to the tune of $400 billion, to net borrowers, by $200 billion by 2013. Counter to the popular metaphor that the Fed's bond buying represented an injection of liquidity that could flow out of the United States, non-US banks' branches brought dollar funds into the United States.
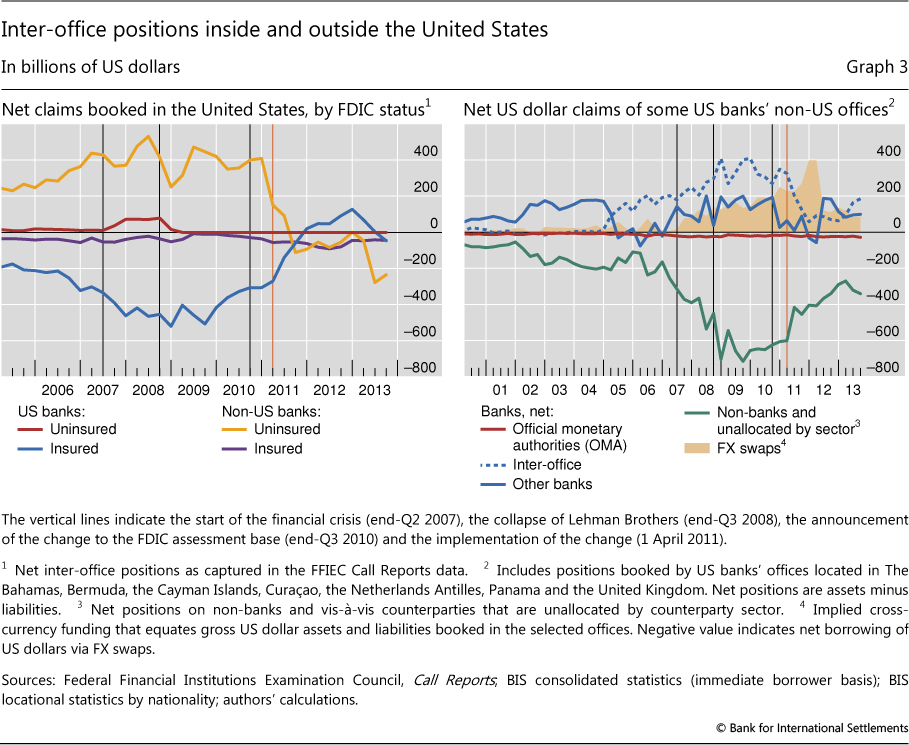
Constrained by the FDIC charge on wholesale funding, US banks moved in an opposite direction: they repaid advances from their foreign offices that now attracted the FDIC charge. Data from the Caribbean banking centres and London show how the US banks managed this. For years, US banks had booked deposits by US firms and funds in their Caribbean and London branches, and had then brought back the funds as wholesale (eurodollar) funding.9 Once such round-tripped funds attracted the same FDIC assessment as domestic deposits, there remained no reason to book the liabilities offshore. In Graph 3 (right-hand panel), both the net liability to non-banks, including large deposits from the US firms and funds (green line), and the net claim on own offices (dashed blue line) contracted sharply in 2011 and thereafter. De facto domestic deposits that US banks had routed through Caribbean and London branches became de jure domestic deposits.
Thus, US-chartered banks could easily repay advances from their foreign branches by rebooking deposits.10 This still leaves the question of how non-US-chartered banks funded their massive flow in the opposite direction (Graph 3, left-hand panel, yellow line). From the standpoint of the US branch, claims on foreign affiliates became reserves at the Fed - a substitution of one asset for another. But from the consolidated non-US bank's standpoint, it had to come up with over $400 billion in dollar funding in a matter of months.
Where did the consolidated non-US banks get the dollars?
How did the consolidated non-US banks raise the dollars outside the United States? They did not raise them by cutting dollar loans to borrowers there.11 More broadly, notwithstanding the deleveraging of European banks, non-US banks increased their overall dollar claims (securities as well as loans) on non-banks outside the United States into the $3-4 trillion range (Graph 4, left-hand panel, blue line). In other words, there was no compression in non-US banks' dollar credit outside the United States that would have freed up funds to repay dollars to their US branches.
Instead, non-US banks seem to have raised the dollars through a combination of increased deposits and increased swapping of other currencies. Their dollar liabilities grew (Graph 4, centre panel), but not sufficiently to support their offshore dollar asset growth even as they repaid and advanced dollars to their US branches.12
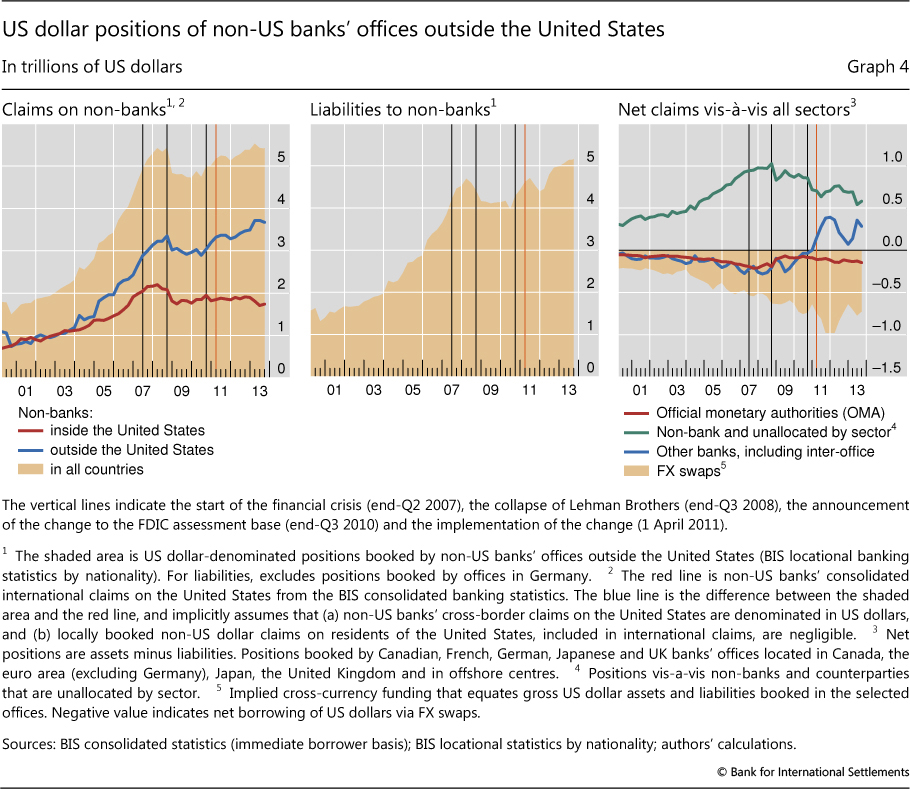
Since banks tend to fully hedge any currency mismatch between their assets and liabilities, we infer that the consolidated non-US banks obtained the remaining dollars through foreign exchange swaps. When we look at Canadian, French, German, Japanese and UK banks' US dollar positions booked at selected offices outside the United States, their net claims on non-banks fell from a peak of roughly $1 trillion to about half that in September 2013 (Graph 4, right-hand panel, green line). But this smaller sum still needed to be funded. Similarly, interbank and inter-office sources of funds (blue line) became a use of funds in 2011 as dollars were shipped back to US branches. With net claims on non-banks, other banks and own offices well in excess of the modest funding from official depositors (red line), we infer that non-US banks relied on foreign exchange swaps, as depicted by the shaded area.13 Apparently, euro, yen and sterling funding was heavily swapped for dollars in 2011, only to recede as dollar liabilities continued to increase.
Looking forward: Fed operational changes
The Federal Reserve is experimenting with a new operational tool - the reverse repo - that could substantially reduce banks' $2.5 trillion (and rising) claims on the Fed, even as the Fed continues to hold its bond portfolio. In a reverse repo, the Fed borrows overnight from a cash-rich counterparty like a money market mutual fund against the security of a bond from the Fed's portfolio, which reached $4.1 trillion on 19 February 2014.
From an aggregate perspective, these operations would necessarily drain banks' holdings of balances at the Fed, in particular those in addition to those needed to meet reserve requirements ("excess reserves"). For some banks, especially US branches of non-US banks, it would reduce any profit to be made by taking in wholesale funds at 10 basis points (or less) and holding reserves at the Fed at 25 basis points. In effect, the new operations disintermediate the banks that have done this low-risk trade (Graph 5).
This possibility was demonstrated by operations over the turn of the year. On the last day of 2013, 102 eligible counterparties lent the Fed $198 billion at a rate of 3 basis points. According to Crane Data, MMMFs accounted for $139 billion, or 70% of this amount. Lower-risk Treasury and government MMMFs allocated 7% of their assets to the Fed repos, while the higher-risk "prime" funds (ie those invested in corporate and especially bank securities) allocated 5%. Grossman et al (2014) report that the 10 largest prime MMMFs invested 3.7% of their assets in the Fed repos at the end of 2013 while their allocation to European banks' debt fell by a matching 3.8% in December. This experience is consistent with a shift from the first row in Graph 5 (before) to the middle row, in which the MMMF places funds directly with the Fed (after).14
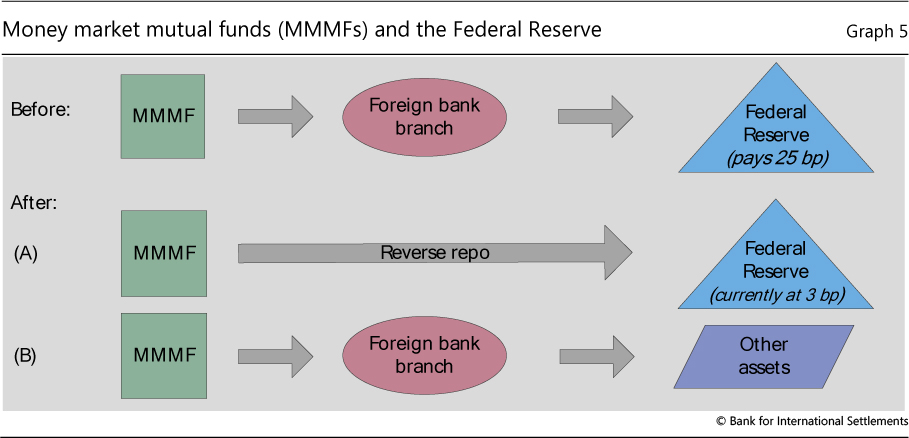
Going forward, however, only lower-risk MMMFs can devote much of their portfolio to repos with the Fed. That is, Treasury and government MMMFs might devote much of their portfolios to very safe, overnight placements with the Fed. But prime MMMFs' mandates require them to seek higher returns by taking on yield curve and especially credit risk. Hence, for prime funds the last row of Graph 5 is more likely: the MMMF continues to fund the foreign bank branch which in turn finds another dollar asset if the Fed drains away the excess reserves.
Under the scenario in the last row, heavy Fed reliance on reverse repo operations to drain reserves would leave non-US banks with their funding from MMMFs but would take away their claims on the Fed. Should a reflow of dollar funds out of the United States by non-US banks be expected: the asset substitution in reverse? How might the funds be deployed? Just as the uptake of claims on the Fed by branches of banks headquartered outside the United States led to large changes in the global dollar flow of funds, so too could the Fed's draining of its excess reserves.
Conclusions
We have shown how seemingly small differences in regulation across banks from different jurisdictions can trigger huge and rapid adjustments in bank behaviour and balance sheets. In the process, we have underscored the importance of distinguishing a branch-specific (residence-based) behaviour from the behaviour of the consolidated entity. And finally, when - through some combination of repos with non-banks and reduction of its bond portfolio - the Fed extinguishes a large stock of bank claims on itself, the resulting flows of funds bear watching.
References
Anderson, R and J Duca (2014): "Money demand and the liquidity accelerator in an era of financial uncertainty and innovation", processed, January.
Baba, N, R McCauley and S Ramaswamy (2009): "Dollar money market funds and non-US banks", BIS Quarterly Review, March, pp 65-81.
Bank for International Settlements (2013): "Global liquidity: selected indicators", update of a note prepared for the April 2013 G20 meetings in Washington DC, 7 October.
Correa, R, H Sapriza and A Zlate (2012): "Liquidity shocks, dollar funding costs and the bank lending channel during the European sovereign crisis", Board of Governors of the Federal Reserve System, International Finance Discussion Papers, no 1059, November.
Ennis, H and A Wolman (2012): "Large excess reserves in the US: a view from the cross-section of banks", Federal Reserve Bank of Richmond, Working Papers, no 12-05, August.
Grossman, R, K D'Albert and J Boise (2014): "US money fund exposure and European banks: decline as Fed tests 'reverse repo'", FitchRatings Macro Credit Research, 4 February.
Kreicher, L, R McCauley and P McGuire (2013): "The 2011 FDIC assessment on banks' managed liabilities: interest-rate and balance-sheet responses", BIS Working Papers, no 413, May.
Martin, A, J McAndrews and D Skeie (2011): "A note on bank lending in times of large bank reserves", Federal Reserve Bank of New York, Staff Reports, no 497, May.
McGuire, P and G von Peter (2009): "The US dollar shortage in global banking", BIS Quarterly Review, March, pp 49-63.
Shin, H S (2010): "Non-core liabilities tax as a tool for prudential regulation", policy memorandum, 19 February.
1 The authors would like to thank Claudio Borio, Dietrich Domanski, Lawrence Kreicher and Christian Upper for comments and Angelika Donaubauer for assistance. The views expressed are those of the authors and do not necessarily reflect those of the BIS.
2 Reserves at the Federal Reserve reached $2.6 trillion by 19 February 2014.
3 Except for those few grandfathered under the Federal Deposit Insurance Corporation Improvement Act of 1991.
4 Note that deposit insurance only extends to the first $250,000 of a large deposit, so that insured banks do not gain much from insurance when competing for large deposits.
5 Kreicher et al (2013) note that non-US bank branches in the United States took less than a third of the rise in claims on the Fed during the first round of bond buying between September 2008 and March 2010 but two thirds in the second round of bond buying between September 2010 and mid-2012 that included the new FDIC levy on wholesale funding. For an analysis of the distribution of Fed reserves across US-chartered banks, see Ennis and Wolman (2012).
6 Some non-banks (eg Fannie Mae) can hold unremunerated claims on the Fed, but these are small.
7 Banks headquartered outside the United States had subsidiaries in the United States with assets about half those of the branches and agencies of foreign banks, and their claims on the Fed pushed the overall share of non-US banks' holdings of reserves above 50% in the second quarter of 2013. This fell back to 45% in the third quarter.
8 While some euro area banks may have sought at times to reassure wholesale lenders by pointing to their holdings at the Fed, the overall funding squeeze on them arguably limited their increase of holdings at the Fed. See Correa et al (2012).
9 While it is not possible to simultaneously identify the nationality and location of the bank together with the location of the counterparty, the BIS locational banking statistics by residency - which do not include a breakdown by bank nationality, but do include information on the location of the counterparty - suggest that the bulk of the liabilities to non-banks booked by banks located in the Caribbean were vis-à-vis counterparties in the United States.
10 The rebooking of these deposits from offshore branches onshore helped to boost the deposits of particularly the largest US banks (Kreicher et al (2013, Graph 5, right-hand side)) as well as US M2 (Anderson and Duca (2014, page 22)).
11 See BIS (2013, Graph I.3). See Martin et al (2011) for the argument that holding reserves at the Fed potentially competes with loans.
12 This amounts to assuming that banks fully hedge the currency mismatch of their assets and liabilities. Note that much of the shift in the blue line in Graph 4 (right-hand panel) is the result of changes in inter-office positions. However, several reporting jurisdictions do not provide a clean break between inter-office positions and positions vis-à-vis other banks, and thus they have been combined into a single line in Graph 4.
13 See McGuire and von Peter (2009) for discussion of European banks' US dollar funding positions.
14 To be sure, there was an element of window-dressing at the turn of the year, with banks restricting their wholesale funding at year-end and driving MMMFs to the Fed facility, which option kept repo and other short-term rates from turning negative. As of 19 February, the Fed reverse repo stood at just $83 billion.