The bond benchmark continues to tip to swaps
By the 1990s, basis risk had caused bond markets, like money markets before them, to start shifting from the use of government rates as benchmarks to the use of private ones. Developments since the Great Financial Crisis of 2007-09, including derivatives reforms and Libor scandals, had the potential to disrupt this shift. Yet BIS data on derivatives turnover indicate that interest rate swaps continue to gain on government bond futures for hedging and positioning at the long end of the yield curve. However, the ease of unwinding positions in futures may stop swap rates from completely displacing government bond rates as benchmarks.1
JEL classification: G12, G15.
Money and bond markets function most efficiently when market participants agree on certain instruments that serve as references - or benchmarks - for the pricing of other securities. Historically, government securities played this role, yet in money markets they were displaced by private instruments as benchmarks as early as the 1980s. In bond markets, from the 1990s up until the 2007-09 Great Financial Crisis (GFC), evidence had accumulated that the benchmark was shifting from government to private rates, in particular interest rate swaps (IRS). Since then, several developments have had the potential to disrupt the shift. This feature examines what the latest BIS data show about the shift to private benchmarks, through the lens of the turnover of derivatives on long-term interest rates.
Since the GFC, one development that had the potential to undermine confidence in the use of swap rates as benchmarks was revelations of self-dealing in the setting of Libor and other interbank rates, which are the bases for the floating rate leg of IRS. Another was a greater dispersion of banks' creditworthiness, a development that could have increased the risk of idiosyncratic movements in interbank rates. A third noteworthy development was that negative rates in European and Japanese money markets might have reduced the effectiveness of IRS as hedges to the extent that banks could not pass on negative rates to depositors. Finally, the move of IRS to organised markets and central counterparties potentially increased their costs and so diminished their attractiveness.
At the same time, countervailing factors may have made government bond rates less attractive as benchmarks. Periodic episodes of flight to quality led to sharp gapping in government and private interest rates. Such episodes made market participants acutely aware of basis risk - the risk of a divergence in the prices of two related instruments, such as a long position in a corporate bond hedged by a short position in a government bond future. Electronic trading and central clearing of swaps might have reduced the credit and collateral frictions in IRS and thereby undermined the corresponding advantages of the exchange-based trading of government bond futures relative to the over-the-counter (OTC) trading of IRS.
We find that, while the shift from government bond futures to swaps has slowed since 2007-09, it has not stopped. The role of basis risk in the shift from one benchmark to another is highlighted in the next section. We then explain why we use derivatives turnover to identify the benchmark and compare bond benchmarks around the world. The penultimate section examines data on bond derivatives for eight currencies over 21 years. The conclusion considers where the shift ends.
Benchmark tipping and the role of basis risk
"Tipping" refers to a social process whereby the self-reinforcing effect of individual choices causes the aggregate outcome to shift from the preponderance of one practice to another. The more people who adopt the new practice, the greater the incentive for any individual to adopt it as well (Schelling (1978)). In financial markets, a benchmark tips when market participants find it advantageous to switch from one instrument to another, in line with the preponderant choice of others. We argue that, in fixed income markets, basis risk in times of crisis sets off the tipping process.
The tipping process is exemplified by the shift from Treasury bill to interbank rates in the US dollar money market in the 1980s and 1990s. Futures contracts on Treasury bill rates enjoyed a big head start over those on offshore (eurodollar) deposits. Yet eurodollar rates quickly supplanted Treasury bill rates as the benchmark when measured by the turnover of futures contracts (Graph 1, right-hand panel). The bill future died in 2003.
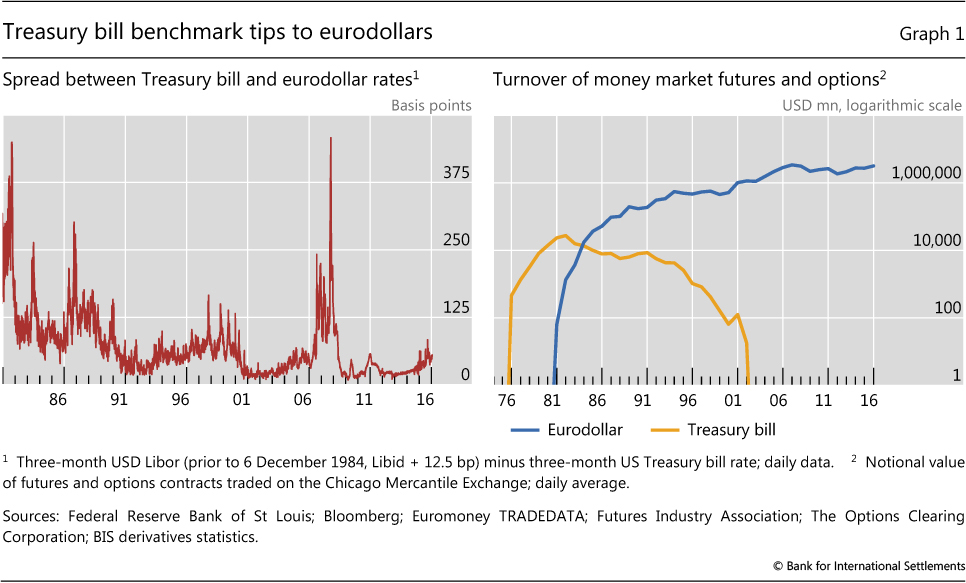
What encouraged market participants to abandon Treasury bill futures in favour of eurodollar futures was basis risk. In the US dollar money market, a key indicator of basis risk is the Treasury-eurodollar (TED) spread. As shown in the left-hand panel of Graph 1, the TED spread rose sharply during periods of market stress: for example, in August 1982, with the onset of the Latin American debt crisis; in May 1984, during the Continental Illinois crisis; in October 1987, when the stock market sold off; in late 1990, when US corporate defaults rose; and in August-September 1998, following Russia's default and the near collapse of Long-Term Capital Management (LTCM). On these occasions, hedges of Libor-based positions with Treasury bill futures proved to be ineffective, or worse. In the extreme, a flight to quality episode could inflict losses on both sides of the intended hedge, as long positions linked to Libor and short positions in US Treasury bill futures both lost value.
The more market participants who shifted, the more who were encouraged to do likewise in response to the ebb of liquidity out of Treasury bill futures and its flow into eurodollar futures. As liquidity ebbs, price changes may increasingly reflect order imbalances rather than new information, adding basis risk and so reinforcing the incentive to shift. The converse holds for those contracts gaining liquidity.
In bond markets, the equivalent of the TED spread is the swap spread: the difference between, say, the 10-year fixed rate on interest rate swaps and the 10-year government bond yield. Like the TED spread, US dollar and euro swap spreads have at times spiked, inflicting substantial losses on supposedly hedged portfolios. Spikes occurred at the time of Drexel Burnham Lambert's bankruptcy in early 1990, the US bond market sell-off of 1994, the Asian financial crisis of 1997, the Russian and LTCM events of August- September 1998, and corporate credit strains around the bursting of the tech bubble in 2000 (Graph 2, left-hand panel). Indeed, already by the early 2000s, the frequency of spikes in swap spreads was pointing to the likelihood that the bond benchmark would tip from government rates to swaps (McCauley (2001, 2002), Remolona and Wooldridge (2003)).
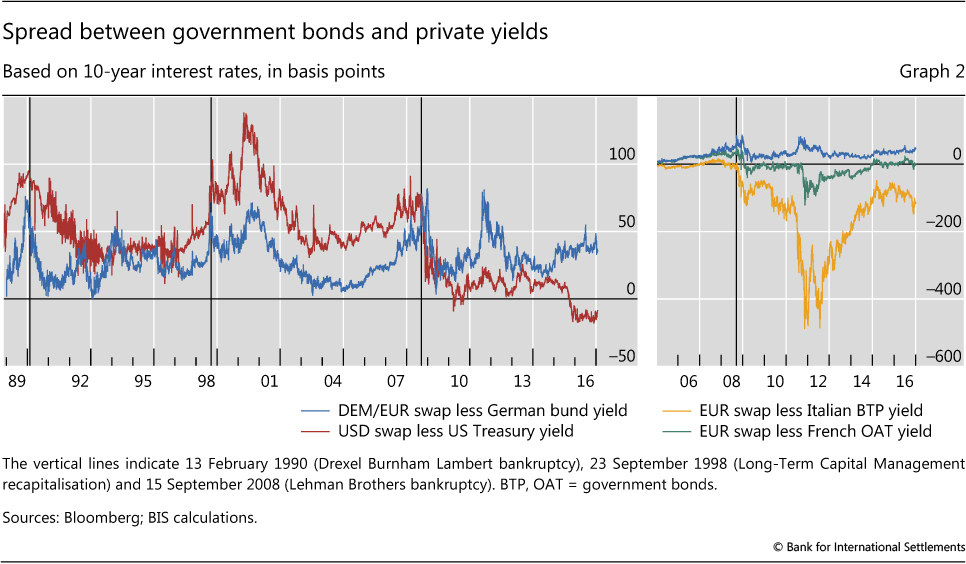
Since 2007, recurring experience of basis risk strengthened the incentive for market participants to reconsider their choice of instrument for hedging and positioning. The GFC saw swap spreads widen on the back of an unprecedented loss of creditworthiness on the part of major swap dealers and flight to quality (Graph 2, left-hand panel). The European sovereign strains of 2011 led to sharp increases in euro swap spreads as well as a pronounced decoupling of spreads across countries (Graph 2, right-hand panel). And in 2015, the US dollar swap spread turned puzzlingly negative (Sundaresen and Sushko (2015), Ehlers and Eren (2016)).
Tracking the tipping process
To gauge the shift from one benchmark to another, our preferred measure is the turnover of interest rate derivatives. Trading activity directly reveals market participants' preferred instrument for hedging and positioning. Furthermore, turnover tends to be closely correlated with other measures of market liquidity: for example, high turnover often accompanies narrow bid-ask spreads (CGFS (1999a)).2
Ideally, the turnover of all relevant instruments should be compared, whether traded in cash markets or derivatives markets. However, the liquidity of derivatives can be seen as a proxy for the liquidity of the underlying instruments. Derivatives markets ease hedging and positioning, and therefore their development enhances the liquidity of related cash markets (CGFS (1999b)).
Furthermore, data on derivatives turnover are more readily available than data on cash transactions, as well as being more comparable across countries. The BIS compiles monthly data on the turnover of futures and options on organised exchanges (BIS (2015)). It also collects data on the turnover of OTC derivatives in the Triennial Central Bank Survey of foreign exchange and OTC derivatives markets (BIS (2016)). Unlike in money markets, where derivatives referencing interbank rates are traded heavily on exchanges, in bond markets derivatives referencing interbank rates are traded overwhelmingly over the counter. Almost without exception, bond derivatives traded on exchanges are referenced to a government rate.
The available data have two shortcomings, however. First, the Triennial Central Bank Survey is conducted only in April of every third year. Higher-frequency data would make it easier to distinguish between structural changes and short-term cyclical developments. That said, the cross section of currencies collected in the Triennial Survey helps to highlight global trends. A second shortcoming is that the OTC data are not available by maturity. IRS referencing long-term interest rates are grouped together with overnight index swaps (OIS) and other short-term swaps. Although OIS account for a sizeable share of total swap turnover, estimates for three currencies, including the euro and the US dollar, suggest that conclusions based on the reported swap data are robust to adjustments for OIS turnover (see box).
Bond benchmarks around the world
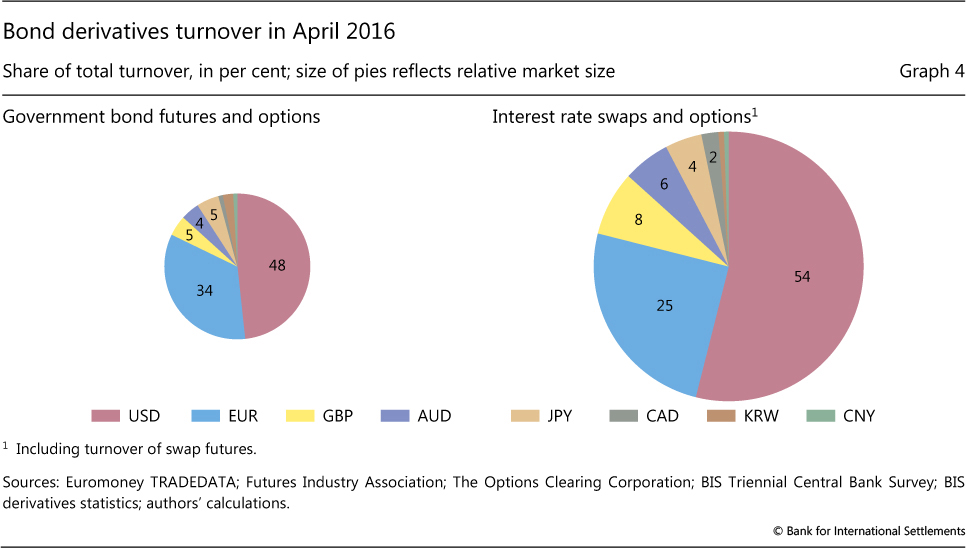
Looking around the world, the latest data point to swaps as the established benchmark for long- term interest rates. In April 2016, the daily average turnover of interest rate swaps and options was $2.0 trillion, compared with $0.5 trillion for government bond futures and options. Even if OIS account for as much as half of swap trading, aggregate turnover shows that bond derivatives are mainly referenced to swap rates.
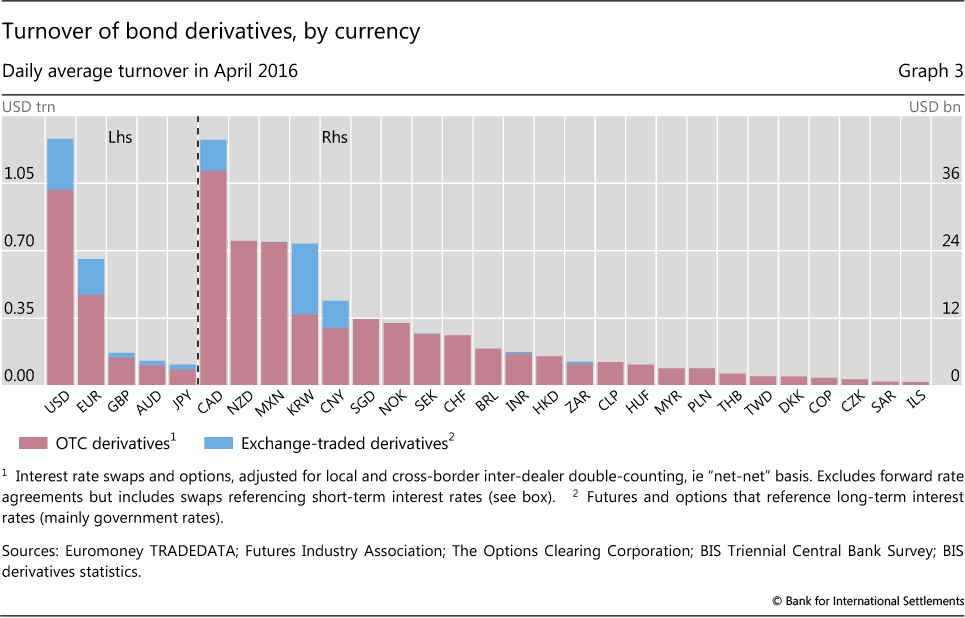
The dominance of IRS is even more evident in the disaggregated data. Whereas over 30 currencies have OTC markets for interest rate swaps, only 15 have government bond futures (Graph 3). If inactive markets are excluded, namely those where turnover averaged less than $1 billion per day in April 2016, then 27 currencies have active IRS markets but only eight have active bond futures. Notably, even for currencies with active bond futures, swaps predominate, as shown in Graph 4, which plots turnover in government futures and IRS to scale.
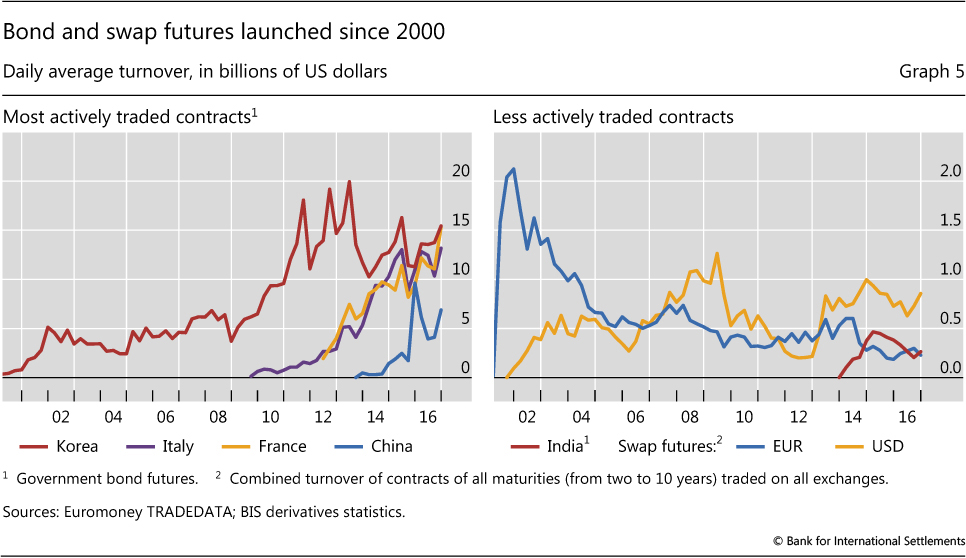
Since the year 2000, futures exchanges have launched contracts on a number of emerging market government bonds. However, only those for China and Korea are actively traded (Graph 5, left-hand panel). Futures on Indian government bonds have been launched no fewer than three times, but none has succeeded yet (Graph 5, right-hand panel, which shows the last of the three). Kreicher et al (2014) demonstrate that the absolute size of the bond market and per capita GDP explain which countries have active bond futures.
The most successful of the new government bond futures are reincarnations of previous contracts on French and Italian government bonds. Prior to the introduction of the single currency in 1999, both French and Italian bond futures, together with Spanish bond futures, traded actively in local markets. Once euro area bond yields converged, the basis risk for French and Italian bonds converged to that for German bunds. Consequently, liquidity flowed to the more actively traded bund futures and, more so, to euro-denominated swaps.
Basis risk in the euro-denominated markets returned with a vengeance during the GFC and the 2011 European sovereign strains. Sovereign spreads widened against euro-denominated swaps and German bund yields (Graph 2, right-hand panel). This impaired the effectiveness of euro-denominated swaps and bunds for hedging and positioning in French and Italian debt: not only government bonds, but, owing to the sovereign-bank nexus, bank and corporate debt too. Eurex launched futures on Italian government bonds in 2009 and French ones in 2012, and they quickly joined the ranks of the most actively traded government bond futures (Graph 5, left-hand panel). That said, as of April 2016, their combined daily turnover remained a fraction of that of German government bond contracts: $20 billion equivalent, compared with $143 billion equivalent.
The shift from government futures to swaps: 1995-2016
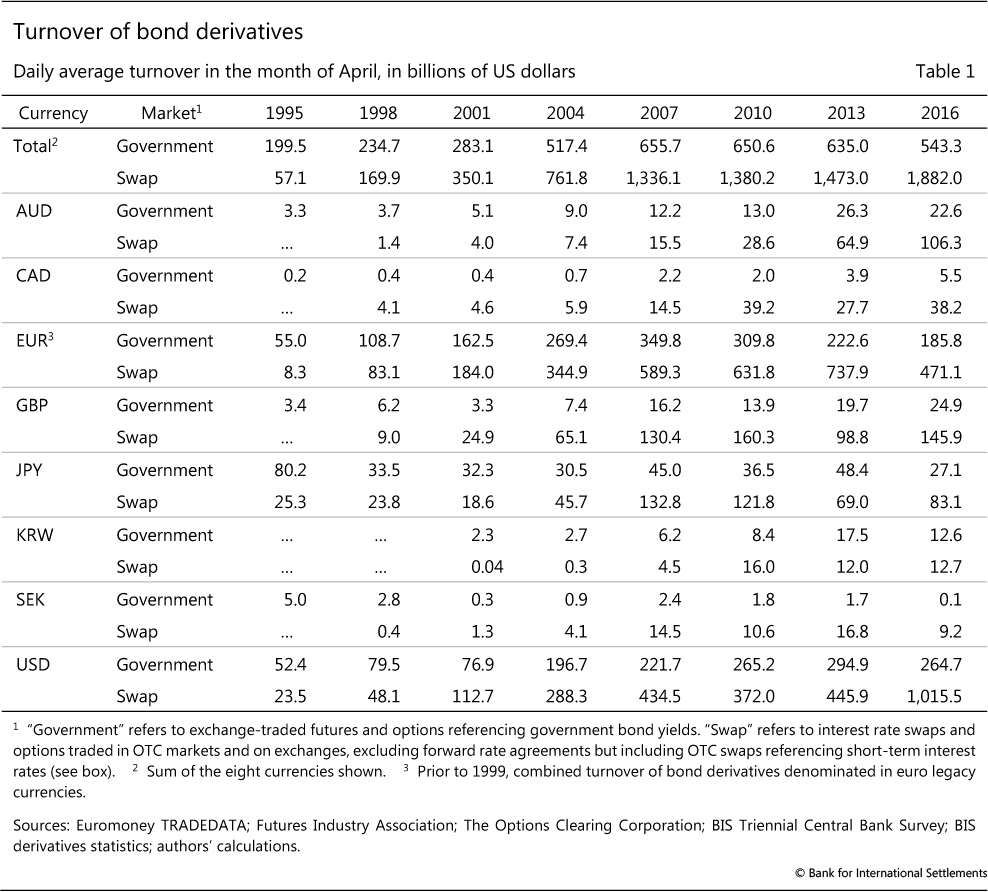
Thus, the cross-sectional view confirms that, by 2016, swap rates were the preponderant choice for a bond benchmark. To test whether developments since the GFC have disrupted the tipping process, we focus on eight currency segments that have had active government bond futures, including the Swedish krona (which once had an active market) but excluding the renminbi (which was introduced only in 2013). For these, we observe turnover in OTC markets and organised exchanges as many as eight times from 1995 to 2016 (Table 1). Graph 6 plots the turnover of government bond futures and options as a share of the total turnover of all bond derivatives (exchange-traded and OTC; futures, swaps and options). The left-hand panel shows the government bond futures share for each of the eight currencies, and the right-hand panel shows the aggregate share, calculated by summing the numerators and denominators across the eight currencies.
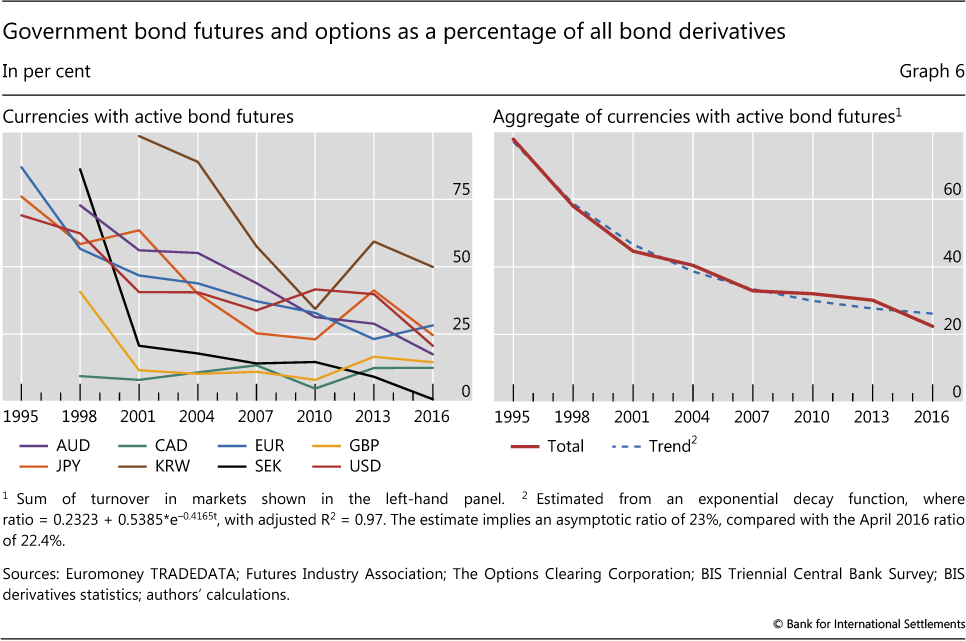
Overall, the declining government bond futures shares point to a continued shift to private benchmarks since the GFC. Evidently, the repeated experience of basis risk continued to drive the share of government bond futures and options lower. The most pronounced shift occurred in the Swedish krona market, where trading in government bond futures, which up to 2012 had exceeded that in Canadian government bond futures, died in 2016.
The overall trend suggests that neither the Libor scandal nor derivatives reforms following the GFC reduced the attractiveness of IRS as bond benchmarks. Revelations of self-dealing in setting Libor had the potential to undermine market participants' confidence in swap rates as measures of prevailing yields. However, the continued growth of swap trading is inconsistent with a loss of confidence; on the contrary, market participants appear to have taken reassurance from the reforms designed to reduce opportunities for abuse (FSB (2014)).
Likewise, whereas derivatives reforms had the potential to increase transaction costs in OTC markets, experience to date with swap futures indicates the opposite. Historically, exchanges had the advantage of centralised trading and, through their use of central counterparties, simpler counterparty risk management. Innovations in OTC markets since the GFC, such as central clearing, trade compression and swap execution facilities, have reformed them along the model of exchanges (Ehlers and Eren (2016), McCauley and Wooldridge (2016)). These changes, coupled with the advantage that OTC markets have in accommodating customised demands, have so far kept IRS trading from tipping from OTC markets to exchanges. Exchanges first introduced swap futures in 2001, when market participants were concerned about the shrinkage of government bond markets. Soon thereafter, the turnover of euro-denominated swap futures traded in London peaked at around $2 billion per day. By 2016, it had fallen to about $0.3 billion (Graph 5, right-hand panel). The creation of a dedicated swap exchange, Eris, in 2013 boosted the turnover of US dollar-denominated swap futures. Yet in 2016, it was still less than $1 billion per day.
Notwithstanding the overall downward trend in the share of government futures in bond derivatives, the shift has proceeded more slowly and unevenly since the GFC than it did over the 1995-2007 period. As shown in the left-hand panel of Graph 6, the tipping towards swaps temporarily reversed in the US dollar market in 2010; in the Canadian dollar, Korean won and sterling markets in 2013; and in the euro market in 2016. Considering the decoupling of European sovereign yields in recent years, and the associated multiplication of euro area bond futures offerings discussed above, the reversal of the share for the euro fits well with the explanation that the tipping process is driven by basis risk. But basis risk cannot explain all of the heterogeneity.3
The decline in banks' creditworthiness following the GFC may explain some. In particular, in the US dollar market in 2010, before derivatives reforms took effect, concerns about counterparty risk could plausibly have boosted the trading of government bond futures relative to bilateral OTC deals with and between banks.
The diversity of market participants is also a likely explanation of some of the heterogeneity. Some participants might prefer or be required to transact in particular markets, and their share of activity is likely to differ across currencies and over time. For example, the non-deliverability of the Korean won may segment liquidity between the onshore and offshore swap markets, and thereby boost the futures market. Yield-seeking international investors may have a larger influence on the evolution of trading in the Australian dollar market than in other markets.
In conclusion: the persistence of futures trading
Over a period of two decades, the benchmark in bond markets, as in money markets before them, has tipped from government rates to private swap rates. Developments since the Great Financial Crisis of 2007-09 slowed this shift but did not stop it.
The evidence also suggests that government bond futures may play a complementary role and find a floor that is not far below their current 23% share of all bond derivatives. Unlike in money markets, swaps have not completely displaced government bond futures. In the Canadian dollar and sterling markets, government bond futures have persisted for many years with a low share of total bond derivatives trading, although the same is not true of futures in the Swedish krona market.
Particular uses and market participants will tend to keep government bond futures alive. Government bond futures may remain useful to active asset managers as hedges for government bond portfolios and as tools for pure interest rate risk positioning. For market-makers, such futures may remain the most cost-effective hedge for transitory customer-driven positioning in bonds.
References
Bank for International Settlements (2013): "Triennial Central Bank Survey: OTC interest rate derivatives turnover in April 2013: preliminary global results", September.
----- (2015): "Introduction to BIS statistics", BIS Quarterly Review, September, pp 35-51.
----- (2016): "Triennial Central Bank Survey: OTC interest rate derivatives turnover in April 2016", September.
Borio, C, R McCauley, P McGuire and V Sushko (2016): "Covered interest parity lost: understanding the cross-currency basis", BIS Quarterly Review, September, pp 45-64.
Committee on the Global Financial System (1999a): "Market liquidity: research findings and selected policy implications", CGFS Papers, no 11, May.
----- (1999b): "How should we design deep and liquid markets? The case of government securities", CGFS Papers, no 13, October.
Ehlers, T and E Eren (2016): "The changing shape of interest rate derivatives markets", BIS Quarterly Review, December, pp 53-65.
European Central Bank (2015): Euro money market survey, September.
----- (2016): "The launch of money market statistical reporting", ECB Economic Bulletin, no 5, pp 24-5.
Financial Stability Board (2014): "Reforming major interest rate benchmarks", 22 July.
Fleming, M, J Jackson, A Li, A Sarkar and P Zobel (2012): "An analysis of OTC interest rate derivatives transactions: implications for public reporting", Federal Reserve Bank of New York, Staff Reports, no 557, October.
Kreicher, L, R McCauley and P Wooldridge (2014): "Benchmark tipping in the global bond market", BIS Working Papers, no 466, October.
McCauley, R (2001): "Benchmark tipping in the money and bond markets", BIS Quarterly Review, March, pp 39-45.
----- (2002): "International market implications of declining Treasury debt", Journal of Money, Credit and Banking, vol 34, no 3, part 2, pp 952-66.
McCauley, R and P Wooldridge (2016): "Exchanges struggle to attract derivatives trading from OTC markets", BIS Quarterly Review, September, pp 33-4.
Remolona, E and P Wooldridge (2003): "The euro interest rate swap market", BIS Quarterly Review, March, pp 47-56.
Schelling, T (1978): Micromotives and macrobehavior, Norton.
Sundaresen, S and V Sushko (2015): "Recent dislocations in fixed income derivatives markets", BIS Quarterly Review, December, pp 8-9.
Disentangling overnight index swaps from interest rate swaps
The BIS data on swap turnover comprise contracts referencing both short- and long-term interest rates. If short-term contracts were to account for a growing proportion of swap turnover, then it would cast doubt on our key finding that longer-term swaps are displacing government bonds as the benchmark. Using other sources to separate short- from long-term swaps, this box finds that the rise in swap trading is indeed driven by long-term, not short-term, contracts.
The Triennial Central Bank Survey does not identify the type or maturity of interest rate swaps (IRS). IRS thus include overnight index swaps (OIS), where a fixed rate is exchanged for the average value of an overnight rate, as well as basis swaps, where two floating rates are exchanged. Such swaps typically have very short maturities. According to ECB (2015) and Fleming et al (2012), almost all OIS mature within one year, although some have longer maturities.
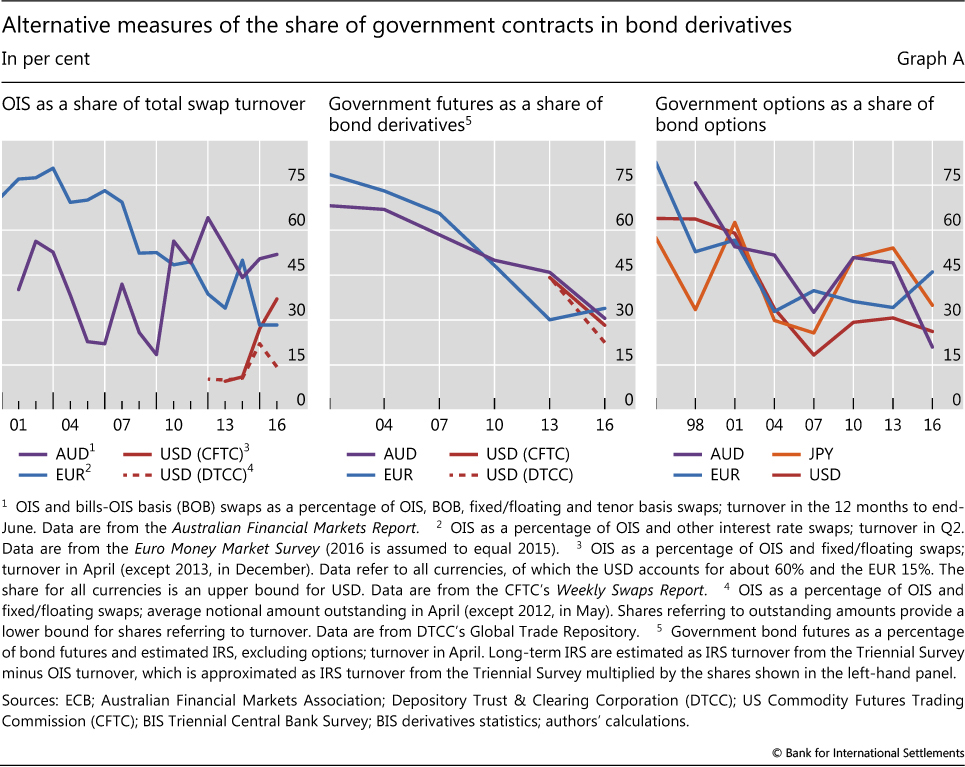
The OIS share of swap turnover varies (Graph A, left-hand panel). The share of OIS in Australian dollar-denominated swap turnover has fluctuated between 20 and 60% since 2000, with no trend. By contrast, that of euro-denominated OIS declined from a high of around 80% in 2003 to less than 30% in 2015, with a new survey from the ECB (2016) suggesting that turnover remains low. Data for the US dollar segment, available only since 2013's mandatory trade reporting and mainly covering US activity, show that the share increased from about 10% in 2013-14 to 15-35% in 2015-16, depending on the source.
When estimated OIS turnover is subtracted from total swap turnover, our finding that swaps are displacing government bonds as the benchmark for long-term rates remains intact. A trend decline in the share of government bond futures in the estimated turnover of bond derivatives is still evident (Graph A, centre panel). Between 2013 and 2016, this share fell from about 45% to 30% in the Australian dollar and US dollar markets, and stabilised at around 30% in the euro market.
Developments in options markets show a less clear picture. In OTC markets interest rate options typically reference long-term swap rates, while on exchanges they reference short-term rates. Therefore, OIS pose less of a problem to the interpretation of options data than swap data. The share of options referencing government rates fell sharply up to 2007 but then reversed (Graph A, right-hand panel). In 2016, the trend decline resumed, except for the euro.
1 Lawrence Kreicher is Visiting Professor of Economics, Dartmouth College; Robert N McCauley is Senior Adviser, Monetary and Economic Department, BIS; and Philip D Wooldridge is Head of International Banking and Financial Statistics, Monetary and Economic Department, BIS. The authors thank Claudio Borio, Benjamin Cohen and Hyun Song Shin for comments, and Kristina Bektyakova and Denis Pêtre for research assistance. The views expressed are those of the authors and do not necessarily reflect those of the BIS.
2 Market liquidity has three dimensions: tightness, which is the difference between buying and selling prices; depth, which measures the size of trades possible without moving market prices; and resiliency, which denotes the speed at which prices return to normal following temporary order imbalances. Average turnover in a given time period indicates the order flow that a market typically accommodates and, as such, provides some indication of depth.
3 The quality and completeness of data on turnover in OTC markets have improved over time, which may have contributed to the heterogeneity. For example, methodological changes in the 2013 Triennial Central Bank Survey ensured more complete coverage of activity in emerging market and other less traded currencies (BIS (2013)).