FX swaps and forwards: missing global debt?
What would balance sheets look like if the borrowing through FX swaps and forwards were recorded on-balance sheet, as the functionally equivalent repo debt is? We combine various data sources to estimate the size, distribution and use of this "missing" debt and to begin to assess its implications for financial stability. A key finding is that non-banks outside the United States owe large sums of dollars off-balance sheet through these instruments. The total is of a size similar to, and probably exceeding, the $10.7 trillion of on-balance sheet dollar debt. Even when this debt is used to hedge FX risk, it can still involve significant maturity mismatches.1
JEL classification: F31, F34, F41.
Every day, trillions of dollars are borrowed and lent in various currencies. Many deals take place in the cash market, through loans and securities. But foreign exchange (FX) derivatives, mainly FX swaps, currency swaps and the closely related forwards, also create debt-like obligations. For the US dollar alone, contracts worth tens of trillions of dollars stand open and trillions change hands daily. And yet one cannot find these amounts on balance sheets. This debt is, in effect, missing.
As a result, we know little about it. How much is owed, by whom and for what purpose: trade hedging, asset-liability management, market-making? What does it imply for measures of international credit like the BIS global liquidity indicators (GLIs)? Answers to these questions can inform assessments of global financing conditions and financial stability. For instance, serious strains seized the FX swap market during the Great Financial Crisis (GFC). In response, central banks had to replace lost dollar funding that financed dollar assets (McGuire and von Peter (2009), BIS (2017)).
This special feature frames the issues and suggests some answers. To do so, it breaks ground in combining data on the aggregate amount of outstanding derivatives contracts (from the BIS derivatives statistics) with information from the international banking statistics and from ad hoc surveys to form a view of the size, geography and use of the missing foreign currency debt. The more detailed analysis focuses on the dollar segment, given the currency's outsize role in the foreign exchange and other financial markets.
The debt remains obscured from view. Accounting conventions leave it mostly off-balance sheet, as a derivative, even though it is in effect a secured loan with principal to be repaid in full at maturity. Only footnotes to the accounts report it.
Focusing on the dominant dollar segment, we estimate that non-bank borrowers outside the United States have very large off-balance sheet dollar obligations in FX forwards and currency swaps. They are of a size similar to, and probably exceeding, the $10.7 trillion of on-balance sheet debt. On the other side of the ledger, as much as two thirds of the dollar-denominated bonds issued by non-US residents could be hedged through similar off-balance sheet instruments. That fraction seems to have fallen as emerging market borrowers have gained prominence since the GFC.
The implications for financial stability are hard to assess. This requires a more granular analysis of currency and maturity mismatches than the available data allow. Much of the missing dollar debt is likely to be hedging FX exposures, which, in principle, supports financial stability. Even so, rolling short-term hedges of long-term assets can generate or amplify funding and liquidity problems during times of stress.
The first section recalls the relationship between FX swaps, currency swaps and forwards as well as their accounting treatment, explaining how the missing debt arises. The second takes a bird's eye view of the aggregate market, including its instruments, currencies and counterparties. The third relates aggregate market data to the hedging of trade and the asset-liability management of non-banks. The fourth delves into banks' role, tracing banking systems' post-GFC reliance on the market for funding. The fifth estimates adjustments to the GLIs.
Accounting treatment, data sources and gaps
Three closely related instruments allow off-balance sheet foreign currency borrowing and lending: FX swaps, currency swaps and (outright) forwards. In an FX swap, two parties exchange two currencies spot and commit to reverse the exchange at some pre-agreed future date and price. Currency swaps are like FX swaps, except that the two parties agree to exchange both principal and interest payment streams over a longer term. FX swaps mature within a year (providing "money market" funding); currency swaps have a longer maturity ("capital market" funding). A forward is a contract to exchange two currencies at a pre-agreed future date and price. After a swap's spot leg is done, what is left is the agreed future exchange - the forward leg.
These transactions are functionally equivalent to borrowing and lending in the cash market. Yet the corresponding debt is not shown on the balance sheet and thus remains obscured. To see why, consider three deals that highlight the functional similarity and accounting differences. The box goes step by step; here we summarise.
An investor wants to buy a foreign currency security with domestic cash but does not wish to run FX risk. Then, three transactions are equivalent. The agent may:
- combine a spot and forward FX deal, ie buy the required FX spot, purchase the security and sell the same amount of FX forward;
- use an FX swap, ie swap the domestic currency for the foreign currency and purchase the security;
- keep the domestic cash and finance the security by borrowing in the foreign repo market, incurring outright debt.
Accounting for FX swaps, forwards and repurchase agreements: a simple analysis
This box explains how the accounting treatment of borrowing and lending through the FX swap and related forward market gives rise to missing debt. It does so with the help of simplified T-accounts. In the process, it also shows what would happen if FX swaps were treated the same as repurchase agreements (repos) - two transactions that can be considered to be forms of collateralised lending/borrowing. The table shows the corresponding balance sheets, with the subscript X denoting foreign currency positions.
Assume that an agent wishes to purchase a foreign currency asset, A, and hedge the corresponding FX risk. The agent begins with holdings of local currency C, and no debt, ie C equals net worth, E (left-hand panel).
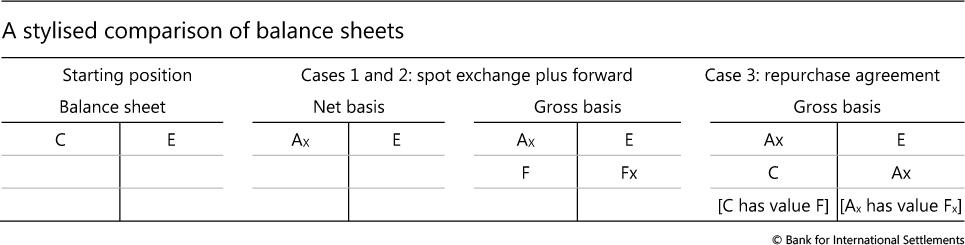
One option (case 1) is for the agent to use the available cash to buy foreign currency in the FX market, purchase the foreign asset and at the same time enter an outright forward contract, committing to sell an equivalent amount of foreign currency for domestic currency at an agreed price at maturity. The forward creates an obligation to come up with foreign currency (a liability), matched by the right to receive the domestic currency (an asset), both equal to the current value of the foreign currency asset. The obligation to repay is a form of debt.
Table A also shows two possible ways of recording the transaction in the accounts: on a net basis, ie the way it is currently done, and on a gross basis, with the rights and obligations being explicitly shown as assets and liabilities, denoted by F (for forward). Recording on a net basis shows an apparent currency mismatch: the asset is in foreign currency, Ax, and the equity in domestic currency, E. This apparent mismatch disappears if the transaction is recorded on a gross basis, as the forward foreign currency liability, Fx, offsets the foreign currency asset, Ax.
Next, imagine that the agent entered an FX swap instead (case 2). The accounts would be identical to those in case 1. This is because an FX swap consists of two legs: the exchange today (or spot leg) and the commitment to exchange in the future - precisely the forward leg. The only difference from case 1 is that two transactions become one contract with the same counterparty.
Now assume that the agent decided to avoid the FX risk by keeping the cash in domestic currency and financing the foreign security in the foreign repo market (case 3). That is, the agent finances the security at purchase by immediately selling it while committing to buy it forward at an agreed price. (Here we abstract from the haircut so that the security is altogether self-financing.) Current accounting principles require that this be reported on a gross basis, so that the balance sheet doubles in size. Yet the position is functionally equivalent to that of an FX swap or forward. There is no FX risk, and the agent needs to finance the future obligation (debt) by coming up with the corresponding foreign currency to settle the forward leg (cases 1 and 2) or to repurchase the foreign currency-denominated asset (case 3). The only difference is that in case 3 the agent has the freedom to use the domestic currency cash to buy another domestic currency asset rather than having it tied up in a forward claim.
Why such a difference in accounting treatment? One reason is that forwards and swaps are treated as derivatives, so that only the net value is recorded at fair value, while repurchase transactions are not. Since the value of the forward claim exchanged at inception is the same, the fair value of the contract is zero and it changes only with variations in exchange rates. Yet, unlike with most derivatives, the full notional amount, not just a net amount as in a contract for difference, is exchanged at maturity. That is, the notional amounts are not purely used as reference for the income streams to be exchanged, such as in interest rate derivatives. Another reason is the definition of control, which for cash requires control over the cash itself (eg a demand deposit) but for a security just the right to the corresponding cash flows. This determines what is recognised and not recognised on the balance sheet.
In each case, the investor's economic situation is much the same. To be sure, the investor may deal with different counterparties and face different operational issues. And, if market prices are not perfectly aligned, one strategy may pay off better than the others. For instance, the misalignment of cash and FX borrowing rates ("failure of covered interest parity") has received much attention recently.2 But in each case, the investor holds the foreign security without bearing its FX risk. In each case, the investor takes on foreign currency debt - in the form of a forward (case 1), the forward leg of the FX swap (case 2) or the amount borrowed in the cash repo market (case 3). And, in each, the investor must pay foreign currency to settle the maturing debt.
Yet, despite this basic equivalence, the amounts borrowed through swaps and forwards never show up on any balance sheet while those related to repos do. Agents do not have to report the nominal (principal) amounts they have committed to exchange on the balance sheet, only the marked-to-market values ("replacement cost" values). These start at zero with the exchange of equal values but become positive or negative as exchange rates move.3 The marked-to-market value averages about 3% of the notional amount for FX forwards and 6-9% for currency swaps.4 One needs to look deep into the footnotes to the accounts to learn about the principal amounts. As a result, the corresponding amount of debt remains obscured.5
This makes it very difficult to measure the debt and funding involved. The balance sheets show only the final outcome of a series of swap and forward transactions. As the box outlines, this shows as an apparent currency mismatch. For instance, if a bank swaps its home currency for dollars, its dollar assets end up exceeding its dollar liabilities. Moreover, for highly active dealer banks, the balance sheet shows only the net result of a possibly huge number of deals for dealer banks very active in the market.
In what follows, we piece together the amount and distribution of this missing debt from three different sources. We combine top-down with bottom-up analysis.
The first source is the BIS derivatives statistics, which draw on reports from 73 global dealer banks. The reports break down the total nominal amounts of FX swaps/forwards and currency swaps by instrument, three counterparty types (dealer banks, other financial institutions and non-financial customers), seven currencies and three maturity buckets. FX swaps and forwards are treated together since, as noted above, after the spot exchange only the forward position survives. That said, BIS statistics on FX turnover show that FX swaps are the modal instrument (see below).
The second source is the BIS international banking statistics, which cover about 8,350 internationally active banks. The reporting population outnumbers that of the derivatives statistics, but the value overlap is great given the concentration of international banking. We use the apparent currency mismatches visible on-balance sheet to infer the amounts of swaps and forwards. Assuming that the net FX position is zero, as typically encouraged by bank supervisors, we estimate the net use of swaps as the net positions in a given currency. Even then, data limitations defy precise estimates. Moreover, as mentioned before, the resulting net positions are likely to underestimate the gross debt positions, especially for dealer banks.
The third source includes ad hoc surveys on institutional investors' and asset managers' use of derivatives. These are coupled with occasional specific disclosures.
These three sources, together with BIS data on international debt securities and global trade, provide a sense of the instruments' use. Triangulating between the various sources also allows a rough cross-check of the approximations made.
The market: a bird's eye view
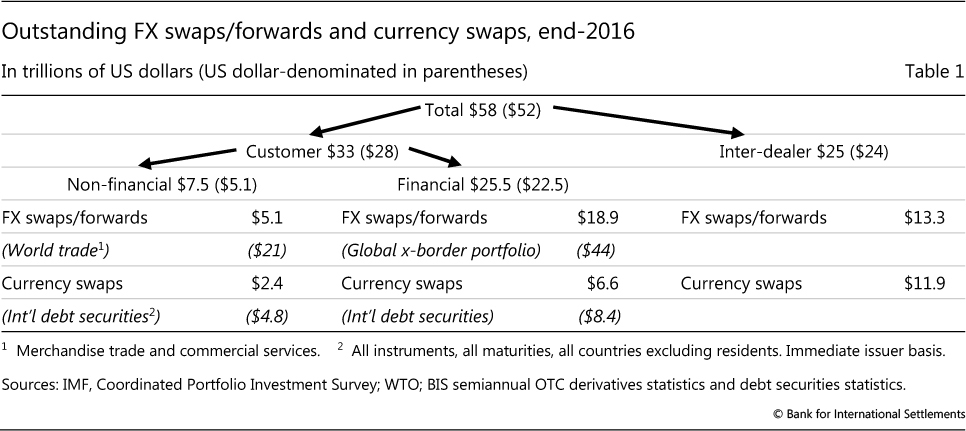
The outstanding amounts of FX swaps/forwards and currency swaps stood at $58 trillion at end-December 2016 (Graph 1, left-hand panel). For perspective, this figure approaches that of world GDP ($75 trillion), exceeds that of global portfolio stocks ($44 trillion) or international bank claims ($32 trillion), and is almost triple the value of global trade ($21 trillion).
The outstanding amount has quadrupled since the early 2000s but has grown unevenly (Graph 1, left-hand panel). After tripling in the five years to 2007, it fell back sharply during the GFC, even more than international bank credit. This most likely reflected a reduction in hedging needs, as both trade and asset prices collapsed.
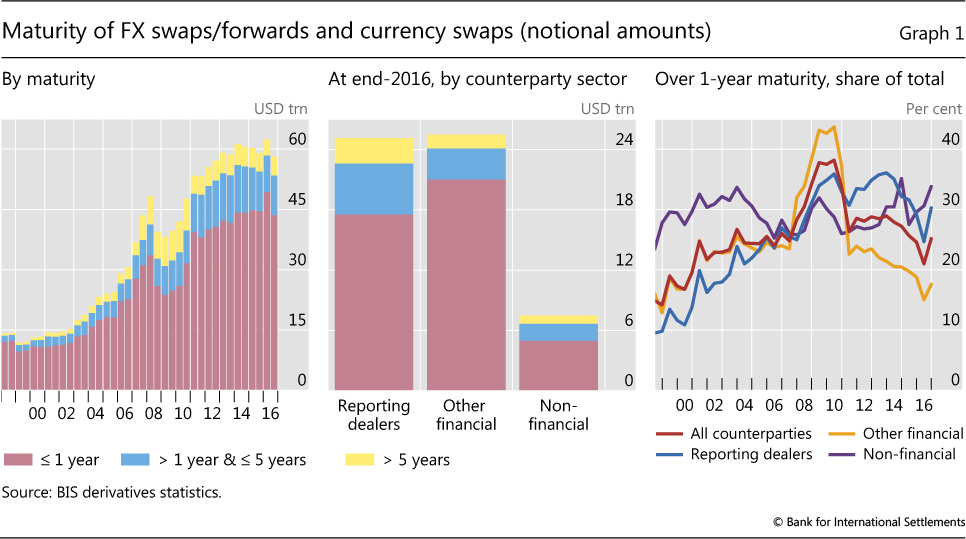
The maturity of the instruments is largely short-term (Graph 1, centre and right-hand panel). At end-2016, three quarters of positions had a maturity of less than one year and only a few percentage points exceeded five years. Turnover data show that the modal forward (a customer-facing instrument) matures between one week and one year while the modal swap (an inter-dealer instrument) within a week (BIS (2016)). The long-term share has risen since the 2000s, as capital markets have boomed.
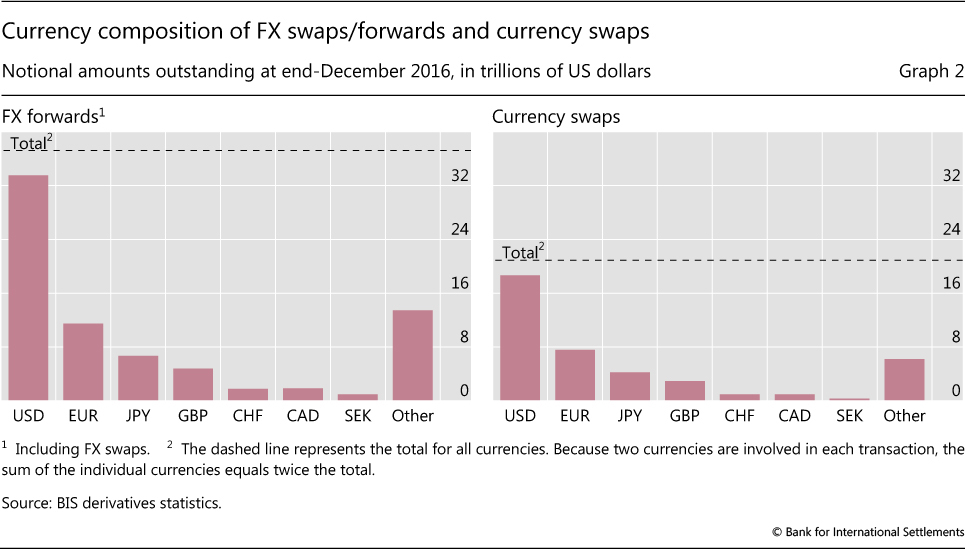
The dollar reigns supreme in FX swaps and forwards. Its share is no less than 90% (Graph 2), and 96% among dealers (Table 1). Both exceed its share in denominating global trade (about half) or in holdings of official FX reserves (two thirds). In fact, the dollar is the main currency in swaps/forwards against every currency. For instance, it predominates in forwards in the Norwegian krone, the Swedish krona and the Polish zloty, currencies that trade in the spot market more against the euro.6
While outstanding amounts lump FX swaps with forwards, turnover data show that FX swaps are the instrument of choice. Swaps/forwards and currency swaps amounted to over $3 trillion per day in 2016, over 60% of total FX turnover (Moore et al (2016)). Of that, FX swaps accounted for three quarters, forwards for 22% and currency swaps for the rest.
The counterparty breakdown of outstanding amounts provides a big-picture indication of obligors and, indirectly, uses (Table 1). Reporting dealer positions vis-à-vis customers amount to $33 trillion,7 or over half (57%) of the total; the rest, $25 trillion, are positions among reporting institutions themselves ("inter-dealer"). This large share is a trademark of decentralised, over-the-counter (OTC) markets.8 Non-dealer financial firms bulk large among customers, with a share of about 80%.
Drilling down to non-financial and financial customers
Before turning to a more detailed analysis of the inter-dealer market based on the BIS international banking statistics, we discuss non-financial and financial customers' use of the various instruments. Consider each in turn.
Non-financial customers: international trade and liability hedging
Apart from speculative use, the non-financial sector employs FX forwards and currency swaps to hedge international trade and foreign currency bonds, notably those issued to cheapen funding costs. Since most international trade contracts are short-term, forwards serve as hedges. When hedging bond issues in foreign currency, firms and governments typically match the bond maturity and that of the currency swap (McBrady et al (2010), Munro and Wooldridge (2010)).
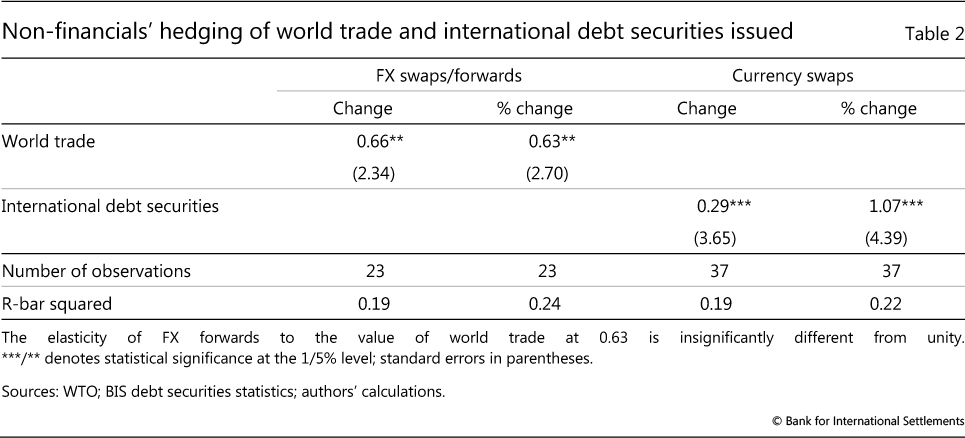
Thus, one can relate non-financial FX swaps/forwards and currency swaps, in an admittedly stylised fashion, to international trade and bond issuance, respectively (Table 1). If firms use $5.1 trillion of short-term FX forwards to hedge global trade of $21 trillion, then the ratio implies that importers and exporters hedge at most three months' trade. Similarly, if firms and governments use $2.4 trillion of currency swaps to hedge $4.8 trillion of international bonds, then they hedge half or less.
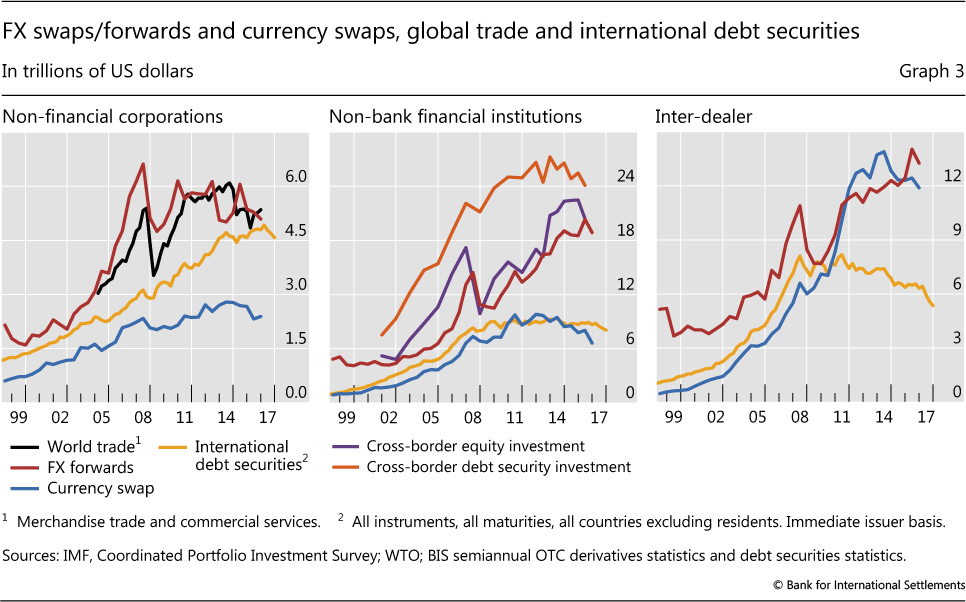
Inspection of the corresponding time series provides some evidence for these links (Graph 3, left-hand panel). Non-financials' FX swaps/forwards (red line) co-move with world trade (black). Similarly, there is a visible, if weaker, co-movement between international bonds outstanding (yellow) and longer-term currency swaps (light blue).
Simple bivariate regression analysis provides further support for the posited links (Table 2). A $1 billion increase in quarterly global trade in goods and services over a half-year is significantly associated with a $660 million increase in non-financial entities' swap/forward positions (first column).9 Likewise, a $1 billion increase in international securities outstanding coincides with a $290 million rise in non-financial firms' currency swaps (column 3); the link is one to one in percentage terms (column 4).
Non-bank financial customers: hedging assets and liabilities
Other non-bank financial firms come in two groups. The first comprises institutional investors, asset managers and hedge funds that use FX forwards to hedge their holdings and to take positions. The second includes non-bank financial firms that use currency swaps to hedge their FX bonds. Consider each group in turn.
Surveyed institutional investors and asset managers use outright forwards (90% and 69%, respectively), followed by FX swaps (48% and 33%) and, to a lesser extent, currency swaps (37% and 19%) (IMF (2011)). Hedge ratios vary by asset class. Those for foreign currency bonds range from 50 to 100%; those for foreign equities 20 to 60%.10 Heavy use of FX forwards widens maturity mismatches (see below).11
Broad brush, one can compare non-bank financial FX swaps/forwards with global cross-border securities holdings. If $18.9 trillion of FX forwards hedge a $44 trillion portfolio, then institutional investors would hedge as much as 40%.12 Graph 2 (centre panel) suggests that non-bank financial forwards declined with the value of cross-border securities' holdings in 2008. A simple regression confirms some link, with a 1% rise in holdings associated with a 0.6% rise in forwards (Table 3).
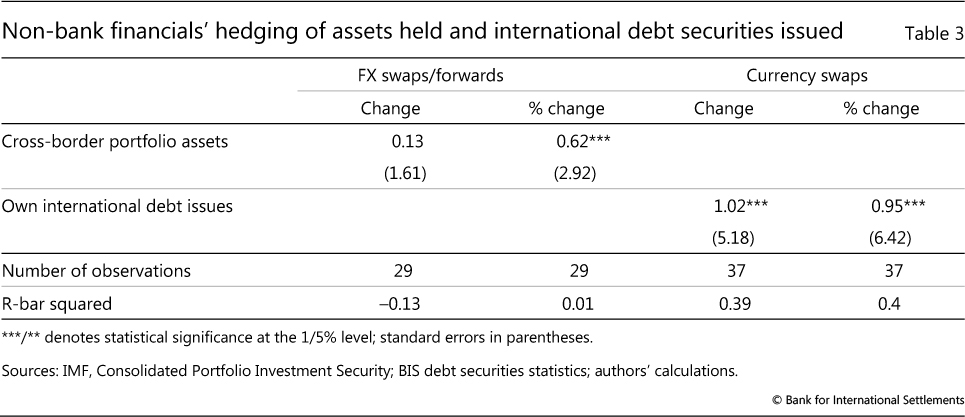
The $6.6 trillion in currency swaps that non-bank financial firms have contracted stand at almost 80% of their outstanding international debt securities. Regression analysis supports such a high hedge ratio (Table 3, third and fourth columns). However, given the activity of hedge funds in the currency swap market, the 80% should be regarded as an upper bound on non-bank financial firms' hedging.
Drilling down to banks
As noted, as long as one assumes that banks roughly match their FX exposures, BIS international banking statistics offer a detailed picture of the geography of banks' use of FX swaps/forwards - their main hedging instrument. We focus on the dollar, given its dominance in international finance, generally, and in the market, in particular.
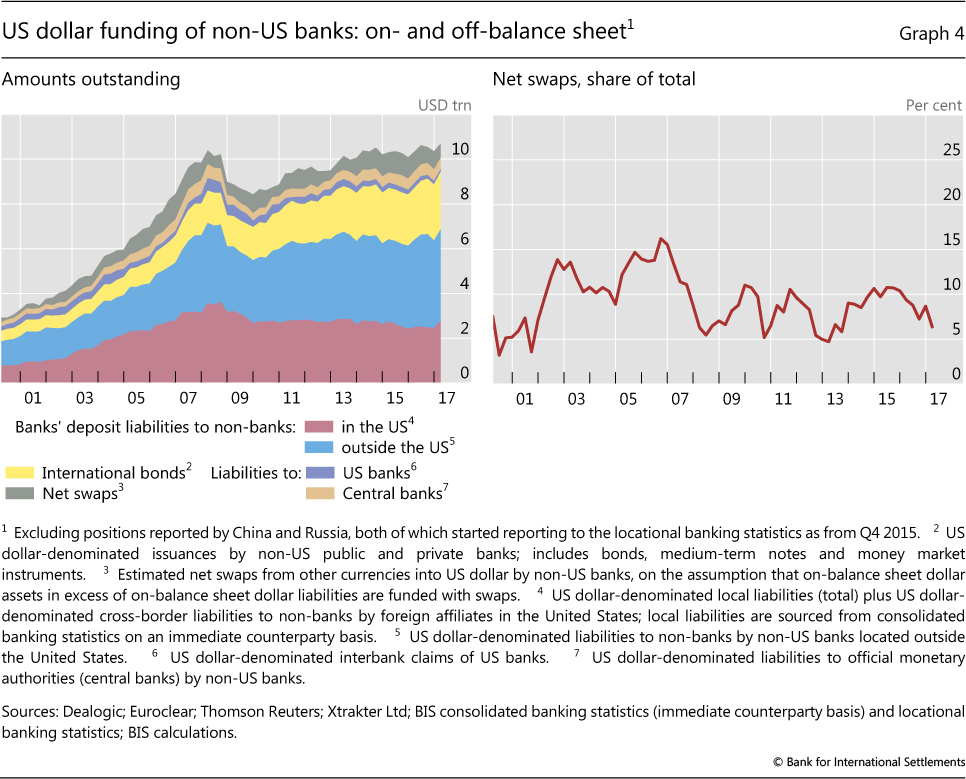
FX swaps were a key part of non-US banks' total US dollar funding, amounting to an estimated $0.6 trillion, roughly 6% of the total in March 2017 (Graph 4). The rest, about $9.4 trillion, mostly took the form of deposits from US and non-US non-banks (red and blue areas), and dollar debt securities (yellow area).
We sort banking systems into US dollar net borrowers and lenders via FX swaps (Graphs 5 and 6). As noted, net borrowers' balance sheets show more dollar assets than liabilities, offset by missing off-balance sheet dollar debt.13 Net borrower banks use these dollars, along with those from FX reserve managers (red lines), to fund claims on non-banks (green lines) and other banks (solid and dashed blue lines).
Japanese banks had by far the largest on-balance sheet mismatch in dollar positions at end-Q1 2017 (top right-hand panel). They were net borrowers of an estimated $1 trillion via FX swaps.14 Borio et al (2016) argue that constraints on global banks' balance sheets, combined with increasing demand for cross-currency funding by Japanese banks, pension funds and other non-bank financial entities, led the yen/dollar basis to widen after 2014.15
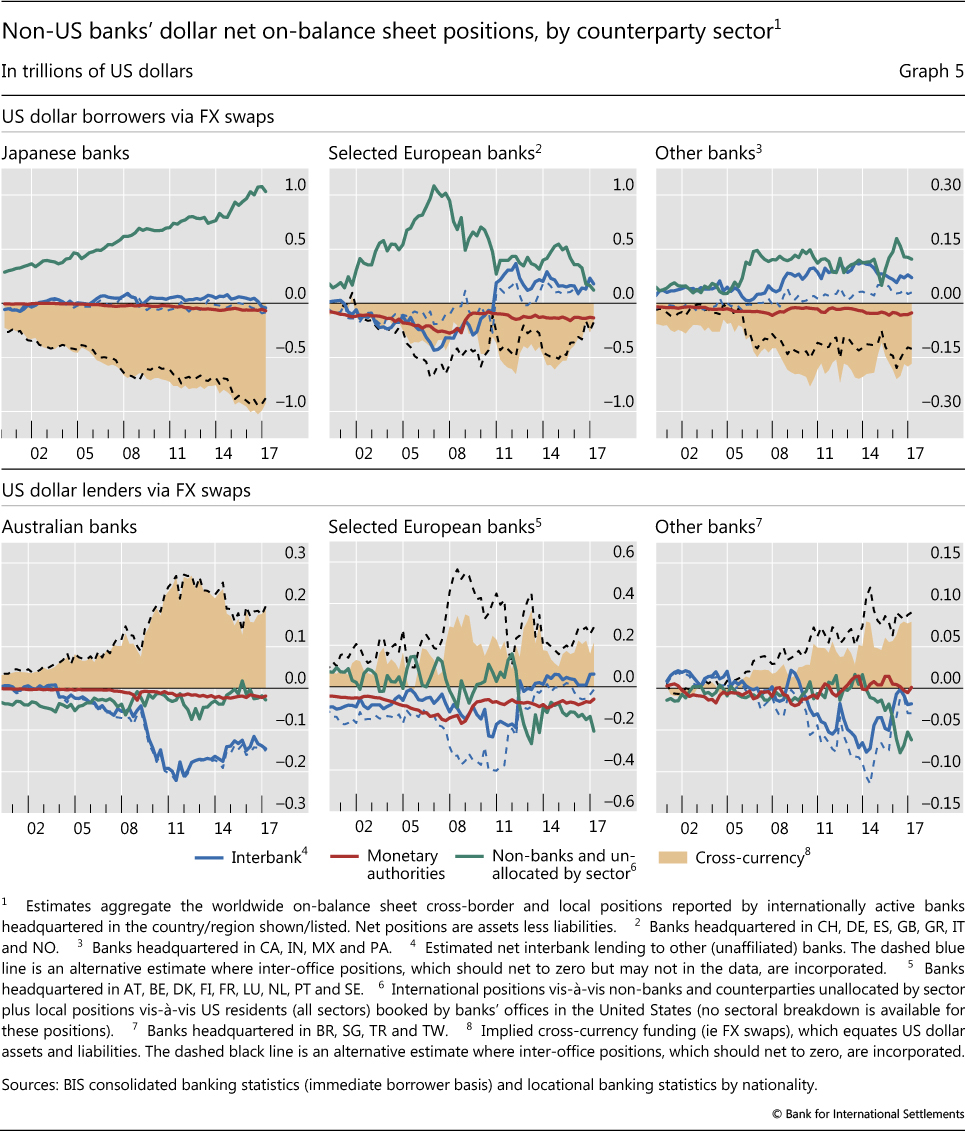
For their part, several large European banking systems also draw dollars from the FX swap market to fund their international dollar positions (top centre panel). Pre-GFC, German, Dutch, UK and Swiss banks, in particular, had funded their growing dollar books via interbank loans (blue lines) and FX swaps (shaded area). The meltdown in dollar-denominated structured products during the crisis caused funding markets to seize up and banks to scramble for dollars. Markets calmed only after coordinated central bank swap lines to supply dollars to non-US banks became unlimited in October 2008.
Post-GFC, these European banks' aggregate dollar borrowing via FX swaps declined, along with the size of their dollar assets. In particular, German, Swiss and UK banks reduced their combined reliance on FX swaps from $580 billion in 2007 to less than $130 billion by end-Q1 2017.
The bottom panels of Graph 5 show aggregates for the non-US banks that, on net, lend dollars through FX swaps in order to square their books. Australian banks (bottom left-hand panel), for example, have relied on direct dollar interbank and bond borrowing (blue line) to fund mostly Australian dollar investments at home, and with an estimated $200 billion in FX swaps hedging the currency risk.16 Selected European and non-European banking systems add almost $300 billion to this total.
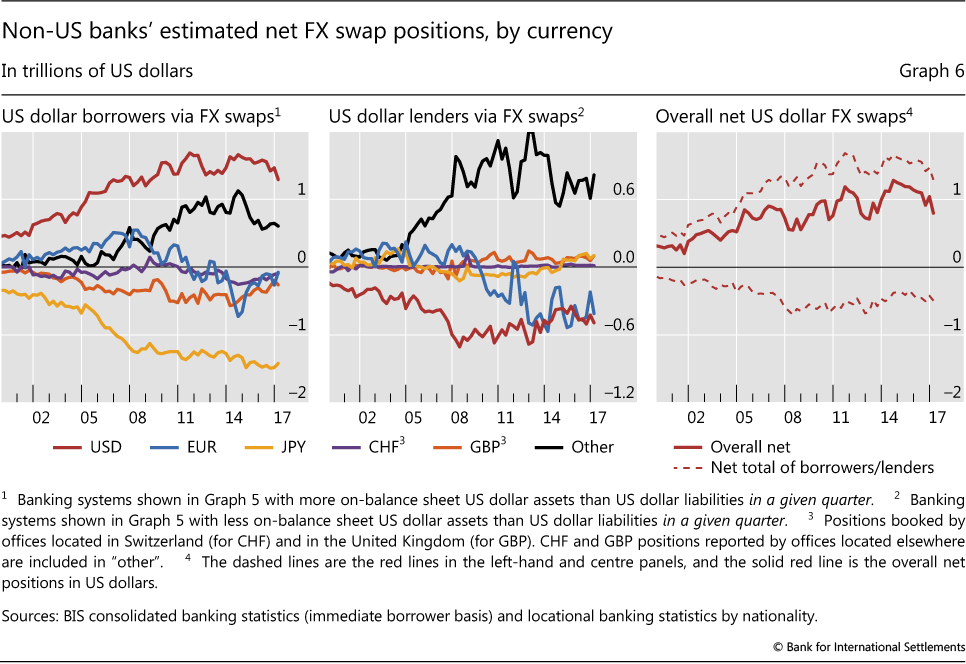
Non-US banks' net dollar lending through the FX swap market falls short of their net borrowing, with the gap widening over time (Graph 6, right-hand panel).17 More specifically, dollar borrowing against other major currencies, like the yen and the euro (left-hand panel), exceeds dollar lending against secondary and emerging market currencies (centre panel).
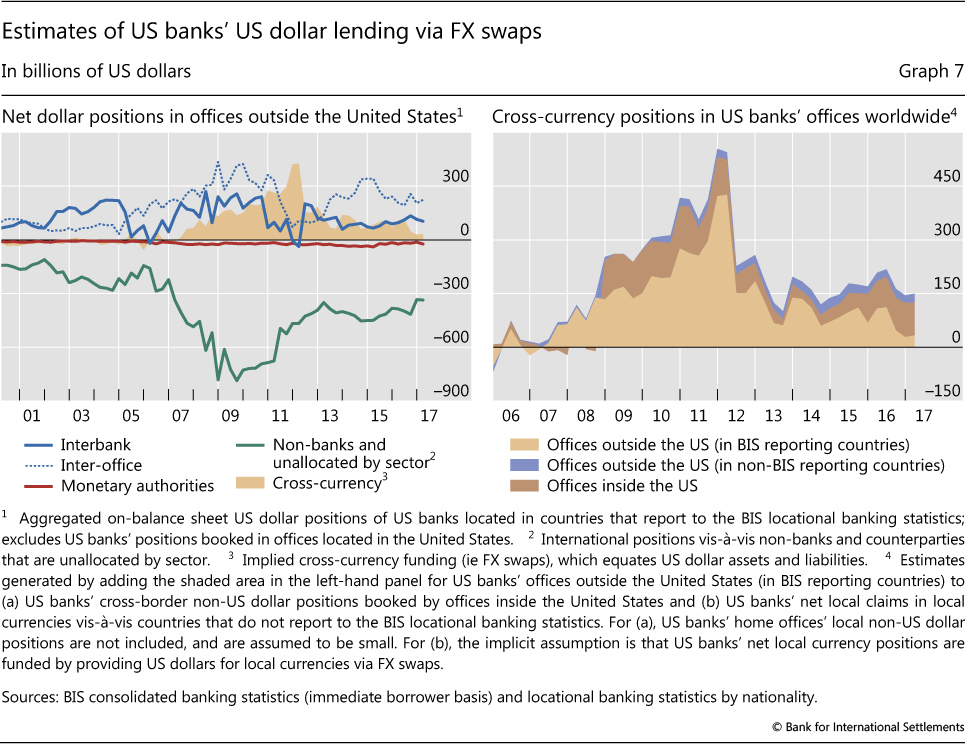
Who, then, lends dollars to non-US banks via the FX swap market? Four candidates are: US banks, central banks, European agencies and supranational organisations, and private non-banks. All of these appear to provide some funding, with US banks and central banks together closing about half the gap.
As regards the first candidate, US banks naturally lend dollars via FX swaps: $150 billion in the latest data (Graph 7). This figure combines positions from offices outside and inside the United States. BIS data offer a fairly complete picture of US banks' positions outside the country (left-hand panel): they point to $33 billion in net lending at end-Q1 2017, down from more than $400 billion in 2011 (shaded area). The corresponding estimate for offices inside the country is less precise (right-hand panel).18
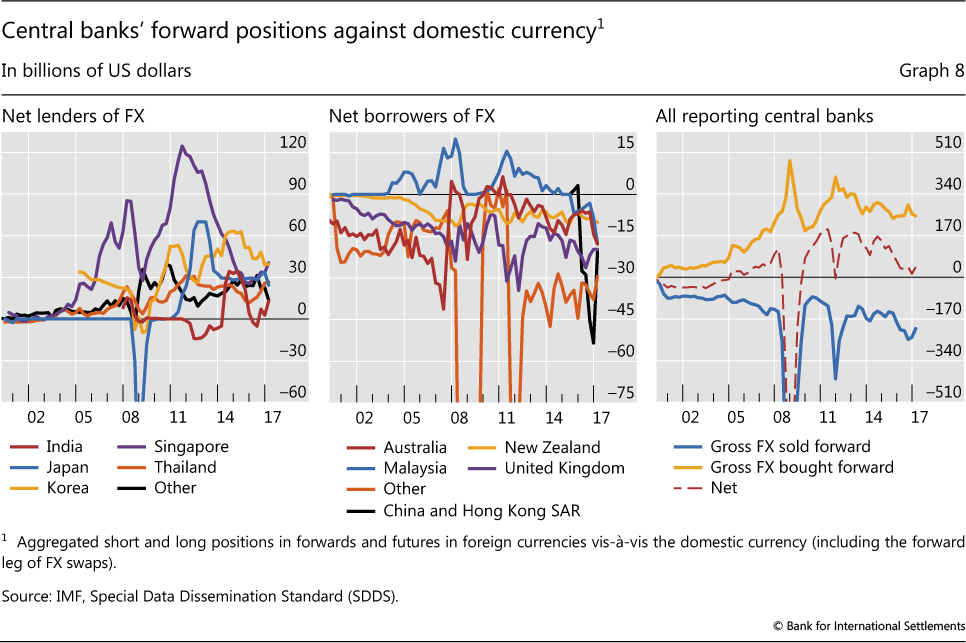
Second, central banks lend dollars via FX swaps against either their own currency or third currencies. Against their own currency, some Asian central banks provide about $200 billion in swaps as they manage the domestic liquidity consequences of FX reserve accumulation (Graph 8, left-hand panel).19 They first buy dollars spot (increase their FX reserves) and then drain domestic liquidity by swapping (lending) the dollars for (against) domestic currency. On net, however, central banks' dollar supply against their own currencies is close to zero, since other central banks are actually borrowing dollars via FX swaps (centre and right-hand panels).20 They do so in order to finance their accumulation of FX reserves without incurring currency risk ("borrowed reserves"). Against foreign currencies, some central banks lend dollars via swaps in the management of their FX reserve portfolio. For instance, the Reserve Bank of Australia swaps US dollars for yen (Debelle (2017)). We estimate that such operations by reserve managers sum to at least $300 billion.
Third, European supranationals and agencies have opportunistically borrowed dollars to swap into euros to lower their funding costs. While their operations mostly require euros, they have done so to take advantage of the breakdown in covered interest parity (Borio et al (2016)). Five European supranationals and agencies together had over $400 billion in dollar debt in June 2017. We estimate that these alone have provided $300 billion in swaps against the euro.
Fourth, non-bank private sector entities can provide hundreds of billions of dollars. Like US banks, US-based asset managers are obvious candidates. In June 2014, the then largest US bond fund, PIMCO's Total Return Fund, reported $101 billion in currency forwards, no less than 45% of its net assets (Kreicher and McCauley (2016)). Since the overall US holdings of foreign currency bonds were $600 billion at end-2015, a 50% hedge ratio would extrapolate to $300 billion. On the equity side, US investors' hedge ratios are thought to be 40-50% for advanced economy equities (Melvin and Prins (2015)).21 In addition, US firms that hold cash in offshore affiliates to avoid US corporate tax on repatriated earnings could be sizeable lenders as well.
Potential adjustments to the GLIs
As part of its GLIs, the BIS has been regularly publishing estimates of the dollar debt of non-banks outside the United States. These cash market obligations, both bank loans and bonds, totalled $10.7 trillion at end-March 2017. What would be the corresponding additional debt borrowed through the FX derivatives markets? As we explain next, the order of magnitude is similar: the missing debt amounts to some $13-14 trillion. But the implications for financial stability are quite subtle and require an assessment of both currency and maturity mismatches.
Obtaining such estimates requires a series of steps and assumptions. First, the BIS OTC derivatives statistics report total dollar-denominated forwards and swaps outstanding vis-à-vis customers (our proxy for non-banks) of $28 trillion (in parentheses in Table 1). Second, we need to make an assumption about the direction of non-banks' positions. We could assume that the amount of dollars lent and borrowed through derivatives by customers is matched. This would require reporting dealers, as a sector, to be also balanced: data slippage aside, customers and dealers make up the whole market. If so, to obtain the total amount of non-banks' gross dollar borrowing through FX forwards, one would divide by two. This gives $14 trillion.22 The previous section, however, suggested that banks as a whole use the market for net dollar borrowing. If so, one could subtract that amount from the total before dividing. Even then, an upper estimate of the banks' net position would be, say, $2 trillion. This would imply (after dividing the remaining amount by two) a lower amount of non-bank dollar borrowing of $13 trillion. Finally, we need to estimate the fraction of that debt held by non-US residents. If US residents use the bulk of their derivatives for hedging purposes, the amount would be small.23
Just as for the case of the $10.7 trillion worth of on-balance sheet debt, this additional dollar debt contracted through FX derivatives is to some extent supported by dollar revenues and/or assets, ie currency-matched. The previous analysis suggests that the whole amount of that debt could be rationalised by hedging activity, be it trade or asset holdings. It also indicates that a portion of dollar off-balance sheet lending, estimated at as much as $3 trillion, may hedge the on-balance sheet dollar bond debt included in the existing GLI estimate.24 That ratio has declined as emerging market bond issuers have gained prominence (McCauley et al (2015), Bruno and Shin (2017)). Such hedging can support financial stability, especially if maturities are matched. At the same time, the reassurance cannot be complete. Experience shows that FX derivatives can also be used to take open positions, including in the form of carry trades. And off-balance sheet debt can cause or amplify strains, especially in the case of FX options (which are beyond the scope of this analysis). The available statistics do not allow us to identify the extent of speculative use.
Regardless of whether the off-balance sheet debt is currency-matched or not, it has to be repaid when due and this can raise risk. To be sure, such risk is mitigated by the other currency received at maturity. Most maturing dollar forwards are probably repaid by a new swap of the currency received for the needed dollars. This new swap rolls the forward over, borrowing dollars to repay dollars.
Even so, strains can arise. In particular, the short maturity of most FX swaps and forwards can create big maturity mismatches and hence generate large liquidity demands, especially during times of stress. Most spectacular was the funding squeeze suffered by many European banks during the GFC. Indeed, in response, the Swedish bank supervisor has applied liquidity requirements separately to banks' dollar and euro positions (Jönsson (2014)). But non-banks may also face similar problems when they run such mismatches, both on- and off-balance sheet. During the GFC, central banks extraordinarily extended dollar credit to non-banks in Brazil ($10 billion programme) and Russia ($50 billion).25 Moreover, even sound institutional investors may face difficulties. If they have trouble rolling over their hedges because of problems among dealers, they could be forced into fire sales.26
Conclusion
Obligations to pay dollars incurred through FX swaps/forwards and currency swaps are functionally equivalent to secured debt. In contrast to other derivatives, agents must repay the principal at maturity, not just the replacement value of the position. Moreover, they could replicate those positions through transactions in the cash and securities markets that would show up on-balance sheet. But because of accounting conventions, this debt does not appear on the balance sheet: it has gone missing.
All this greatly complicates any assessment of the missing debt's total amount and distribution, and hence of its implications for financial stability. In this special feature, we have taken a first step. That said, a fuller assessment would require better data to help evaluate the size and distribution of both currency and maturity mismatches. The analysis also points to deeper and more complex questions about the accounting conventions themselves. At issue is the definition of derivatives and control, which gives rise to the asymmetric treatment of cash and other claims in repo-like transactions. These questions, together with their regulatory implications, would merit further consideration.
References
Aldasoro, I, T Ehlers and E Eren (2017): "The Japan repo premium and US dollar intermediation", forthcoming in BIS Working Papers.
Australian Bureau of Statistics (2013): "Foreign currency exposure - Australia", March, ABS no 5308.0, October.
Bank for International Settlements (2010): 80th Annual Report, June.
--- (2016): "Triennial Central Bank Survey: OTC interest rate derivatives turnover in April 2016", September.
--- (2017): 87th Annual Report, Chapter V, June.
Borio, C, R McCauley, P McGuire and V Sushko (2016): "Covered interest parity lost: understanding the cross-currency basis", BIS Quarterly Review, September, pp 45-64.
Bruno, V and H S Shin (2017): "Global dollar credit and carry trades: a firm-level analysis", The Review of Financial Studies, vol 30, no 3, pp 703-49.
D'Arcy, P, M Idil and T Davis (2009): "Foreign currency exposure and hedging in Australia", Reserve Bank of Australia, Bulletin, December, pp 1-10.
Debelle, G (2017): "How I learned to stop worrying and love the basis", speech at the BIS symposium "CIP - RIP?", 22 May.
Du, W, A Tepper and A Verdelhan (2017): "Covered interest rate parity deviations in the post-crisis world", presentation at the BIS symposium "CIP - RIP?", 22 May.
Eklund, J, J Milton and A Rydén (2012): "Swedish banks' use of the currency swap market to convert funding in foreign currencies to Swedish kronor", Sveriges Riksbank, Economic Review, no 2, pp 18-43.
Hilander, E (2014): "Short-term funding in foreign currency by major Swedish banks and their use of the short-term currency swap market", Sveriges Riksbank, Economic Review, no 1, pp 1-23.
International Monetary Fund (2011): "Long-term investors and their asset allocation", Global Financial Stability Report, September.
--- (2017): Coordinated portfolio investment survey.
Jönsson, B (2014): "An examination of the liquidity coverage ratio (LCR) in Swedish kronor", Sveriges Riksbank, Economic Commentaries, no 6.
Kadota, S, N Oshikubo, L Sharavdemberel, Y Funakubo and D Fernandez (2017): "Japan portfolio rebalancing update: shift to cautious and selective stance", Barclays FICC Research, 3 August.
Kreicher, L and R McCauley (2016): "Asset managers, eurodollars and unconventional monetary policy", BIS Working Papers, no 578, August.
McBrady, M, S Mortal and M Schill (2010): "Do firms believe in interest rate parity?", Review of Finance, vol 14, no 4, pp 695-726.
McCauley, R, P McGuire and V Sushko (2015): "Dollar credit to emerging market economies", BIS Quarterly Review, December, pp 27-41.
McCauley, R and C Shu (2016): "Non-deliverable forwards: impact of currency internationalisation and derivatives reform", BIS Quarterly Review, December, pp 81-93.
McGuire, P and G von Peter (2009): "The US dollar shortage in global banking", BIS Quarterly Review, March, pp 47-63.
Melvin, M and J Prins (2015): "Equity hedging and exchange rates at the London 4 pm fix", Journal of Financial Markets, no 22, pp 50-72.
Moore, M, A Schrimpf and V Sushko (2016): "Downsized FX markets: causes and implications", BIS Quarterly Review, December, pp 35-51.
Munro, A and P Wooldridge (2010): "Motivations for swap-covered foreign currency borrowing", BIS Papers, no 52, July, pp 145-85.
Rush, A, D Sadeghian and M Wright (2013): "Foreign currency exposure and hedging in Australia", Reserve Bank of Australia, Bulletin, December, pp 49-57.
Stone, M, C Walker and Y Yasui (2009): "From Lombard Street to Avenida Paulista: foreign exchange liquidity easing in Brazil in response to the global shock of 2008-09", IMF Working Papers, no WP/09/259.
US Treasury, Federal Reserve Bank of New York and Board of Governors of the Federal Reserve System (2017): US portfolio holdings of foreign securities as of December 31, 2015, January.
Vnesheconombank (2009): Annual Report, 2008.
Wooldridge, P (2017): "Central clearing makes further inroads", BIS Quarterly Review, June, pp 8-9.
1 We thank Mary Barth, Stijn Claessens, Benjamin Cohen, Dietrich Domanski, Neil Esho, Ingo Fender, Ruby Garg, Hiroyuki Ito, Scott Nagel, Noel Reynolds, Hyun Song Shin, Kostas Tsatsaronis, David Williams and Philip Wooldridge for comments and discussions. We are also grateful to Jakub Demski, Denis Pêtre and Jeff Slee for research assistance. The views expressed are those of the authors and do not necessarily reflect those of the Bank for International Settlements.
2 See the papers and presentation prepared for the BIS symposium on covered interest parity, "CIP - RIP?", at http://www.bis.org/events/bissymposium0517/programme.htm.
3 Dealers maintain the secured nature by agreeing to credit support annexes. The mark-to-market loser regularly hands over cash or securities ("variation margin") to the mark-to-market winner.
4 Gross market values do not take into account the value of any collateral posted as currencies move. The cited percentages rise with exchange rate volatility. They roughly doubled at the end of 2008.
5 Why such a difference? The main reasons seem to be that: (i) FX swaps/forwards are treated as derivatives while repos are not; and (ii) specific criteria are defined for ascertaining control in the case of securities and cash (see box). This results in an asymmetry in the treatment of cash (the two FX streams) and securities in what are in effect repo-like transactions.
6 The dollar persists here more owing to network externalities than to inertia; see BIS (2010, pp 57-8).
7 The gross market value of these positions amounted to $1.5 trillion ($1.3 trillion for dollars) at end-2016.
8 Only 1% of FX transactions are centrally cleared (Wooldridge (2017)), and most of those remain limited to non-deliverable forwards (McCauley and Shu (2016)). At end-2007, before interest rate swaps were centrally cleared, the inter-dealer share of such positions stood at almost 40%.
9 In percentage changes (log differences), a 1% increase in global trade is associated with a 0.63% increase in non-financials' FX swaps/forwards (column 2). The R2 suggests that variation in world trade is associated with about a fifth to a fourth of the variation in their use of these instruments.
10 See D'Arcy et al (2009), ABS (2013, p 6), Rush et al (2013), Kadota et al (2017) and Hilander (2014, Table 5).
11 Institutional investors' hedging practice can be defended for equities, which vary in price and have no maturity (D'Arcy et al (2009)). Melvin and Prins (2015) describe equity investors' common practice of adjusting their hedges on the last day of the month at the widely used 4 pm London "fix".
12 Such a comparison abstracts from cross-country differences in hedge ratios, and the unique US position. Heavy global dollar bond issuance allows US investors to diversify credit risk without incurring FX risk: 75% of US-held foreign bonds are dollar-denominated (US Treasury et al (2017)).
13 Graphs 5 and 6 plot two estimates for net interbank borrowing (solid and dashed blue lines) and net FX swaps (shaded area and dashed black line). In the locational banking statistics, banks report cross-border inter-office positions. These positions should sum to zero for each banking system but often do not. The two estimates treat such discrepancies differently. See McGuire and von Peter (2009).
14 This is an upper-bound estimate. In the locational banking statistics, Japan reports the dollar positions of Japanese banks inclusive of their trustee positions, or positons booked on behalf of clients, which are likely to have a lower hedge ratio. See Borio et al (2016) for a more detailed discussion.
15 See footnote 2. See also Aldasoro et al (2017) for evidence of differential pricing in dollar funding markets; Japanese banks pay a premium to borrow via repos from US money market funds.
16 See ABS (2013) and Rush et al (2013) on hedging by Australian banks.
17 BIS data provide only a partial picture of the dollar books of banks headquartered in China, Korea, Russia and many other countries. An aggregation of these banks' observed dollar positions, however, suggests that they are, overall, net borrowers of dollars via FX swaps, pointing to an even wider gap than shown in Graph 6. BIS data do not capture at all the dollar positions of other non-reporting banking systems, some of which may be dollar lenders via FX swaps (eg oil-producing countries).
18 In the BIS locational banking statistics, the United States does not report resident banks' local positions, which prevents measuring US banks' global dollar asset and liability positions. The estimate in the right-hand panel of Graph 7 for "Offices inside the US" is inferred from these banks' net non-dollar positions, and assumes that non-dollar local positions are small.
19 The counterparties of the central banks are not in all cases reporters to the BIS banking statistics, in which case they cannot help explain the gap identified previously.
20 In some cases, the authorities finance some foreign exchange reserves by swapping domestic currency into dollars. Whereas dollar-lending central banks typically have a long FX position, dollar-borrowing central banks can hold reserves while also avoiding a long FX position.
21 Hedge ratios for Japanese equities can be higher. ETFdb.com data show that, out of the top 22 exchange-traded funds that invest in Japanese equities, those with "hedged" in the fund title had combined assets of $29 billion.
22 This also assumes that dealers - and not customers - have matched positions in which the dollar serves as the vehicle currency, eg a swap from yen to dollars matched with one from dollars to euros.
23 US imports of $2.7 trillion are 90% dollar-denominated. US non-banks have sold only $600 billion in non-dollar-denominated debt to non-residents (US Treasury et al (2016)). Many leveraged accounts (eg Commodity Trading Advisor funds) sell dollars in the futures market rather than in the OTC market.
24 For non-financial borrowers, the ratio of their outstanding currency swaps to their international debt securities suggests a 50% hedge ratio (Graph 3, left-hand panel). Applying this to their $2.8 trillion in dollar bonds suggests that as much as $1.4 trillion may be hedged. Similarly, the maximum implied hedge ratio for non-bank financial entities of 80% (Graph 3, centre panel) suggests that as much as $1.8 trillion of their $2.2 trillion in dollar bonds is hedged. Together, as much as 66% of non-banks' $5 trillion in outstanding dollar bonds may be hedged.
25 See Stone et al (2009) and Vnesheconombank (2009).
26 Such investors might be able to settle the existing contract by obtaining dollars through the spot market against incoming currencies, putting upward pressure on the dollar exchange rate. But if the FX swap market was closed, so that the investors could not renew the contract, they would either have to live with a currency mismatch or sell the underlying security (or, if possible, repo it out to obtain the dollars, as in the example in the box).