Concentration in cross-border banking
Cross-border bank credit is dominated by a small number of very sizeable links between banks in one country and borrowers in another. The largest-sized cross-border banking links are mainly between major advanced economies. Concentration increased up until the Great Financial Crisis (GFC) and has abated only slightly since. It is higher for interbank credit than for credit to the non-bank sector. Despite the substantial decline in interbank credit in the aftermath of the GFC, concentration in the interbank segment has remained high.1
JEL classification: G15, F30, G21.
A structural feature of cross-border banking is its high degree of concentration, with a small number of very large bilateral links accounting for the lion's share of total global cross-border bank credit. The largest links are almost exclusively between advanced economies, while links involving emerging market economies (EMEs) tend to be of smaller size. Concentration in cross-border bank links increased up to the Great Financial Crisis (GFC) and remained high. Overall, it is higher for cross-border interbank credit compared with bank credit to the non-bank sector. While the share of cross-border interbank credit has fallen significantly since the GFC, concentration has remained high for interbank links.
The concentration of cross-border bank linkages is highly relevant for financial spillovers, as the GFC revealed (Ehlers and McGuire (2017), Avdjiev and Takáts (2014), Herrmann and Mihaljek (2013), Borio et al (2011)). In this article, we take a closer look at the size distribution as well as the sectoral composition of cross-border banking links at the country level. Cross-border interbank credit was particularly affected during the GFC (Claessens (2017)), including the model whereby local banks tap cross-border funding from global banks (Bruno and Shin (2014)). Using the BIS locational banking statistics (LBS), we document the pattern of bilateral (country-level) cross-border bank credit (assets) of banks located in one country vis-à-vis bank and non-bank borrowers in another.2
The first section of this article documents the size distribution of cross-border banking links. It then shows that concentration is mainly due to links within advanced economies. The second section looks at the sectoral composition, focusing on the persistently higher concentration in cross-border interbank links relative to links vis-à-vis the non-bank sector.
Key takeaways
- A small number of very large cross-border links dominate global cross-border bank credit. Only 2.4% of all bilateral links between banks in one country and borrowers in another were greater than $50 billion in size at end-2018, but they constituted a full two thirds of global cross-border bank credit volumes.
- Concentration in cross-border bank credit is mainly due to links involving advanced economies. Just five major creditor countries - France, Germany, Japan, the United Kingdom and the United States - account for 55% of global cross-border credit and close to 70% of the volume of the largest bilateral country-level links.
- Concentration is a structural feature of cross-border bank credit. Even amid a significant drop in cross-border interbank credit after the Great Financial Crisis (GFC), concentration in interbank links remained high. Concentration in cross-border credit to non-banks has increased since the GFC.
- Small cross-border links account for an insignificant share of global bank credit but can be economically important for emerging market economies (Box B).
Distribution of cross-border banking relationships
At end-2018, the outstanding stock of cross-border bank claims stood at $28.5 trillion.3 This stock consisted of the sum of 4,822 bilateral relationships between creditor banks in one country and borrowers in another (see Box A for a more detailed data description and a comparison with consolidated data). The concentration in cross-border links can be characterised along two complementary dimensions: the number of country-level links between banks and borrowers; and the size or volume of each link.4
A small number of links are exceptionally large in size and are behind the lion's share of overall volumes (Graph 1, left-hand panel, bars). Two thirds of the $28.5 trillion in total lending as of end-2018 were accounted for by 117 bilateral relationships larger than $50 billion in size.
The flip side of the small number of very sizeable links is the high number of small-sized links (left-hand panel, line). As of end-2018, around 50% of all existing bilateral links at the country level were smaller than $100 million in volume. While large in number, these small links make a negligible contribution to overall cross-border credit volumes (0.2% of total cross-border credit volume at end-2018).
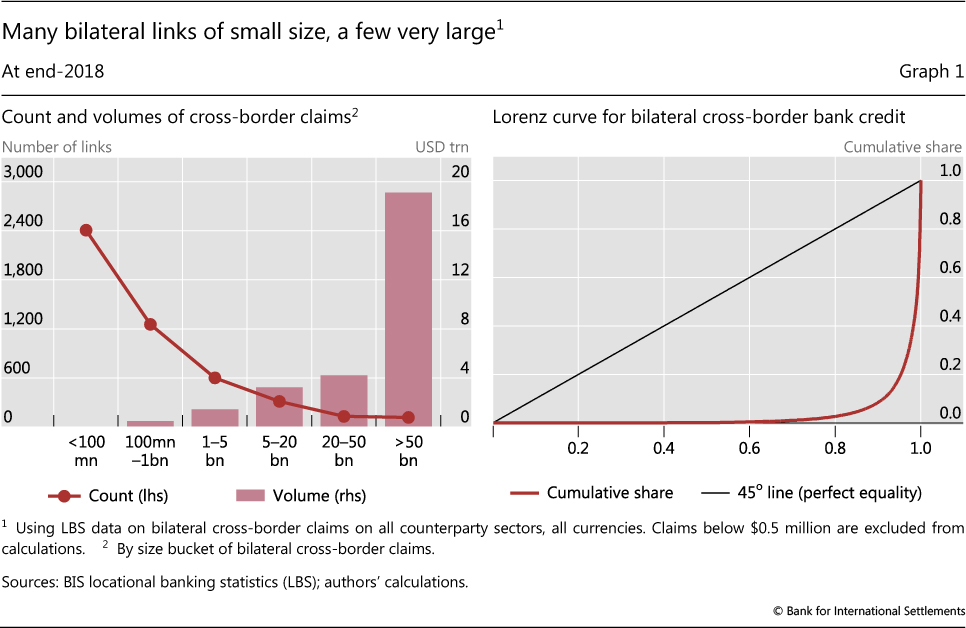
The high degree of concentration in the distribution of cross-border bank links can also be visualised by the Lorenz curve (Graph 1, right-hand panel).5 This curve plots the cumulative share of the number of observations (horizontal axis) versus the cumulative share in associated volumes (vertical axis). The 45° line in the panel represents the benchmark of perfectly equally distributed volumes, which would occur if all bilateral country-level links were of the same size. In practice, the largest 1% of observed cross-border banking links contributed as much to the total volume at end-2018 as the smallest 99%. This indicates an extremely unequal distribution.6
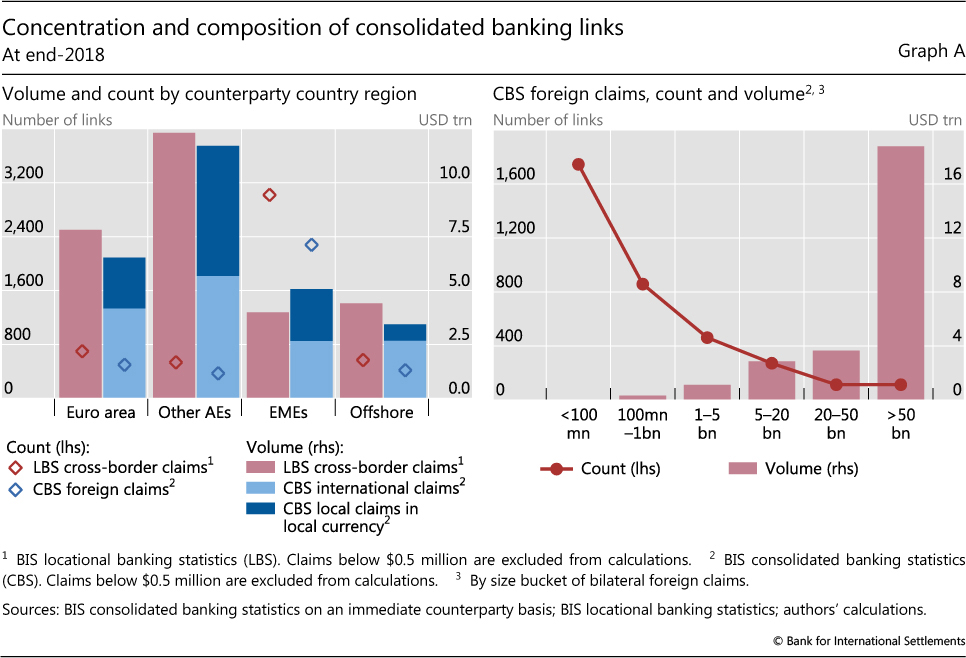
The largest links are mainly between advanced economies (Graph 2): the larger the size of the relationship, the greater the role of advanced economies - in particular, those that are home to major global banks.
At end-2018, 80% of cross-border credit within the group of largest links was vis-à-vis borrowers in advanced economies, with 52% going to non-euro area advanced economies and 28% to euro area countries (left-hand panel). Conversely, EMEs dominate in the smaller links (see also Box B).
Box A
Analysing bilateral country links using the BIS international banking statistics
The BIS international banking statistics (IBS) are collected by national authorities at the bank level but reported to the BIS at the country level; all banks in a given reporting country are aggregated together. Therefore, the IBS measure country-to-country links but do not measure the much larger number of bilateral links between individual banks and borrowers. At end-2018, the locational banking statistics (LBS) captured the positions of more than 8,000 banks, reported as 47 country aggregates. Banks reported their positions against borrowers in more than 215 countries, resulting in 5,927 country-to-country links. Many of these links are for insignificant amounts of less than $0.5 million. Excluding these small links results in 4,822 links greater than $0.5 million.
The LBS include intragroup business and measure the geographical concentration of cross-border business. For example, a US bank might route its cross-border business via a financial centre such as London, resulting in two links: from the United States to the United Kingdom, and from the United Kingdom to the country where the final borrower resides. Therefore, the LBS potentially underestimate concentration of bank creditors because the same banking group may operate in different countries at the same time. The BIS consolidated banking statistics (CBS) take a nationality perspective and consolidate the worldwide claims of a given banking group to the country where it is headquartered.
Not surprisingly, the number of links is much higher in the LBS than the CBS: 4,822 versus 3,550 at end-2018 (Graph A, left- hand panel). In part, this is due to differences in the number of reporting countries: 47 in the LBS, compared with 31 in the CBS. But the different reporting concepts of the LBS and the CBS mean that they cover different elements of international banking links. The CBS, by definition, do not contain claims between affiliates of the same banking group. The CBS, however, include credit extended locally by a foreign office of a given banking group. They distinguish between international claims (cross-border and local claims in foreign currency) and local claims in local currency. Internationally active banking groups tend to have large subsidiaries in advanced economies and in many major emerging market economies, reflected in a relatively high share of local claims in local currency.
In terms of how concentrated international banking is, the cross-border claims in the LBS and foreign claims in the CBS present a very similar picture (Graph A, right-hand panel; see also Graph 1, left-hand panel). The largest size group (>$50 billion) constitutes 3.1% of all consolidated links by number (versus 2.4% for LBS), which amount to 70% of all claims by volume (67% in the LBS). The smallest bilateral links (<$100 million) make up 49% of all consolidated links (50% for LBS) while they amount to only 0.1% of consolidated claims by volume (0.2% for LBS).
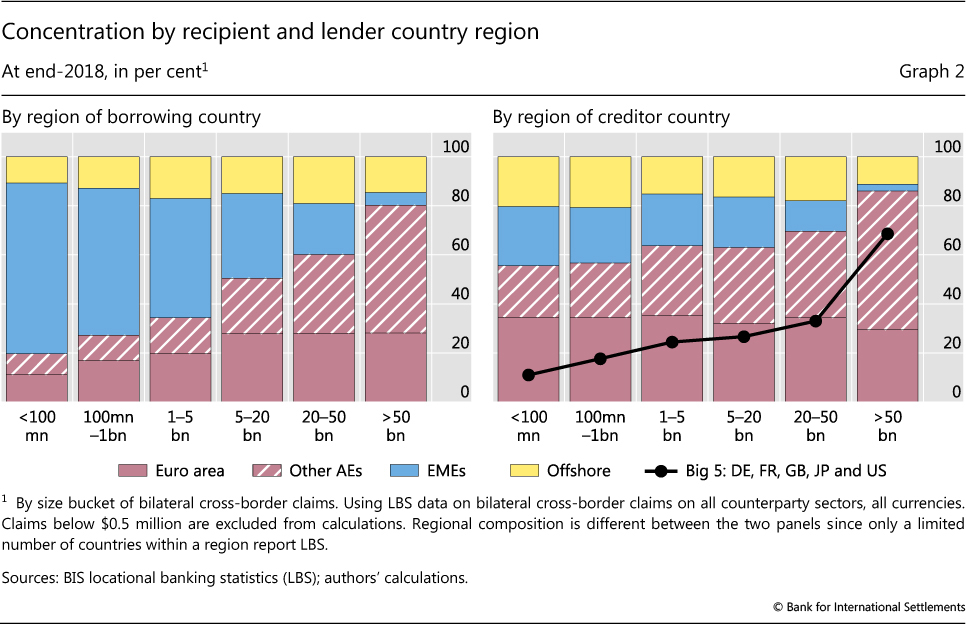
Turning to the creditor country perspective, the concentration around advanced economies is even more pronounced. Across all size groups, advanced economies provide at least 50% of cross-border credit, and more than 80% within the largest size group. Close to 70% of the volume of the largest-sized links, and 55% of total global cross-border credit, is explained by creditors in only five major advanced economies: France, Germany, Japan, the United Kingdom and the United States.
Concentration and the fall in cross-border interbank credit
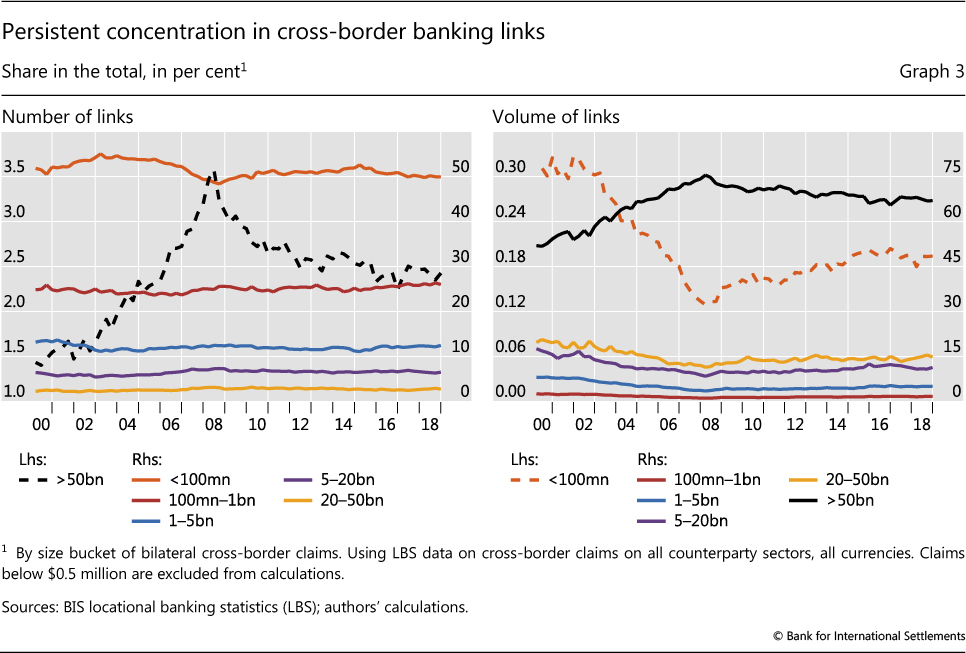
The distribution of links across the different size buckets has been very stable over time. This suggests that concentration is a structural feature of the cross-border banking network. The increase in the share of very large links (Graph 3, left-hand panel, dashed line) in the years before the GFC exacerbated the already high concentration (right-hand panel, black line). The share in total cross-border bank credit volumes of the largest links rose from around 50% to 75% in the six years up to 2008. It has declined only gradually since, to 67% at end-2018.
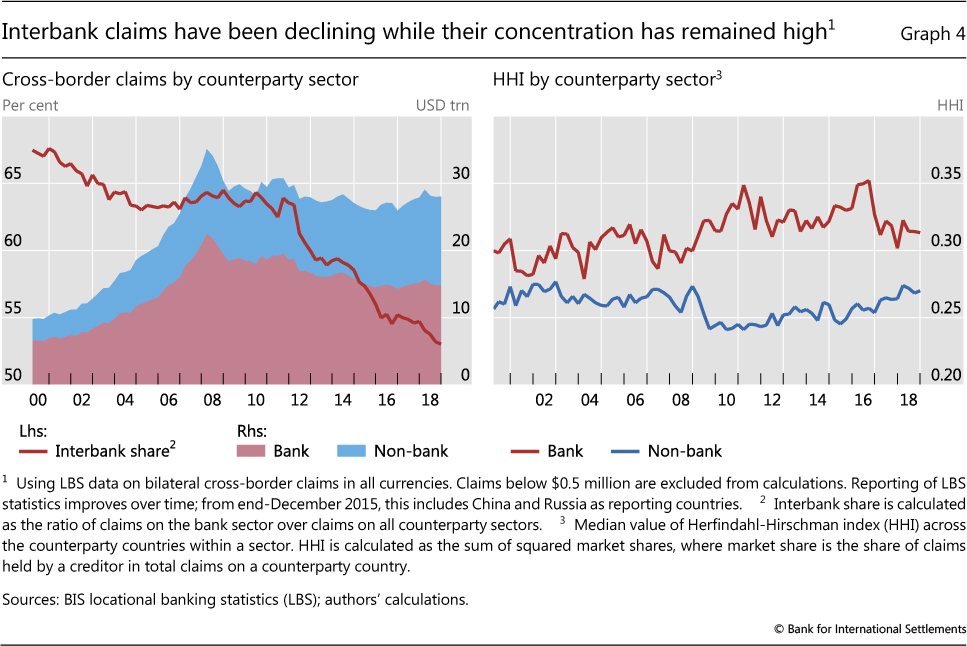
The structural nature of concentration is underscored by how concentration in interbank links responded to the significant fall in cross-border interbank credit in the aftermath of the GFC. While global cross-border bank credit to the non-bank sector has continued to grow since the GFC, cross-border interbank credit has been falling (Graph 4, left-hand panel). This has resulted in a significant and persistent reduction in the share of interbank credit, from around 65% at end-2008 to 53% at end-2018 (red line).
The rapid initial decline in interbank cross-border credit, and the fall in its share, could conceivably have affected concentration in several possible ways. One possibility is that interbank borrowers could have tried to diversify their creditor base in response, because dependency on a concentrated number of creditors exposes them to funding risks. Alternatively, if the structure of the cross-border interbank network were very rigid, all bilateral links might have declined in value to a similar degree and concentration might have remained largely unchanged. A third possibility is that peripheral and smaller links were weaker and suffered relatively larger contractions, which would have resulted in an increase in concentration.
To assess whether the concentration of cross-border credit changed over time, we employ the Herfindahl- Hirschman index (HHI) - a widely used measure of market concentration.7 A value of 1 indicates maximum concentration and implies that all cross-border credit to a given borrowing country comes from only one creditor country. Values above 0.25 are typically considered to signal high concentration, while levels below 0.15 indicate high diversification (US DoJ and FTC (2010)).
Interbank credit is generally more concentrated than credit to the non-bank sector (Graph 4, right- hand panel). This has remained so amid the significant decline in the interbank share in total volumes. The median HHI across all borrower countries in the LBS has been consistently above 0.25 for interbank credit and has not fallen significantly since the GFC.8 Only in recent years does interbank credit seem to have become slightly less concentrated. On a global level, the cross-border interbank network therefore remains concentrated to the same extent as before the GFC, despite its substantially diminished relative importance.
The drop in the interbank share was to a significant extent driven by the well documented contraction in credit extended by European banks following the GFC and the euro area crisis (McCauley et al (2017)). Interbank lending to euro area countries and other advanced economies was particularly affected. Hence, concentration in interbank credit may have responded differently across recipient country regions.
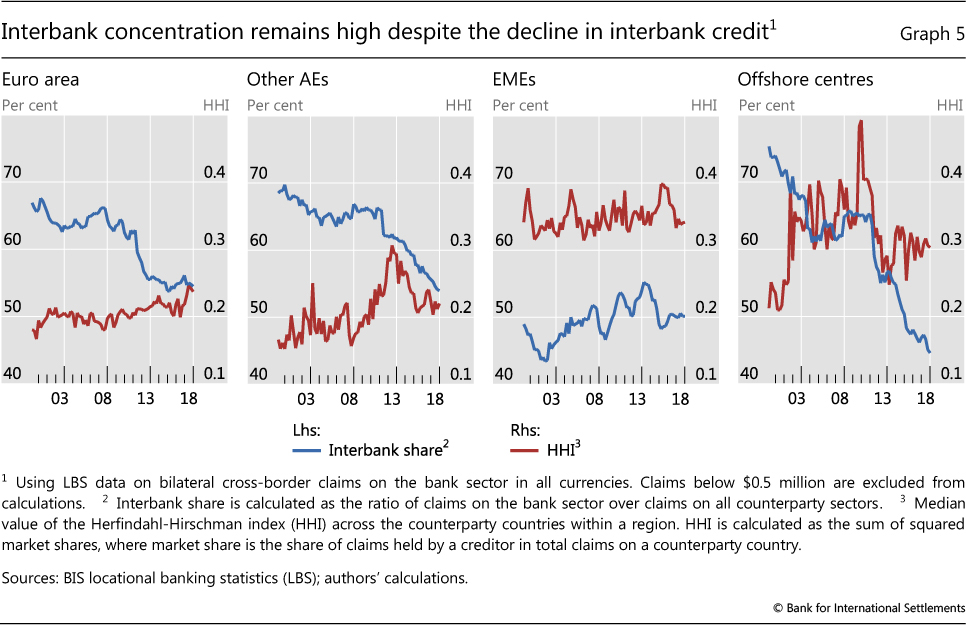
Despite the sharp drop in cross-border interbank credit to euro area countries, concentration in the euro area did not abate but intensified (Graph 5, first panel). This can be explained by the relative stability of interbank links to major euro area countries, which tend to be of large size, while interbank credit to periphery countries recorded strong declines.
Other advanced economies and recipients in offshore centres did see a decline in the concentration of cross-border interbank credit (Graph 5). However, this did not occur in the immediate aftermath of the GFC. The decrease in the concentration of interbank credit for advanced economy borrowers outside of the euro area occurred in more recent years (second panel), and is largely explained by the contraction in the volume of large links coming from offshore centres. Concentration for borrowers in offshore centres (fourth panel) dropped substantially from the peak in 2010, but has not abated further with the continued decline in the interbank share. For borrowers in EMEs, interbank shares have increased slightly since the GFC, mainly driven by China. Concentration in interbank credit is much higher for EME borrowers than for borrowers in advanced economies, but shows no clear trend (third panel).
Conclusions
Cross-border interbank links are highly concentrated. A small number of very large country-level links (>$50 billion), mostly between advanced economies, dominate cross-border bank credit. Just five major creditor countries - France, Germany, Japan, the United Kingdom and the United States - account for 55% of global cross-border credit and close to 70% of the volume of the largest bilateral links. The share of the largest links increased in the run-up to the GFC and has declined only slightly since.
Concentration in cross-border credit is of a structural nature. This is corroborated by the high concentration in interbank links, which persisted amid the significant decline of cross-border interbank credit after the GFC. From a research perspective, a relevant implication of the structurally high concentration in cross-border banking links is that empirical analyses that give equal weight to all observations are likely to yield unreliable results for a number of important questions (Amiti et al (2017)). From a policy perspective, the persistently high concentration in links implies that cross-border banking remains a potentially important channel for transmitting financial shocks.
Box B
The importance of small cross-border banking links for emerging market economies
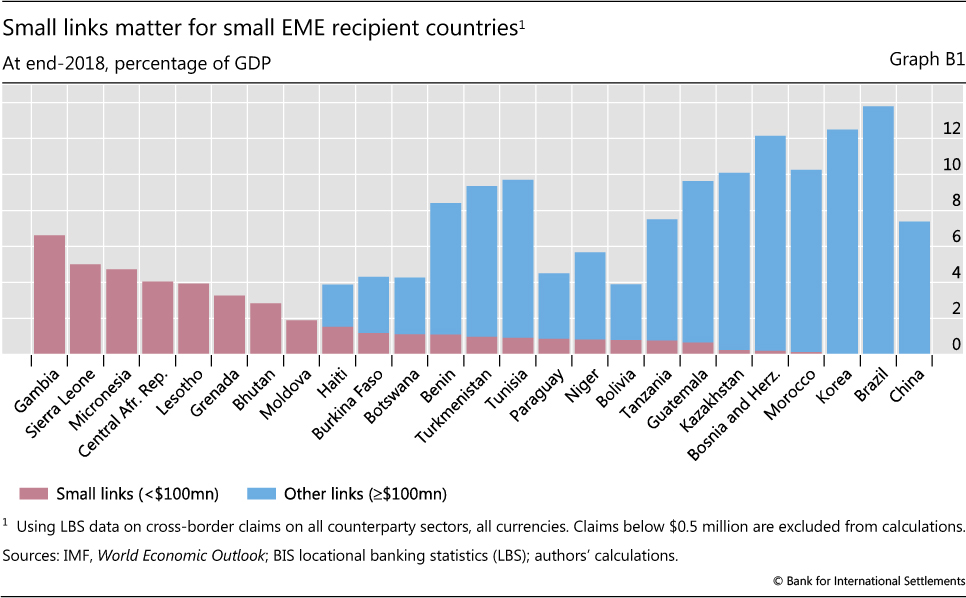
While small links - smaller than $100 million in size - account for a minor share of the total volume of cross-border credit, they account for a significant share of credit to borrowers in many emerging market economies (EMEs). For example, cross-border credit to borrowers in Gambia and Sierra Leone is entirely through small links (Graph B1). But small links are not equally important for all EMEs. For the largest, such as Brazil and China, small links are negligible.
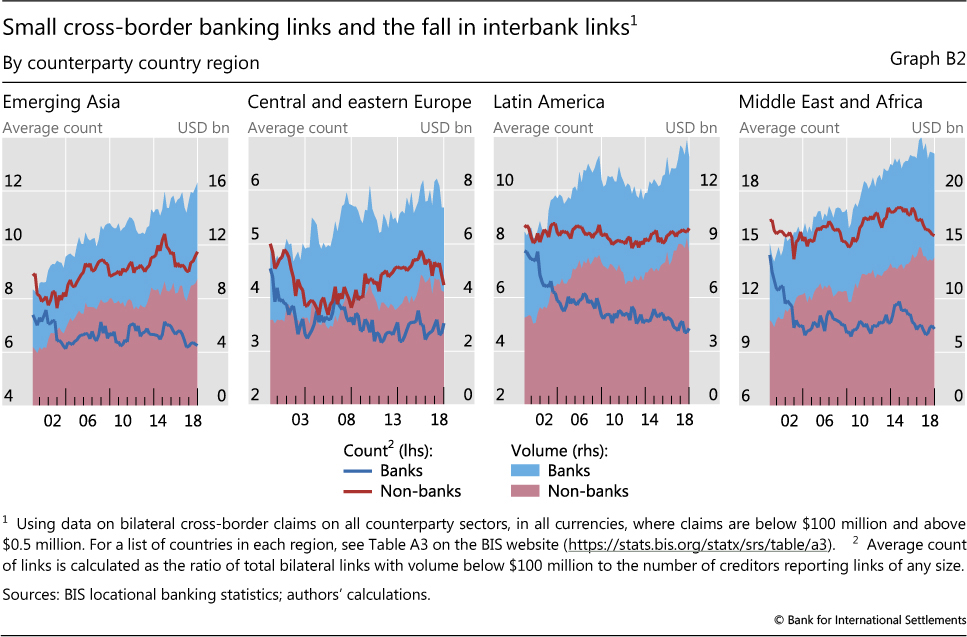
The volume of lending to EMEs associated with small cross-border relationships has increased steadily over the past two decades. This trend is evident for lending to both the non-bank and the bank sector (Graph B2). However, volumes disguise a fall in the average number of small bilateral links between banks and borrowers in EMEs. The only exception is non-bank borrowing in emerging Asia, which saw an increase in the average number of country-to-country links. Since 2014, the average number of interbank bilateral links has been declining for many EMEs, particularly in the Middle East and Africa and in emerging Asia. The decline in correspondent banking relationships in recent years may have contributed to the fall in the number of small bilateral links (CPMI (2019)).
References
Amiti, M, P McGuire and D Weinstein (2017): "Supply- and demand-side factors in global banking", BIS Working Papers, no 639, May.
Avdjiev, S and E Takáts (2014): "Cross-border bank lending during the taper tantrum: the role of emerging market fundamentals", BIS Quarterly Review, September, pp 49-60.
Borio, C, R McCauley and P McGuire (2011): "Global credit and domestic credit booms", BIS Quarterly Review, September, pp 43-57.
Bruno, V and H S Shin (2014): "Cross-border banking and global liquidity", The Review of Economic Studies, vol 82, no 2, pp 535-64.
Claessens, S (2017): "Global banking: recent developments and insights from research", Review of Finance, vol 21, no 4, pp 1513-55.
Committee on Payments and Market Infrastructures (2019): New correspondent banking data - the decline continues, May.
Ehlers, T and P McGuire (2017): "Foreign banks and credit conditions in EMEs", BIS Papers, no 91, March.
Herrmann, S and D Mihaljek (2013): "The determinants of cross-border bank flows to emerging markets: new empirical evidence on the spread of financial crises", Economics of Transition, vol 21, no 3, pp 479-508.
Hüser, A (2015): "Too interconnected to fail: a survey of the interbank networks literature", Journal of Network Theory in Finance, vol 1, no 3, pp 1-50.
McCauley, R, A Bénétrix, P McGuire and G von Peter (2017): "Financial deglobalisation in banking?", BIS Working Papers, no 650, June.
Minoiu, C and J Reyes (2013): "A network analysis of global banking: 1978-2010", Journal of Financial Stability, no 9, pp 168-84.
Moriguchi, C and E Saez (2010): "The evolution of income concentration in Japan, 1886-2005: evidence from income tax statistics", in A Atkinson and T Piketty (eds), Top incomes - a global perspective, Oxford University Press.
Piketty, T (2014): Capital in the twenty-first century, Harvard University Press.
United States Department of Justice and Federal Trade Commission (2010): "Horizontal merger guidelines".
1 The authors would like to thank Stefan Avdjiev, Claudio Borio, Stijn Claessens, Bryan Hardy, Swapan-Kumar Pradhan, Patrick McGuire, Benoît Mojon, Hyun Song Shin, Nikola Tarashev and Philip Wooldridge for valuable comments and suggestions, as well as Deimantė Kupčiūnienė for excellent research assistance. The views expressed in this article are those of the authors and do not necessarily reflect those of the BIS.
2 Creditor banks in a given country are in most cases also cross-border borrowers. This article, however, focuses only on one direction of cross-border bank linkages. While this greatly simplifies the analysis, it misses some relevant liabilities such as cross-border deposits. Nonetheless, it covers cross-border interbank linkages, which proved to be particularly important during the GFC.
3 As our interest lies in country-to-country relationships, throughout our analysis we exclude cross-border claims unallocated by counterparty country and vis-à-vis international organisations.
4 The precision of reporting in the LBS has improved with time. Up to Q2 2012, values were reported to the BIS in integers of millions of US dollars. Since then, values have been reported down to thousands of US dollars by most reporters. This can artificially influence the number of bilateral links. For this reason, in this article we set a threshold of $0.5 million for bilateral links to be considered, ie bilateral links smaller than that amount are set to zero.
5 While highly concentrated and skewed, the network of cross-border bilateral links does not resemble the so-called power law distribution which has been found in some real-world bank networks (Hüser (2015)). Instead, it is better characterised by a log-normal distribution (Minoiu and Reyes (2013)).
6 A numerical representation of the Lorenz curve is the Gini coefficient. A coefficient of 0 (1) indicates maximum equality (inequality). As of end-2018, the Gini coefficient for cross-border banking links stood slightly above 0.85. For comparison, typical Gini coefficients for income distribution in industrialised countries are between 0.3 and 0.5 (Piketty (2014), Moriguchi and Saez (2010)). The Gini coefficient for cross-border bank links is closer to that for bilateral exports (0.83 at end-2018).
7 Applied to the case of cross-border bank credit from a borrower's perspective, the HHI can be defined as:  , where c denotes the creditor country, b is the borrower country and XB is the volume of cross-border claims (in US dollars) from c to b at a given time t.
8 While the level of concentration can differ considerably across individual borrower countries, the median tracks the time trend in the HHI for the great majority of borrower countries.