The geography of dollar funding of non-US banks
Where do non-US banks obtain the funding for the large amount of US dollars they lend? Traditionally, their branches and subsidiaries in the United States were a major source of dollar funding, but the role of these affiliates has declined. Instead, dollars are increasingly raised in the home country. Where dollar funding is raised, however, is distinct from the location of the funding provider, as cross-border liabilities play a large role. In aggregate, a larger share of dollar funding is provided by US residents than is raised at foreign banks' US branches and subsidiaries. In the light of these facts, we discuss potential challenges related to the current geography of dollar funding.1
JEL classification: G15, F30, G21.
Internationally active non-US banks have substantial US dollar assets. How do they fund the $12.8 trillion of dollar liabilities that finances their dollar assets?
This article examines the geography of non-US banks' dollar funding by focusing on two related though distinct questions: Where are dollar liabilities booked (booking location)? And where are the funding providers located (counterparty residence)?
To answer these questions, we use various breakdowns of the BIS locational banking statistics (LBS). Our unit of analysis is the national banking systems, that is, all (reporting) banks of a given nationality (eg French or Japanese banks) rather than individual banks (see Box A for more details on how the data are constructed). We focus on dollar funding obtained from third parties (ie "external" funding) and thereby exclude inter-office positions (liabilities within the same banking group).
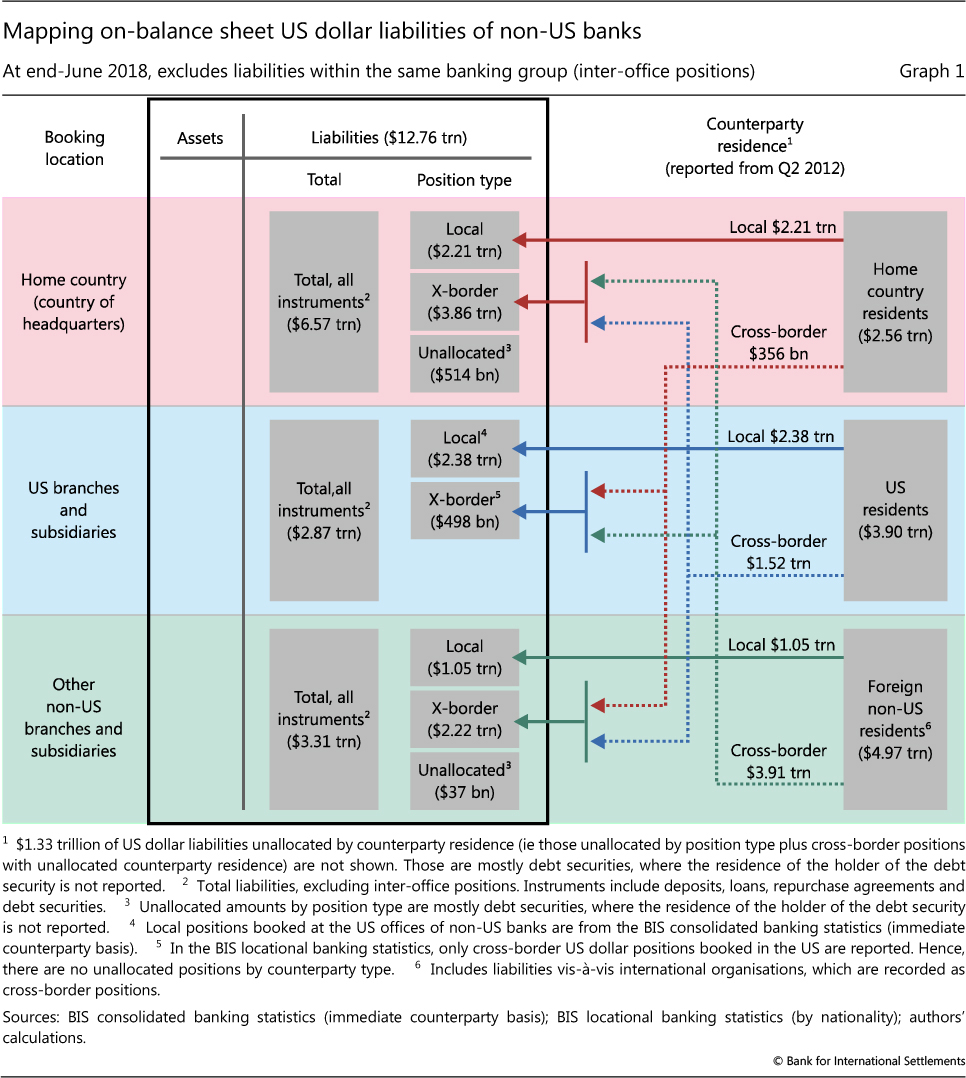
The basic mapping of US dollar funding by non-US banks is depicted in Graph 1. The geographical location is indicated by the coloured horizontal areas. The rectangles on the liability side of the balance sheet indicate the amount of non-US banks' dollar liabilities booked at three different types of locations: the country of the headquarters (red area), the US branches and subsidiaries (blue area) and other non-US locations (green area). As non-US banks have offices located in different parts of the world, their total dollar liabilities are the sum of liabilities booked at their headquarters and subsidiaries and branches across the globe. The location of the funding providers, or counterparties (rectangles on the right-hand side), can be in the same country (local liabilities) or a different country than the booking location (cross-border liabilities).2
Key takeaways
- US dollar liabilities of non-US banks grew after the Great Financial Crisis (GFC). At end-June 2018, they stood at $12.8 trillion ($14.0 trillion including net off-balance sheet positions) - as large as at the peak of the GFC.
- Banks raise relatively fewer dollar liabilities in their affiliates in the US since the GFC. This is due to a rise in the share of dollar liabilities booked in the country where banks are headquartered.
- European banks, which traditionally have had a large US footprint, have shrunk their dollar business and the role of their US affiliates since the GFC. At the same time, non-European banks expanded their dollar borrowing quite rapidly, but in recent years have also raised relatively fewer dollars in the US.
- A large share of US dollar liabilities of non-US banks are cross-border (51% at end-June 2018), implying that the location where US dollar funding is raised is different from the location of the funding provider.
- The global share of US dollar funding provided by US residents is significantly higher than that raised at foreign banks' US branches and subsidiaries, though these shares vary across banking systems.
We structure our analysis based on the mapping in Graph 1, moving from the booking locations on the left side to the location of funding providers on the right. The first section examines the role of the US branches and subsidiaries of non-US banks (the US as a booking location). It highlights that since the 2007-09 Great Financial Crisis (GFC), their role has declined. European banks, which traditionally had a large footprint in the US, have shrunk their dollar liabilities (McCauley et al (2017)) - in particular those raised through their US branches and subsidiaries. By contrast, non-European banks, which have a relatively smaller US footprint, expanded their dollar borrowing quite rapidly. The second section documents the increased role of the country of the bank's headquarters as a booking location. The third section examines local versus cross-border liabilities (position type) and documents that a large share of dollar borrowing is cross-border. The fourth section contrasts the share of US dollar funding obtained from US residents with the share of dollars booked at the US branches and subsidiaries of non-US banks (right- versus left-hand side of Graph 1). It finds that US residents remain an important source of dollar funding, despite the reduced role of the US operations of non-US banks. The final section discusses potential challenges related to the current geography of dollar funding.
The relative decline of the US as a booking location
In the aftermath of the GFC, non-US banks' on-balance sheet US dollar liabilities have increased steadily (+20%), from $10.6 trillion at end-2009 to $12.8 trillion at end-June 2018 (Graph 2, left-hand panel). On-balance sheet liabilities, however, do not cover all dollar borrowing. Global banks widely use off-balance sheet FX derivatives such as swaps for dollar funding (Borio et al (2017)). The available data do not provide a measure of such borrowing.3 But estimates of the net amounts - under the assumption that banks do not have dollar balance sheet mismatches - can be constructed for many of the largest national banking systems.4 When these estimates are included, total dollar liabilities reached $14.0 trillion at end-June 2018. We focus on on-balance sheet liabilities, however, as data for off-balance sheet positions are too scarce.5
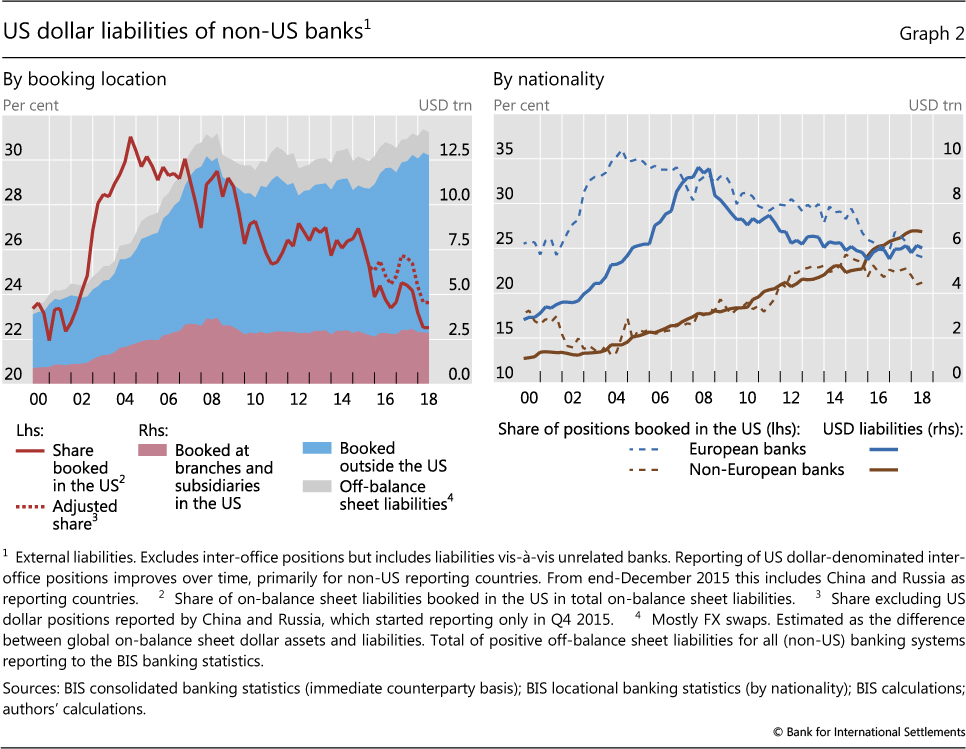
As dollar liabilities rose after the GFC, non-US banks raised relatively fewer dollars in their US affiliates. The share of on-balance sheet dollar liabilities booked by their branches and subsidiaries in the United States declined from 30% at end-September 2008 to 23% at end-June 2018.6 During the GFC, the US branches and subsidiaries of foreign banks absorbed a major share of the emergency liquidity provided by the Federal Reserve (Fleming (2012)). This led to a temporary rise in the share of dollar liabilities booked in the US. Since then, this share has been on a downward trend.
Box A
Constructing the dollar positions of international banks with BIS statistics
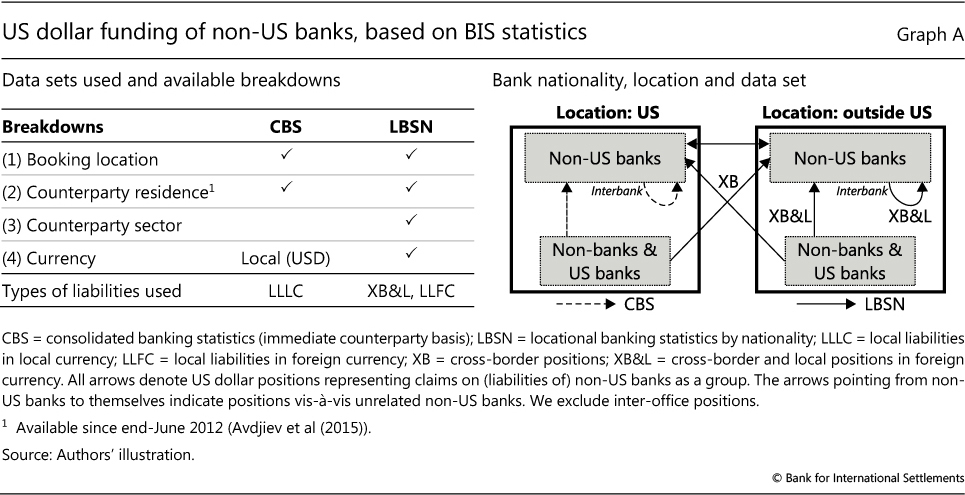
The analysis in this feature requires the estimation of US dollar liabilities by bank nationality (ie where the headquarters are located), broken down by the location of the booking office and the location of the counterparty. We follow the approach outlined in McGuire and von Peter (2009) and construct dollar positions by combining the BIS consolidated banking statistics on an immediate counterparty basis (CBS) with BIS locational banking statistics by nationality (LBSN). The summary of breakdowns available in the two data sets is given in the left-hand panel of Graph A. The CBS are organised on the principle of bank nationality and present reporting banks' consolidated foreign claims, broken down into international claims and local claims in local currencies (ie local currency positions booked by banks' foreign offices vis-à-vis residents of the host country). They have limited information about bank liabilities, but they do include their local liabilities in local currency. The LBSN are collected from the jurisdiction where the activity takes place, then broken down according to the nationality (headquarters) of the reporting banks. Each bank office (headquarters, branches, subsidiaries) in a BIS reporting country reports cross-border liabilities as well as foreign currency liabilities vis-à-vis residents in that reporting country. Along with the nationality breakdown, the LBSN also break down positions by currency, counterparty sector and, since end-June 2012, counterparty residence.
The right-hand panel of Graph A illustrates how we combine the two data sets to approximate the US dollar liabilities of non-US banks. Importantly, we exclude interbank positions vis-à-vis offices of the same banking group (ie inter-office liabilities). In the CBS these are excluded by construction by virtue of consolidation, whereas in the LBSN they can be excluded thanks to the counterparty sector breakdown.
As the CBS do not provide a currency breakdown, we only use these data to quantify the local liabilities in local currency booked by non-US banks in the US, where the currency is the dollar by definition (dashed arrows). As the CBS do not provide a counterparty sector breakdown for local positions in local currencies, we cannot distinguish between interbank liabilities (both to US banks and to non-US banks) and liabilities to non-banks. We use the LBSN for all the rest (solid arrows). In particular, we extract cross-border dollar liabilities to US banks and non-banks in the US (solid arrow connecting the stylised locations) as well as cross-border and local liabilities (vis-à-vis US banks, unrelated non-US banks and non-banks located outside the US (solid arrows inside the right-hand box)). These liabilities can be booked either in the home country of any particular non-US banking system (eg a Canadian bank booking US dollar liabilities in Canada) or in BIS reporting countries other than the US and the home country (eg a Canadian bank booking US dollar liabilities through a branch in France). Importantly, these liabilities can themselves be either local or cross-border. An example of the former would be a Canadian bank branch in France booking a US dollar liability vis-à-vis a resident of France; an example of the latter would be a Canadian bank branch in France booking a US dollar liability vis-à-vis a resident of Germany.
Most of the article focuses on US dollar liabilities. We therefore restrict the description in this box to dollar liabilities. The logic for building dollar asset positions is analogous. Positions are broken down by USD, EUR, JPY, GBP, CHF, the domestic currency of the country where the office is located, and all others. While we do not use the counterparty sector breakdown (other than for subtracting inter-office positions), we include it in the table to illustrate available breakdowns.
The overall decline in the share of dollars raised in the United States masks contrary trends in dollar borrowing by European and non-European banks. European banks, which traditionally had a large presence in the United States,7 reduced their dollar borrowing and raised relatively fewer dollars through their US affiliates post-GFC (Graph 2, right-hand panel). By contrast, other non-US banks, notably Australian, Canadian and Japanese ones, expanded their aggregate dollar borrowing at a rapid pace, overtaking European banks in the first quarter of 2016. Their US footprint has been increasing, though from a lower base. Since 2015, however, the share of dollar liabilities booked in the US has been declining for both European and non-European banks.
The rise of dollar liabilities booked in the home country
If the global share of US dollar liabilities booked in the US is declining, where have dollar liabilities moved instead? Non-US banks book an increasing share of their dollar liabilities in their home jurisdictions, ie the country where their headquarters are located. As of end-June 2018, more than 50% of dollar liabilities were booked in the home country.
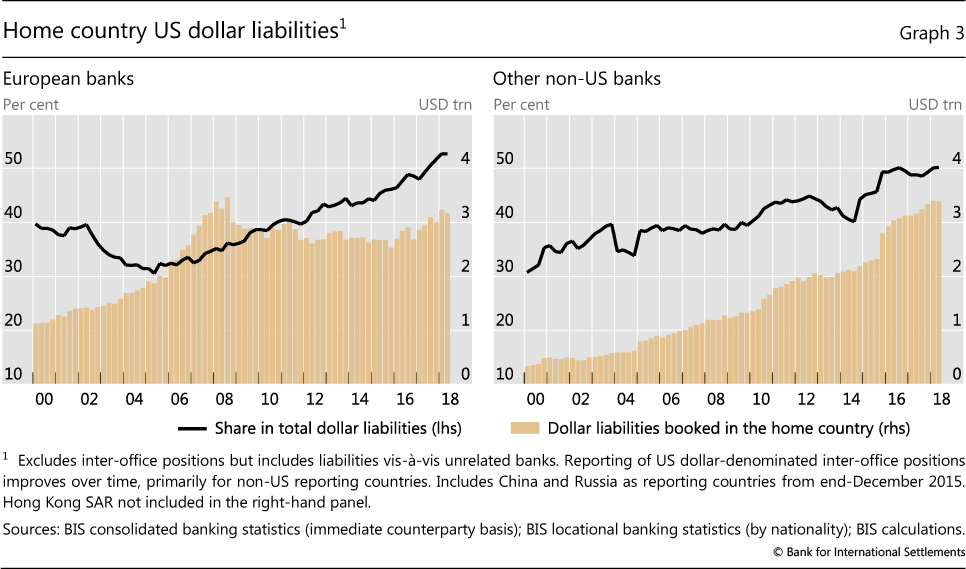
This trend is visible for both European and other non-US banks (Graph 3). For European banks, this occurs against the backdrop of relatively flat dollar liabilities booked at home in absolute amounts. For other (non-European, non-US) banks, the share of dollar liabilities booked in the home country has been increasing in tandem with the absolute amounts. This is due to a large extent to Canadian and Japanese banks.
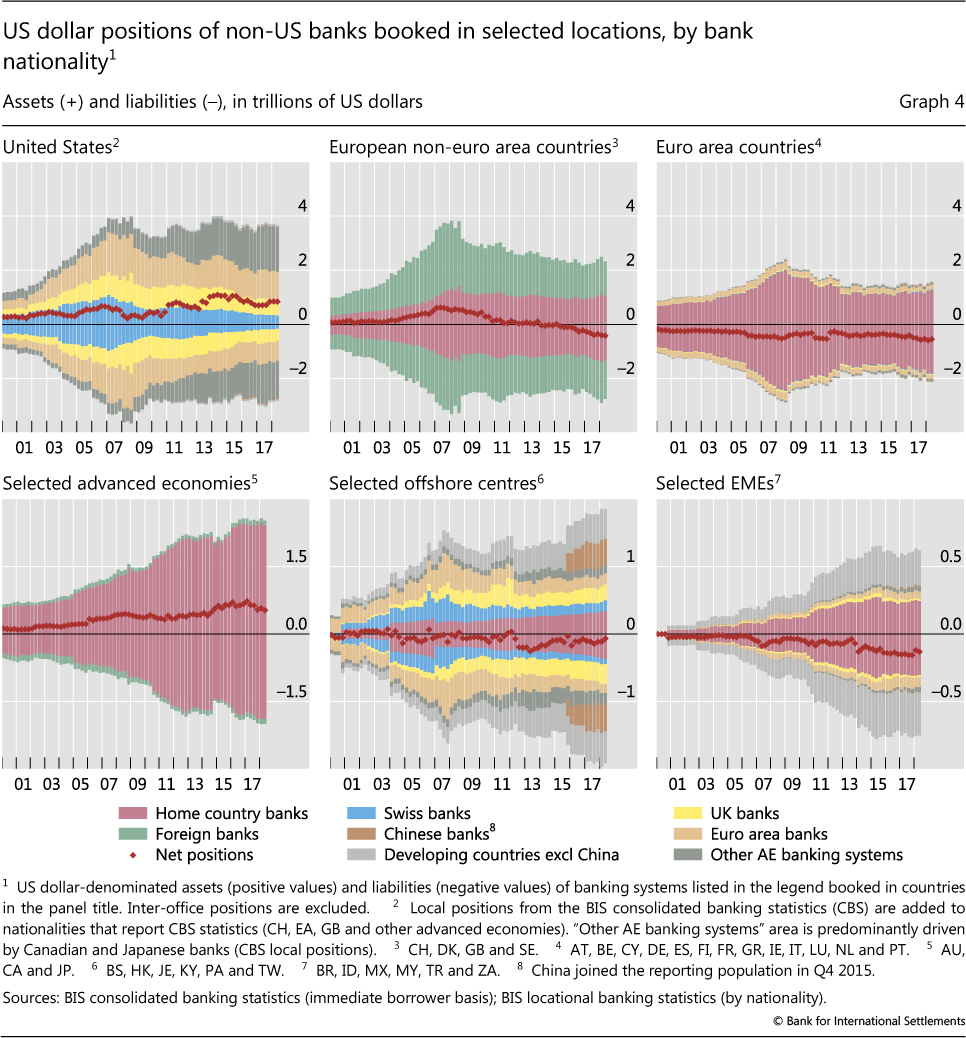
Graph 4 provides a more detailed overview of where non-US banks book their dollar assets (positive bars) and liabilities (negative bars). The patterns on the liability side are largely mirrored by those on the asset side, suggesting that banks try to match their dollar positions in a given booking location. A positive or negative net position (red dots) can occur due to unmatched inter-office positions or off-balance sheet positions, which are both excluded from our analysis. If dollar assets are greater than liabilities at a given booking location, non-US banks transfer dollars from other offices to this location or raise off-balance sheet funding to finance the dollar assets.
While the US remains the largest single booking location (Graph 4, top left-hand panel), the overall volume of dollar funding raised outside the US has risen. At the same time, there have been notable shifts across non-US booking locations. Non-US banks have reduced their dollar positions booked in European countries, both within and outside the euro area (top centre and top right-hand panels). Meanwhile, dollar funding raised in advanced non-European economies such as Australia, Canada and Japan has risen sharply (bottom left-hand panel). While the United States and the United Kingdom host branches and subsidiaries with large dollar liabilities of a broad set of bank nationalities, other major booking locations in most advanced economies are dominated by home country banks.
Offshore financial centres (OFCs) continue to be important booking locations for dollar positions (Graph 4, bottom centre panel). While total OFC positions have grown, there has also been a shift within this category from non-Asian to Asian OFCs. By the nature of their business model, dollar assets and liabilities booked in OFCs closely match each other. US dollar liabilities raised in emerging market economies (EMEs) have risen rapidly in recent years (bottom right-hand panel). These locations mostly serve either home country banks or banks headquartered in other EMEs.
The large cross-border component of dollar liabilities
We now take a closer look at whether US dollar liabilities are local or cross-border ("position type" in Graph 1; see also Box A for examples).
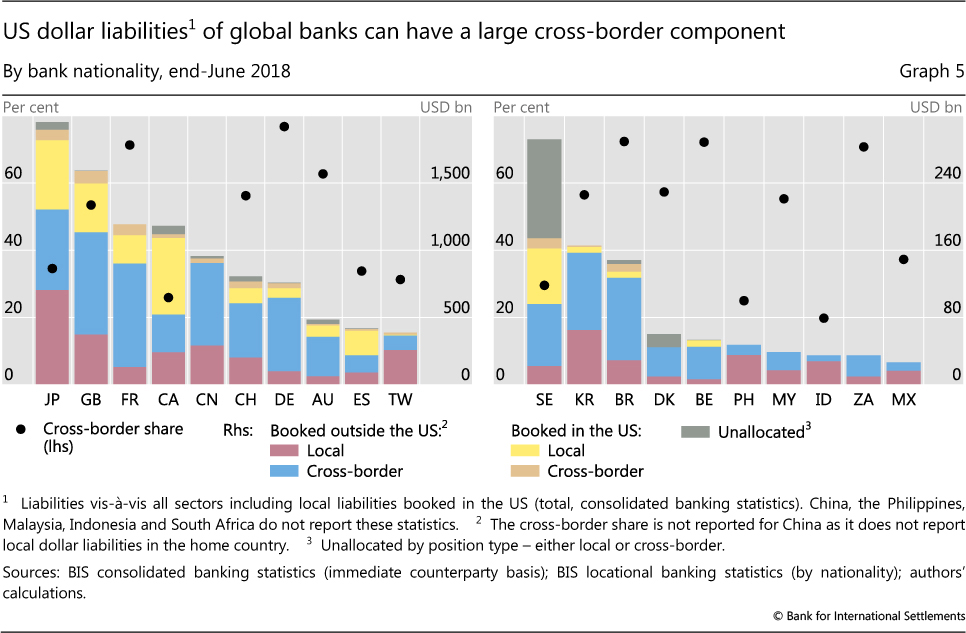
On-balance sheet dollar liabilities of non-US banks have a significant cross-border component (Graph 5). Overall, the cross-border share for all reporting banking systems stood at 51% as of end-June 2018. For some advanced economy banking systems (eg Australian, French, German, Swiss and UK banks), this is mostly due to the large amount of dollar liabilities booked cross-border outside the US (left-hand panel, blue bars). In most cases these are largely booked in the bank's headquarters country.8
For some bank nationalities, however, the local component is high - typically reflecting local borrowing by the branches and subsidiaries in the United States (Graph 5, yellow bars). This applies to Canadian, Japanese and Spanish banks. Yet these banks also have sizeable cross-border dollar liabilities in absolute terms.
The share of cross-border dollar liabilities is high for many major EME bank nationalities, though the picture is diverse. It is higher for banks from certain countries, including Brazil, Malaysia and South Africa. Banks from other jurisdictions such as Indonesia and the Philippines, however, have relatively small cross-border shares, as most of their liabilities are local and booked outside the US.
Booking location versus counterparty residence
An implication of the large cross-border share is that the booking location and the residence of the counterparty providing the dollar funding differ to a large degree. In this section, we contrast the share of liabilities booked in the US and in the home country (left-hand side of Graph 1, blue and red areas) and the share of dollar funding provided by US and home country residents (right-hand side, blue and red areas).
At the aggregate level, US residents account for a significantly larger share of dollar liabilities of non-US banks than the share booked at the US branches and subsidiaries of those non-US banks. In other words, while non-US banks still make use of their US affiliates to raise dollars from US residents, there is also a significant cross-border flow of dollars from US residents to their non-US offices - such as the headquarters or an office in an offshore financial centre.
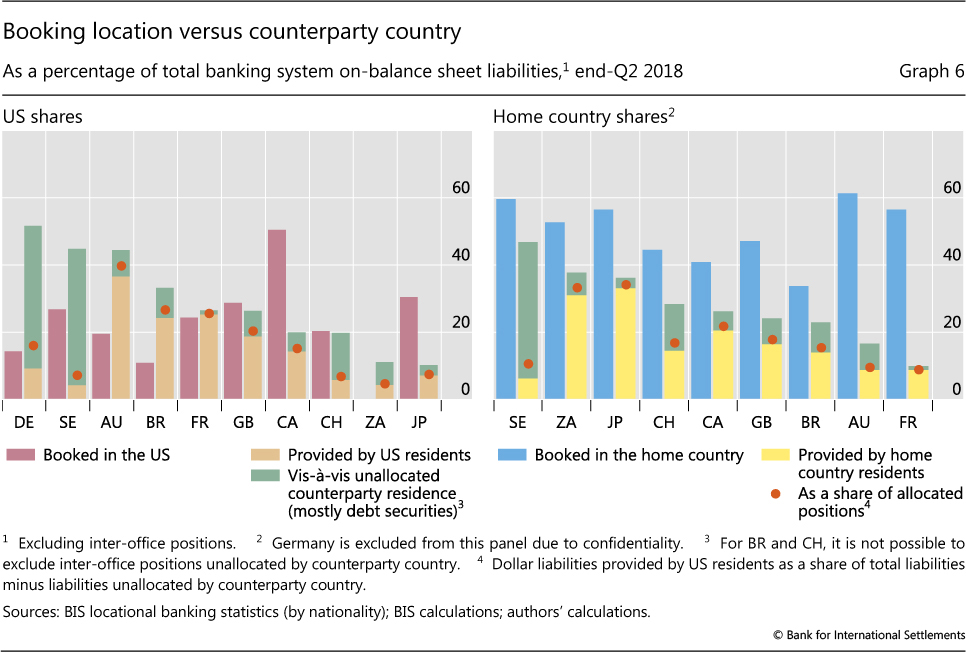
In aggregate, the share of funding provided by US residents in total dollar liabilities stood at 30% at end-June 2018 (versus a share of 23% booked in the United States). But the actual share is probably higher, since a portion of reported liabilities (especially debt securities) are not allocated to any counterparty country ($1.33 trillion at end-June 2018). US dollar-denominated debt securities, however, are to a substantial extent held by US residents (Maggiori et al (2018)). A more realistic estimate of the US resident share is obtained by assuming that the share in the unallocated portion matches that in the portion where residence data are provided (Graph 6, orange dots) - in this case the global share is 34%. It is also possible to allocate part of the unallocated portion by using the Treasury International Capital survey of US holdings of foreign securities. With the help of these data, we estimate that, of the $1.33 trillion unallocated by counterparty country, around $658 billion can be allocated to US residents (Box B). The share of dollar funding provided by US residents would then rise to 36%.
Banks from most countries, especially European ones, fit the aggregate pattern whereby liabilities vis-à-vis US residents exceed liabilities booked in the US (Graph 6, left-hand panel). The most notable exceptions are Canadian and Japanese banks, which book a significant share of their dollar liabilities in the US.
Conversely, dollar liabilities booked in the home country tend to account for a larger share than those provided by residents in the home country (Graph 6, right-hand panel, blue versus yellow bars). Banks book a large share of dollar liabilities in their home countries, but a substantial portion ultimately comes from cross-border lenders in the United States and elsewhere. A precise estimate of these shares depends on how one allocates liabilities which are currently unallocated by counterparty country (green bars). But even if those liabilities were to be entirely allocated to home country residents (an unlikely scenario), the shares of dollar liabilities booked in the home country would still be larger than those vis-à-vis home country residents.
Box B
Estimating non-US banks' dollar debt securities held by US residents
A significant amount of non-US banks' dollar liabilities cannot be allocated to a counterparty country ($1.33 trillion out of $12.76 trillion as of end-June 2018). However, it is possible to allocate parts of this amount to US residents by using the Treasury International Capital (TIC) survey of US holdings of foreign securities, in combination with the BIS international debt securities statistics (IDS) and locational banking statistics by nationality (LBSN).
As of end-2017, US residents held $701 billion of debt securities issued by non-US banks, 93% of which were dollar-denominated ($652 billion). If we apply the same dollar share to securities issued by other financial institutions, US residents also held $586 billion in this category, an estimated $73 billion of which were issued by firms with non-US banks as ultimate parent. This leaves $725 billion (= $652 billion+ $73 billion) to be allocated to US residents based on the TIC data. We then subtract non-US banks' dollar-denominated debt securities already allocated to US residents in the LBSN ($227 billion) to reach $498 billion. This represents 49.4% of total dollar liabilities of non-US banks unallocated by counterparty country at end-2017 (which totalled $1 trillion). Our estimate of $658 billion in the main text applies the end-2017 ratio to the $1.33 trillion dollar liabilities unallocated by counterparty country in the second quarter of 2018.
See ticdata.treasury.gov/Publish/shca2017_report.pdf. Table A15 presents the US holdings of foreign debt securities, and p 20 shows the dollar share of such holdings. This number is obtained by using the BIS IDS, as of end-2017, to compute the share of dollar-denominated international debt securities issued by non-US bank-owned other financial institutions in the total issued by non-US other financial institutions. This share, which stood at 12.4% as of end-2017, is very stable over time.
Conclusion
Non-US banks have very large US dollar liabilities - similar in magnitude to those they had in 2007-08 when markets started to face a dollar squeeze (McGuire and von Peter (2012)). The share of dollar funding raised in the United States by non-US banks' branches and subsidiaries has declined. Yet a significantly larger share of dollar liabilities is nonetheless provided by US residents, by way of cross-border flows.
How might this funding configuration behave in times of market stress? Non-US creditors may be pressured to withdraw funding as they might face a dollar funding squeeze themselves. The fact that a large share of dollars is provided by US residents, who are less likely to face dollar liquidity problems, may therefore alleviate potential funding risks to some extent. On the other hand, the ability to raise dollar funding outside the United States can prove stabilising in a situation where funding conditions in the US become more difficult, as evidenced by the adjustment of non-US banks to the 2016 US money market fund reform (Aldasoro et al (2017)).
The high cross-border share of dollar funding and the increased centralisation of funding by non-US banks at their headquarters highlight the importance of the stability of cross-border flows. Cross-border funding, regardless of the source, may be fickle in a crisis, as the GFC demonstrated (Borio et al (2011)). This is especially true when funding sources are concentrated geographically. It also points to the importance of policy instruments that allow the official sector to provide dollar liquidity in a crisis, such as central bank swap lines (BIS (2014), Mehrling (2015)).
These considerations suggest that it is not clear-cut whether the current geography of dollar funding implies that the funding risks which characterised the dollar shortage around the GFC have increased or decreased. Aspects not discussed here, such as the rise of collateralised borrowing, will also be relevant. Monitoring these developments is complicated by data gaps, such as the lack of consistent information on off-balance sheet derivatives and on the geographic and sectoral distribution of holdings of international debt securities. In any event, the sheer size and complexity of non-US banks' dollar liabilities warrants attention (BIS (2017)).
References
Aldasoro, I, T Ehlers and E Eren (2018): "Business models and dollar funding of global banks", BIS Working Papers, no 708, March.
--- and R McCauley (2017): "Non-US banks' global dollar funding grows despite the US money market reform", BIS Quarterly Review, pp 22-3, March.
Avdjiev, S, P McGuire and P Wooldridge (2015): "Enhanced data to analyse international banking", BIS Quarterly Review, September, pp 53-68.
Bank for International Settlements (2014): "Re-thinking the lender of last resort", BIS Papers, no 79, September.
--- (2017): "The financial sector - preparing for the future", 87th Annual Report, June, Chapter V.
Borio, C, R McCauley and P McGuire (2011): "Global credit and domestic credit booms", BIS Quarterly Review, September, pp 43-57.
--- (2017): "FX swaps and forwards: missing global debt?", BIS Quarterly Review, September, pp 37-54.
Fleming, M (2012): "Federal reserve liquidity provision during the financial crisis of 2007-09", Annual Review of Financial Economics, vol 4, no 1, October, pp 161-77.
Kreicher, L, R McCauley and P McGuire (2013): "The 2011 FDIC assessment on banks' managed liabilities: interest rate and balance-sheet responses", BIS Working Papers, no 413, May.
Maggiori, M, B Neiman and J Schreger (2018): "International currencies and capital allocation", NBER Working Papers, no 24673, May.
McCauley, R, A Bénétrix, P McGuire and G von Peter (2017): "Financial deglobalisation in banking?", BIS Working Papers, no 650, June.
McGuire, P and G von Peter (2009): "The US dollar shortage in global banking and the international policy response", BIS Working Papers, no 291, October.
--- (2012): "The dollar shortage in global banking and the international policy response", International Finance, vol 15, no 2, pp 155-78.
Mehrling (2015): "Elasticity and discipline in the global swap network", INET Working Papers, no 27, November.
1 The authors thank Stefan Avdjiev, Claudio Borio, Stijn Claessens, Ben Cohen, Zuzana Filková, Robert McCauley, Patrick McGuire, Kristina Mićić, Swapan-Kumar Pradhan, Hyun Song Shin, Nikola Tarashev and Philip Wooldridge for valuable comments and suggestions, as well as Jakub Demski for excellent research assistance and Mario Barrantes for invaluable input into the design of Graph 1. The views expressed in this article are those of the authors and do not necessarily reflect those of the BIS.
2 A significant share of liabilities ($1.33 trillion out of $12.76 trillion at end-June 2018) is unallocated by counterparty residence and therefore cannot be assigned to any of the three locations shown in Graph 1. This applies in particular to debt securities which are traded on the secondary market. See Box B for an estimate of unallocated liabilities that can be attributed to US residents.
3 The BIS OTC derivatives statistics indicate that non-US banks reported $25 trillion (notional) in dollar-denominated FX swap positions as of end-June 2018, but this includes all transactions with a dollar leg (ie dollar-receiving and dollar-providing transactions).
4 Implied FX swaps are constructed for each bank nationality as the difference between US dollar assets and US dollar liabilities. When dollar assets exceed dollar liabilities, banks are assumed to hedge the mismatch by receiving dollars via FX swaps. For details, see McGuire and von Peter (2009, 2012).
5 Henceforth, we use the term "liabilities" to include only on-balance sheet items.
6 China and Russia joined the reporting population in the fourth quarter of 2015. Excluding these two countries yields a share of 24% at end-June 2018.
7 See, in particular, Kreicher et al (2013) and Aldasoro et al (2018).
8 For instance, a UK bank booking a dollar liability at its headquarters in the UK (ie home country) vis-à-vis a resident in France (ie cross-border).