OTC derivatives: euro exposures rise and central clearing advances
The composition of amounts outstanding in over-the-counter derivatives shifted towards the euro and cleared instruments. Since the Great Financial Crisis, increases in central clearing rates have helped shape growth in amounts outstanding. Derivatives subject to regulatory clearing mandates were approaching full clearing, while clearing rates were low for certain products, including some with short maturities or liquid bilateral markets.1
JEL classification: G10; G18; G23.
Over-the-counter (OTC) markets are increasingly important for many types of derivative. This article examines how the composition of outstanding OTC derivatives has changed as they have become increasingly prevalent in financial markets. To explore the currency composition of outstanding OTC derivatives and trends in clearing, we draw on data from the combined BIS semiannual derivatives statistics and Triennial Central Bank Survey of OTC derivatives markets.2
The combined surveys show that interest rate derivatives still accounted for the largest share of the OTC derivatives recorded by dealers in advanced economies (AEs), while FX derivatives predominated in the outstanding positions of dealers from emerging market economies (EMEs). The euro's share rose globally, accounting for 44% of AE dealers' outstanding contracts by market value at end-June 2019, compared with 24% in US dollars. The euro became more relevant for dealers from emerging Europe in particular. Nevertheless, the US dollar remained the pre-eminent currency for EME dealers.
Since the Great Financial Crisis (GFC) of 2007-09, the dynamics of amounts outstanding in OTC derivatives markets have been shaped, in part, by regulatory reforms agreed at the 2009 G20 summit. Central clearing is a key element in authorities' efforts to reform OTC derivatives markets and reduce systemic risk. The data on outstanding positions show that clearing rates increased substantially from 2010 to 2017. By 2019, contracts subject to mandatory clearing were cleared almost entirely by central counterparties (CCPs).3 For OTC derivatives not subject to mandatory clearing, clearing rates varied across products, even though margin requirements incentivised central clearing.
The next section of this article discusses recent trends in outstanding positions. The second section focuses on clearing, and the final section concludes.
Key takeaways
- The management of interest rate risk continued to dominate global OTC derivatives activity, although FX derivatives were more important among dealers from emerging market economies.
- Among dealers from emerging market economies, the share of interest rate derivatives cleared rose to the high levels reported by dealers from advanced economies.
- After increasing substantially following the GFC, clearing rates have levelled off recently, with mandated products approaching full clearing.
Statistical data: data behind all graphs
Trends across countries and currencies
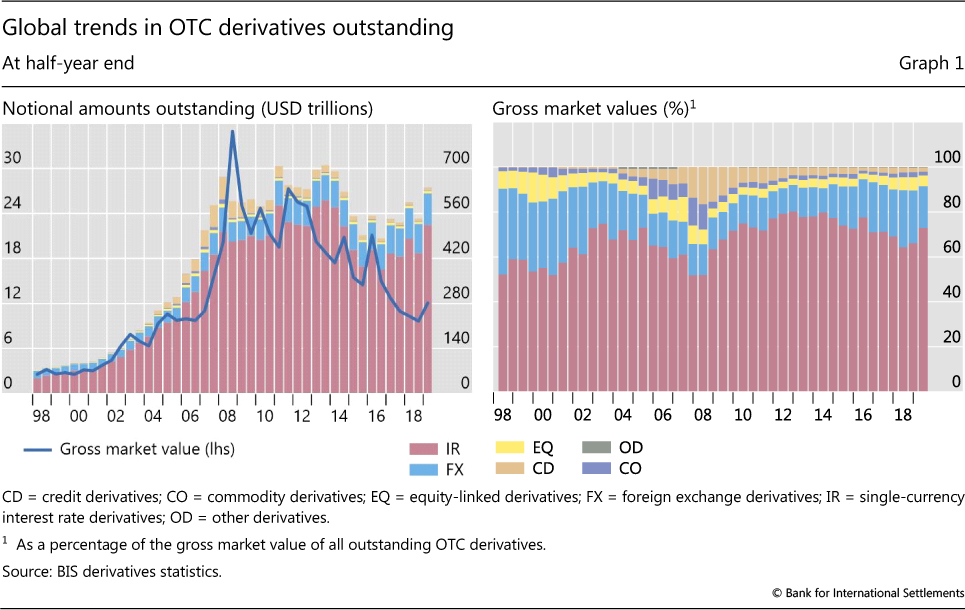
The notional amount of OTC derivatives, which determines contractual payments, rose to $640 trillion at end-June 2019 (Graph 1, left-hand panel). This was its highest level since 2014, continuing an upward trend that started in 2015. Over the same period, the global sovereign and non-financial corporate bond markets expanded at a similar pace. The turnover of OTC derivatives rose even more rapidly than notional amounts, probably because (i) trade compression limited notional growth and (ii) turnover rose mainly for shorter-maturity instruments that are rolled over frequently (Ehlers and Hardy (2019) in this issue).
In contrast to the notional amount, gross market value, which is a better gauge of amounts at risk, has trended downward since 2012 (left-hand panel). It totalled about $12 trillion in mid-2019, compared with $15 trillion in mid-2015 and $26 trillion in mid-2012. Netting agreements reduced dealers' credit exposure to $2.7 trillion at end-June 2019, equivalent to 22% of gross market value. In OTC derivatives markets, these credit exposures are typically covered by collateral.4
Further reading
OTC derivatives referenced mainly interest rates. At end-June 2019, interest rate derivatives represented 73% of outstanding contracts by gross market value (Graph 1, right-hand panel). FX derivatives came a distant second, with 18%. Other derivatives, mostly in the form of equity and credit derivatives, accounted for 9% of gross market value. For AE dealers, exposures were concentrated in interest rate derivatives (74%); for EME dealers, they were mainly in FX derivatives (57%) (Graph 2, left-hand panel).5
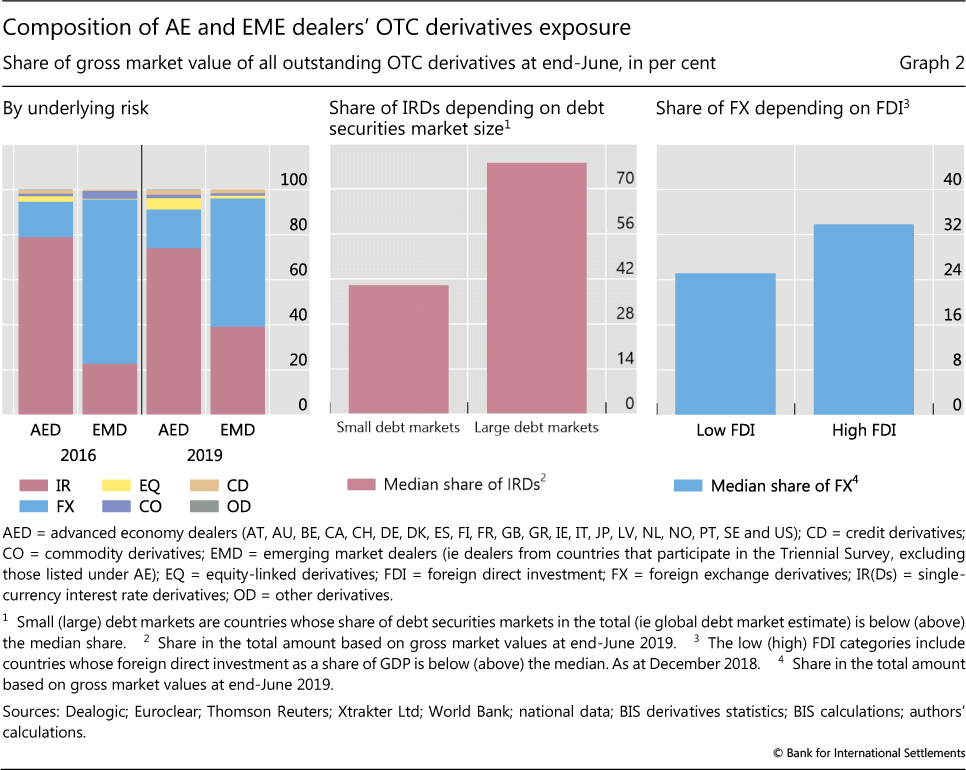
Differences in exposures reported by AE and EME dealers reflected structural economic differences across countries. In particular, exposure to interest rate derivatives was higher for dealers from countries with larger debt securities markets, while FX derivatives were more significant for dealers from countries receiving relatively more foreign direct investment (Graph 2, centre and right-hand panels). The balance sheet composition of AE and EME dealers also differed in terms of currencies. AE dealers reported that their exposures consisted mainly of derivatives referencing the euro and the US dollar: 44% and 24%, respectively, at end-June 2019. For EME dealers, the US dollar was the key reference currency, representing 41% of their exposures (Graph 3, left-hand panel).
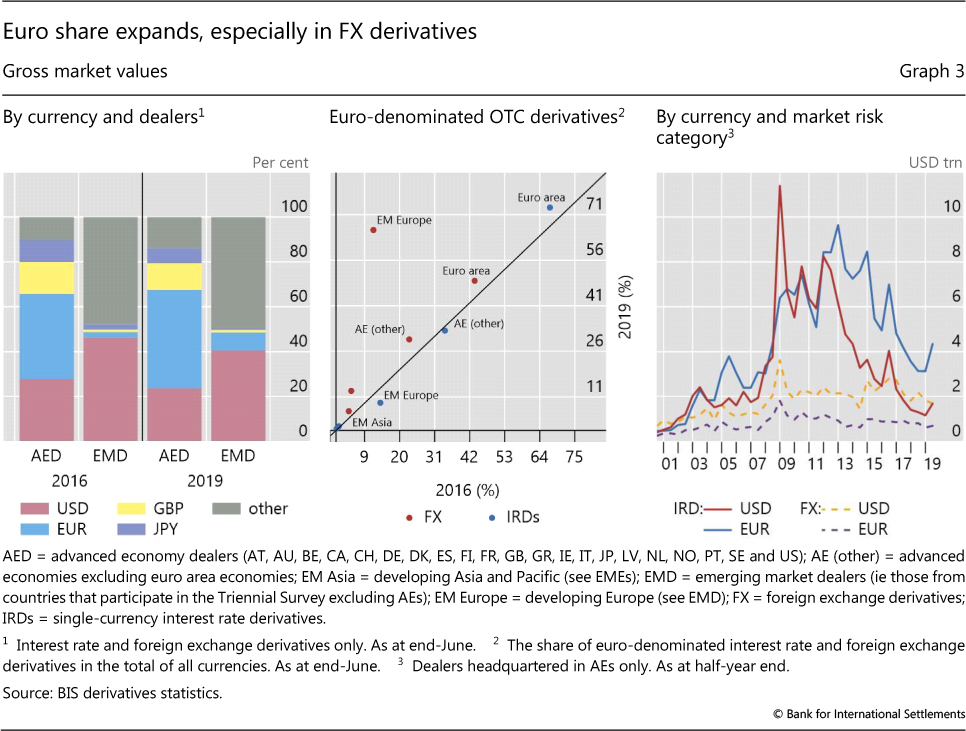
The euro's share of outstanding market value has increased appreciably over the past three years. Among dealers from AEs, the share of euro-denominated derivatives increased by 6 percentage points from 38% at end-June 2016. Over the same period, the share of euro-denominated derivatives in market value terms rose by 6 percentage points in EMEs, from 2% in 2016 to 8% in 2019. Dealers in emerging Europe drove the increase in euro exposure for EME dealers. While the share of euro-denominated OTC derivatives rose for euro area dealers and those in other AEs, it was considerably more pronounced for dealers in emerging Europe (Graph 3, centre panel).
A further breakdown of dealers' currency exposures by asset class shows that the US dollar dominated FX derivatives, while the euro surpassed other currencies in interest rate derivatives. In the latter case, euro and US dollar exposures were roughly similar until end-2011, when a gap opened rapidly, only stabilising after end-2014 (Graph 3, right-hand panel). The opening of this gap coincided with the ECB's introduction of longer-term refinancing operations to support bank lending and liquidity in the euro area money market.
In addition to hedging portfolio currency risk, FX swaps are used to cover US dollar financing needs, for both financial institutions (Baba and Packer (2009)) and non-financial corporates (Borio et al (2017)). In recent years, banks' use of FX swaps to manage funding liquidity has also increased (Schrimpf and Sushko (2019)).
Central clearing shaped patterns in derivatives outstanding
Rising central clearing rates, spurred by the post-crisis regulatory framework agreed at the 2009 G20 summit, have shaped the evolution of outstanding derivatives amounts since the GFC. This section reviews broad central clearing trends, highlights key channels through which central clearing can affect outstanding derivatives amounts and discusses central clearing rates in key market segments in the light of regulatory initiatives.
Clearing rates levelled off overall, rose for EME dealers
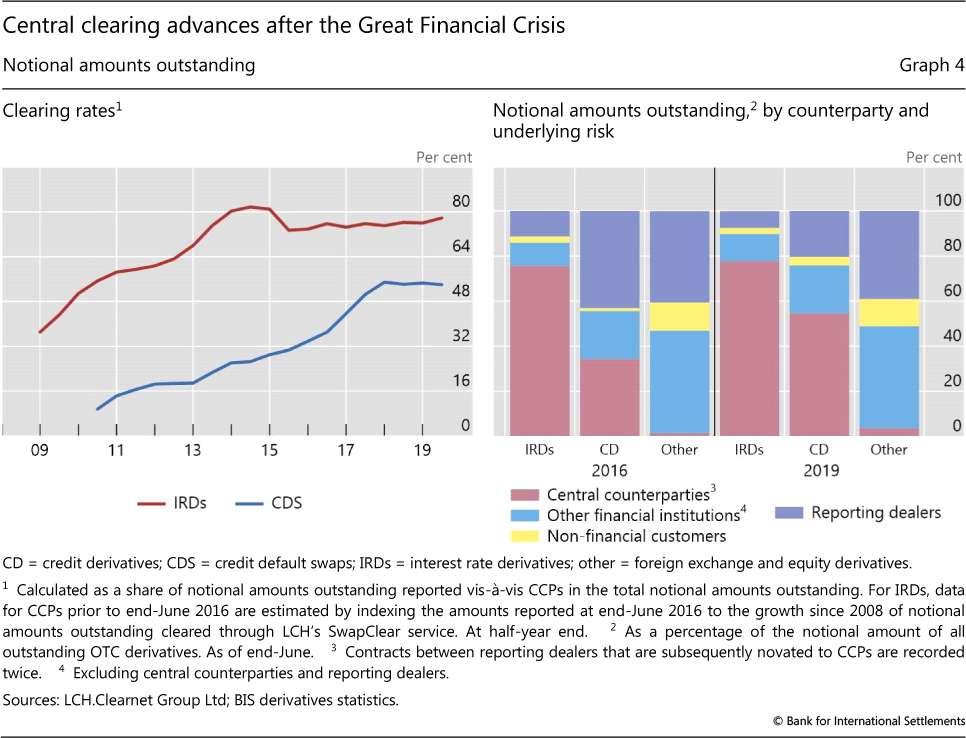
There were marked differences in central clearing rates across derivative types.6 For interest rate and credit derivatives, substantial increases in the early years after the GFC levelled off recently. In particular, clearing rates rose from 55% in 2010 to 75% in 2017 for interest rate derivatives. Over the same period, the increase for credit default swaps (CDS) was also remarkable, from 10% to 55%. However, clearing rates barely inched up between 2018 and 2019 (Graph 4, left-hand panel).
For FX derivatives, the share of notional amounts for which CCPs are dealer counterparties was just 4% at end-June 2019 (right-hand panel). Low clearing rates for FX derivatives probably reflected the fact that most of these derivatives are deliverable contracts, which are not particularly suited for central clearing because they involve the exchange of notional principal, thus requiring CCPs with large balance sheets and access to funding in multiple currencies.
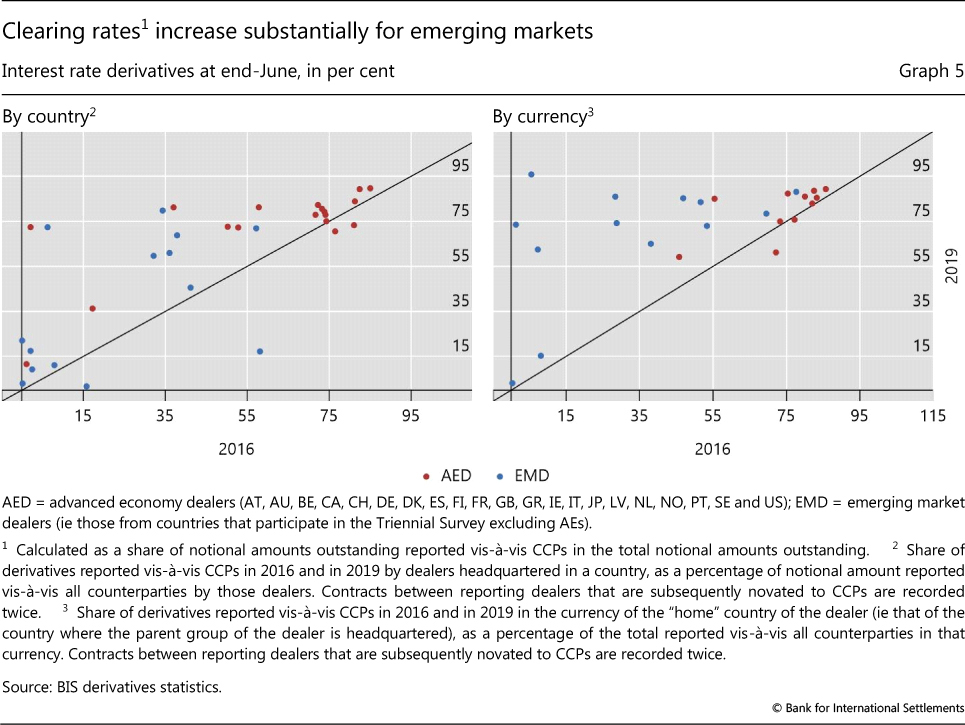
The clearing rates of EME dealers caught up with those of AE dealers over the past three years. AE dealers generally reported higher rates than those from EMEs and were approaching full clearing, while rates increased substantially for EME dealers (Graph 5, left-hand panel). AE currencies had higher clearing rates, while EME ones exhibited more substantial growth in central clearing (right-hand panel).
Rising clearing rates can reduce outstanding notional and gross market value in three main ways. First, offsetting positions can be netted across multiple parties. Second, CCPs have a complete view of the positions of their clearing members, facilitating trade compression.7 Since the clearing mandate took effect in 2012, the notional amount of compression trades increased substantially (Ehlers and Hardy (2019) in this issue). Third, central clearing allows settled-to-market (STM), in which traders take ownership of variation margins and the market value of the derivatives is reset to zero frequently. Some dealer banks indicated that gross derivatives market value in their public reporting dropped because of STM.8
Clearing rates for mandated versus non-mandated contracts
In the aftermath of the GFC, regulatory initiatives promoting central clearing were two-pronged. First, central clearing was mandated for a set of standardised contracts - including forward rate agreements (FRAs), interest rate swaps (IRS) and CDS indices. Second, uncleared contracts were to face higher capital and margin requirements, primarily to better reflect their risk profiles but also to promote central clearing.
Together, these regulatory requirements laid the foundation for the increase in central clearing rates among OTC derivatives.
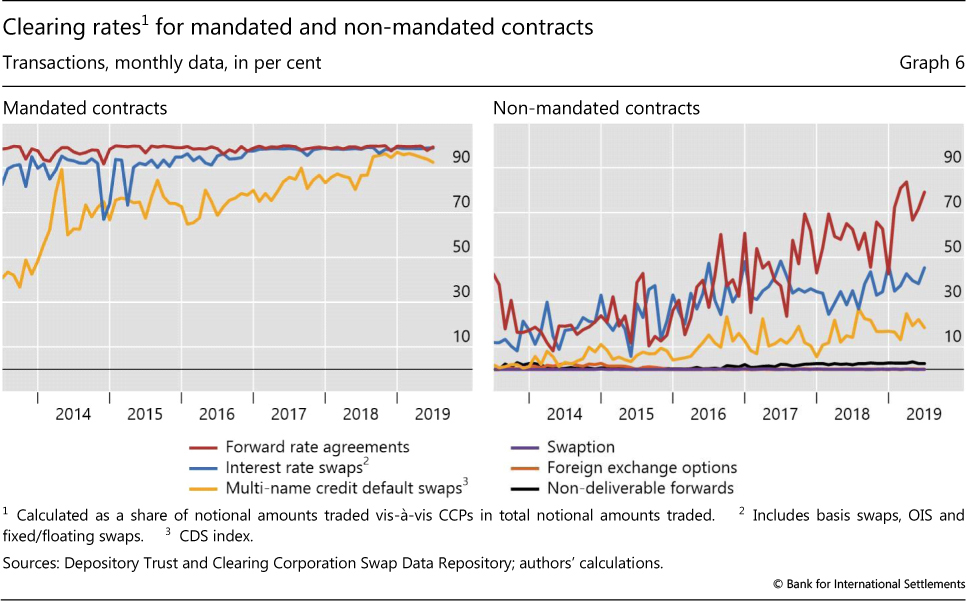
Central clearing rates for mandated contracts approached 100% in mid-2019.9 Based on transaction data, most mandated FRA and IRS contracts were already centrally cleared by end-2013, with clearing rates close to or above 90% (Graph 6, left-hand panel). The clearing rate for mandated CDS indices grew steadily from 48% at end-2013 to 92% at end-June 2019. As a result, virtually all mandated contracts were centrally cleared by mid-2019, limiting the scope for future increases.
Moreover, clearing rates for non-mandated FRAs, IRS and CDS indices increased substantially over the past six years. Clearing of non-mandated FRA contracts rose the most, from 17% at end-2013 to 79% in June 2019 (Graph 6, right-hand panel). The clearing rate for non-mandated IRS also went up, from 18% to 45%, and that for non-mandated CDS indices climbed from 1% to 19%.
The upward trend in clearing rates for non-mandated contracts can arguably be traced to the multilateral netting benefits of central clearing, together with the higher capital and margin requirements applicable to non-cleared contracts (Ghamami and Glasserman (2017)). The phasing-in of margin requirements on uncleared contracts (known as uncleared margin rules, UMR), which started in September 2016, provides an opportunity to examine the effects of margin requirements on central clearing rates.
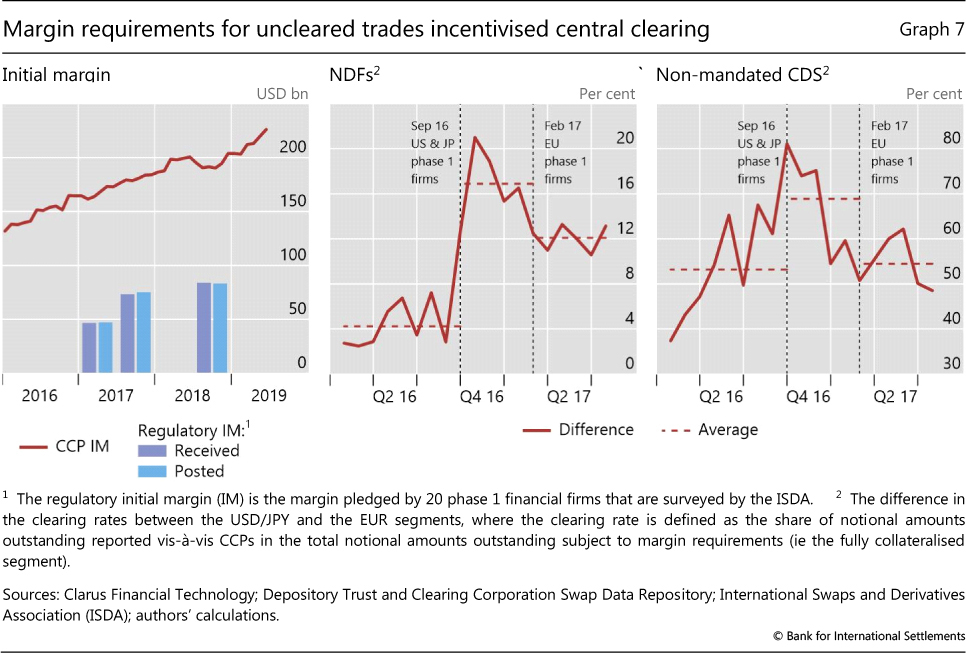
Margin requirements rose markedly after UMR were implemented. They were first applied to financial firms with month-end notional derivatives exposure greater than €3 trillion ("phase 1 firms"), followed by firms with smaller notional exposure.10 UMR led to significantly higher margin requirements, with phase 1 firms collecting $84 billion and posting $83 billion in initial margin at end-2018 for non-centrally cleared derivatives subject to UMR (Graph 7, left-hand panel). These figures were roughly 80% higher than in March 2017 and represented about 40% of total initial margins with CCPs for interest rate and credit derivatives.
We can gauge the impact of UMR on central clearing by linking the staggered implementation of UMR to the evolution of clearing rate differences between products subject to early or late UMR implementation. In particular, phase 1 firms in Japan and the United States were required to post margin from 1 September 2016, while those in the European Union had to do so only after 1 February 2017.
Our analysis suggests that UMR incentivised central clearing for non-deliverable forwards (NDFs) and non-mandated CDS.11 For both products, traders in the US dollar- and Japanese yen-denominated segments moved to central clearing in the run-up to 1 September 2016, while those in the euro-denominated segment migrated gradually between late 2016 and early 2017. As a result, the clearing rates of the dollar-/yen-denominated and euro-denominated segments diverged just before the first implementation deadline and converged again as the second deadline approached (Graph 7, centre and right-hand panels).
Although post-crisis regulatory reforms promoted central clearing, clearing rates for non-mandated contracts remained low for some products. The box discusses why central clearing became common for some products but not for others. Since moving from bilateral to central clearing can be costly, migration takes place only if there are substantial net benefits from central clearing. All else equal, migration is less likely for products with more modest netting benefits, such as those with shorter maturity. Likewise, higher liquidity in the bilateral segment can increase the costs of switching to central clearing.
Conclusion
In recent years, the composition of outstanding OTC derivatives has shifted. First, the Triennial Survey shows that balance sheet composition differed considerably across AE and EME dealers. In terms of market value outstanding, exposure was mostly to interest rate derivatives for AE dealers and to FX derivatives for EME dealers. As for currencies, exposure was mostly to the US dollar for EME dealers and more evenly split between the euro and the US dollar for AE dealers. With significant US dollar credit to EMEs (McCauley et al (2015)), FX derivatives referencing the US dollar could be used to hedge currency risk, but could also be a source of US dollar financing (Borio et al (2017)).
Second, the euro made inroads globally. In particular, its share of outstanding market value rose in interest rate derivatives for AE dealers and in FX for EME dealers. As has been the case since end-2011, the euro overshadowed other currencies in terms of market value for interest rate derivatives reported by AE dealers.
Last but not least, central clearing rates increased in EMEs but grew less quickly overall, as mandated contracts approached full clearing. As a natural result of the regulatory reforms spurred by the 2009 G20 summit, the prominent role of CCPs makes their resilience and appropriate recovery and resolution planning essential for financial stability (BCBS-CPMI-FSB-IOSCO (2017)).
Costs and benefits of switching to central clearing
Why did trading in some derivatives migrate to central clearing, while staying with bilateral clearing for others? Among derivatives not subject to mandatory clearing, the rate of voluntary clearing differed substantially. In particular, the clearing rate for non-deliverable forwards (NDFs) was much lower than that for non-mandated credit default swaps (CDS). Such divergence can be explained, in part, by structural differences across the two products.
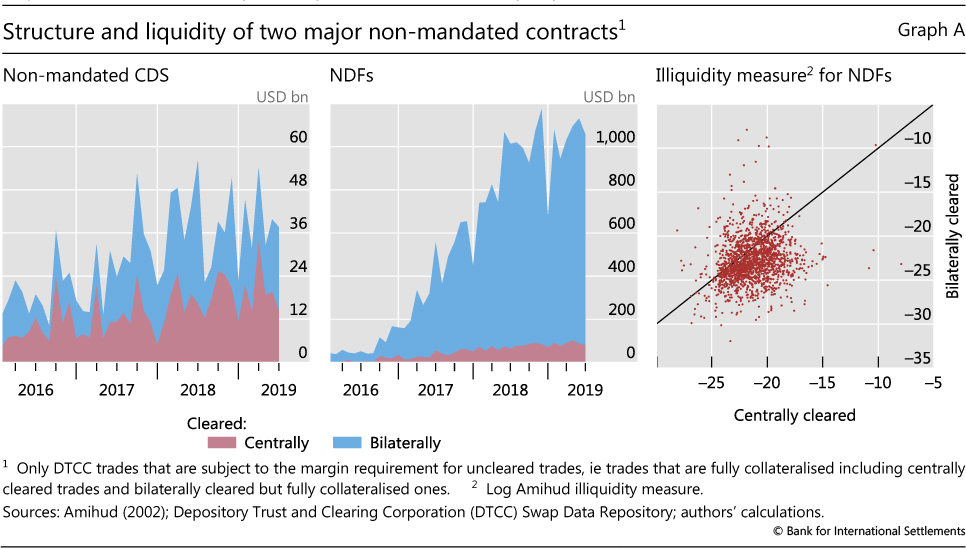
A substantial share of CDS trading has moved to central clearing over time, even in the absence of an official requirement. In June 2019, the monthly volume of centrally cleared CDS was, at $15 billion, comparable with the $23 billion of CDS that was cleared bilaterally each month (Graph A, left-hand panel). In comparison, the monthly volume of bilaterally cleared NDFs stood at $975 billion in June 2019, dwarfing that of centrally cleared NDFs (centre panel).
The decision to switch from bilateral to central clearing depends on a cost-benefit analysis that takes account of several elements. Among the potential benefits, lower capital or margin requirements certainly play a role, but so does the comparative ease of trade, or trading liquidity, in the bilaterally cleared and centrally cleared venues. These benefits vary across products, meaning that migration to central clearing might be cost-effective for some but not for others.
First, gains from margin netting in central clearing are higher if similar products are subject to clearing mandates. The reason is that CCPs generally allow for netting within the same asset class and initial margin is calculated at the portfolio level. Unlike NDFs, standardised CDS contracts are subject to the central clearing mandate, and non-mandated CDS can benefit from margin netting under central clearing.
Second, CDS generally have longer maturities than NDFs. Maturity is a key determinant of margin requirements for uncleared products. It is often less than one year for NDFs and typically five years for CDS. All else equal, the longer the maturity, the higher the margin requirement. Given the multilateral netting benefits of central clearing, the potential for margin reduction is greater for CDS than for NDFs.
Third, significantly lower liquidity in centrally cleared markets can reduce the incentive to switch away from bilaterally cleared venues. Coordination among traders plays an important role in this instance, because liquidity in centrally cleared markets could improve rapidly if enough traders opted out of bilateral clearing at the same time. Such coordination can be difficult to achieve when other advantages from switching, such as gains from netting, are small. For NDFs, the relatively small margin netting benefits provided little incentive for enough traders to migrate, and liquidity remained concentrated in bilaterally cleared markets, further discouraging migration to centrally cleared venues (Graph A, right-hand panel).
For a discussion of the effect of counterparty credit risk on traders' decisions to clear through CCPs rather than bilaterally, see P Fiedor, "Clearinghouse-Five: determinants of voluntary clearing in European derivatives markets", European Systemic Risk Board, ESRB Working Paper Series, no 72, March 2018; M Bellia, R Panzica, L Pelizzon and T Peltonen, "The demand for central clearing: to clear or not to clear, that is the question", European Systemic Risk Board, ESRB Working Paper Series, no 62, December 2017.
References
Amihud, Y (2002): "Illiquidity and stock returns: cross-section and time-series effects", Journal of Financial Markets, vol 5, no 1, pp 31-56.
Baba, N and F Packer (2009): "Interpreting deviations from covered interest parity during the financial market turmoil of 2007-08", Journal of Banking & Finance, vol 33, no 11, pp 1953-62.
Bank for International Settlements (2019): "OTC derivatives statistics at end-June 2019", Statistical release, pp 1-8.
Basel Committee on Banking Supervision, Committee on Payments and Market Infrastructures, Financial Stability Board and International Organization of Securities Commissions (2017): Chairs' report on the implementation of the joint workplan for strengthening the resilience, recovery and resolvability of central counterparties, July.
--- (2018): Incentives to centrally clear over-the-counter (OTC) derivatives: a post-implementation evaluation of the effects of the G20 financial regulatory reforms - final report, November.
Borio, C, R McCauley and P McGuire (2017): "FX swaps and forwards: missing global debt?", BIS Quarterly Review, September, pp 37-54.
Ehlers, T and B Hardy (2019): "The evolution of OTC interest rate derivatives markets", BIS Quarterly Review, December, pp 69-82.
Financial Stability Board (2018): OTC derivatives markets reforms: thirteenth progress report on implementation, August.
Ghamami, S and P Glasserman (2017): "Does OTC derivatives reform incentivize central clearing?", Journal of Financial Intermediation, vol 32, pp 76-87.
Goldman Sachs (2016): Annual Report, pp 131-2.
McCauley, R, P McGuire and V Sushko (2015): "Dollar credit to emerging market economies", BIS Quarterly Review, December, pp 27-41.
Patel, N and D Xia (2019): "Offshore markets drive trading of emerging market currencies", BIS Quarterly Review, December, pp 53-67.
Schrimpf, A and V Sushko (2019): "Sizing up global foreign exchange markets", BIS Quarterly Review, December, pp 21-38.
Upper, C and M Valli (2016): "Emerging derivatives markets?", BIS Quarterly Review, December, pp 67-80.
Wells Fargo (2017): Annual Report, p 154.
Wooldridge, P (2016): "Central clearing predominates in OTC interest rate derivatives markets", BIS Quarterly Review, December, pp 22-4.
Wooldridge, P and D Xia (2019): "Derivatives trading in OTC markets soars", BIS Quarterly Review, September, pp 32-3.
1 The views expressed in this article are those of the authors and do not necessarily reflect those of the Bank for International Settlements. We thank Kristina Micic for valuable assistance with the data.
2 Since 1998, the BIS has collected two sets of statistics on outstanding positions in OTC derivatives markets: semiannual data from large derivatives dealers in 12 jurisdictions, and triennial data from smaller dealers in more than 30 jurisdictions. Both sets of data cover the worldwide consolidated positions of reporting dealers. According to the latest Triennial Survey, which captured positions at end-June 2019, smaller dealers accounted for about 8% of notional amounts outstanding (BIS (2019)). Between Triennial Surveys, the BIS uses the triennial data to scale up the semiannual data, thereby providing a more accurate estimate of the global size of OTC derivatives markets.
3 The report of the Derivatives Assessment Team of the Financial Stability Board (FSB) recently found that regulations provided impetus for central clearing (BCBS-CPMI-FSB-IOSCO (2018)).
4 In the BIS OTC derivatives statistics, gross credit exposure takes into account legally enforceable bilateral netting agreements but not collateral. Gross credit exposure is reported only by dealers who participate in the semiannual survey.
5 In the following discussion, exposures are defined in terms of gross market value. For comparisons of AE and EME derivatives markets in terms of size, instrument type and currencies, see eg Patel and Xia (2019), Upper and Valli (2016) and Wooldridge and Xia (2019).
6 The proportion of outstanding positions against CCPs is typically larger than the proportion of trades cleared through CCPs because the former counts trades between dealers twice. In the BIS OTC derivatives statistics, whereas inter-dealer positions are adjusted to eliminate double-counting, inter-dealer trades that are subsequently novated to a CCP are not adjusted. For further discussion, see Wooldridge (2016).
7 Compression is a process whereby two or more counterparties tear up existing derivatives contracts and replace them with a smaller number of new ones that leave the economic exposures materially unchanged. The elimination of economically redundant derivatives positions reduces the number of contracts and gross notional amounts.
8 See eg the annual reports of Goldman Sachs (2016) and Wells Fargo (2017).
9 Transactions of small clients are exempted from the clearing mandates.
10 Physically delivered FX derivatives and small entities are exempted.
11 We focus on NDFs and non-mandated CDS because they are representative of relatively simple products that can potentially be centrally cleared.