OTC derivatives statistics at end-June 2019
- Notional amounts of OTC derivatives rose to $640 trillion at end-June 2019. This is up from $544 trillion at end-2018 and the highest level since 2014. It marks a continuation of the trend increase evident since end-2016.
- The gross market value of OTC derivatives, summing positive and negative values, also rose, from $9.7 trillion to $12.1 trillion, led by increases in euro interest rate derivative contracts.
- The latest semiannual data benefit from the addition of more comprehensive information for smaller dealers collected as part of the BIS Triennial Survey.1 Dealers in emerging market economies (EMEs) accounted for 9% of the outstanding notional amounts of foreign exchange and commodity derivatives globally at end-June 2019, up from 7% at end-June 2016.
Outstanding notional amounts of OTC derivatives trend upwards
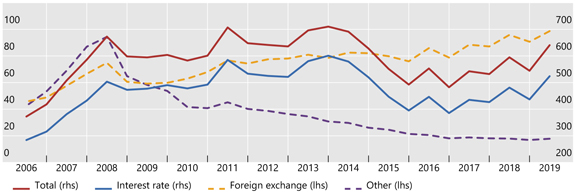
Graph 1: Outstanding notional amounts of OTC derivatives, USD trillions (interactive graph).
Source: BIS OTC derivatives statistics (Table D5.1).
Notional amounts - which determine contractual payments - rose significantly in the first half of this year, to $640 trillion at end-June 2019 (Graph 1, red line). Part of this increase reflects a seasonal pattern evident in the data since 2016. Specifically, notional amounts outstanding have tended to decrease in the second half of a year, followed by a rebound in the first, generating the sawtooth pattern seen in Graph 1. Factoring out that pattern, notional amounts have grown year on year by around 7% on average since end-2017,2 and have now reached their highest level since 2014.
Interest rate derivatives accounted for the bulk of OTC notional amounts outstanding at end-June 2019 ($524 trillion or 82%), and have driven the upward trend evident since 2016 (Graph 1, blue line). This upward trend contrasts with the significant contraction observed in 2014 and 2015.
Notional amounts outstanding for foreign exchange derivatives, which had not experienced a similar downward correction in the early 2010s, have also been trending upwards in recent years (Graph 1, yellow dashed line); their notional amounts totalled $99 trillion at end-June 2019.
In contrast, notional amounts of other derivatives3 have followed a trend decline since the financial crisis of 2007-09 (Graph 1, purple dashed line). This trend was driven almost entirely by credit derivatives, of which 93% were credit default swaps at end-June 2019.
Notional rise driven by USD interest rate derivatives
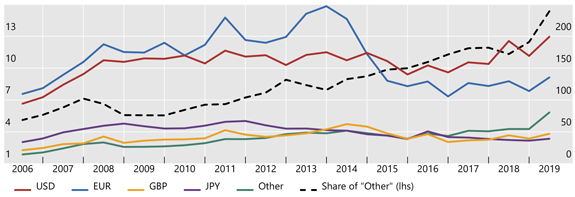
Graph 2: Outstanding notional amounts of OTC interest rate derivatives, USD trillions (interactive graph). "Other" refers to contracts denominated in currencies other than USD, EUR, JPY, GBP, CHF, CAD and SEK.
Source: BIS OTC derivatives statistics (Table D7).
Notional amounts of US dollar-denominated interest rate contracts rose in the first half of 2019, continuing the trend expansion observed since 2016 (Graph 2, red line). They have become the largest currency segment in the past few years, rising from $169 trillion at end-2018 to $199 trillion at end-June 2019, a new peak.
Euro-denominated interest rate contracts also rose in the first half of 2019, from $114 trillion to $135 trillion (Graph 2, blue line). They appear to have broadly stabilised since 2015, at levels well below (by some 50%) the record amounts observed in 2010-14. These contracts drove the large decline in 2014-15. Notional amounts in the yen and sterling have remained at low levels, ie $47 trillion for the former (yellow line) and $39 trillion for the latter (purple line).
Interest rate contracts denominated in currencies other than the seven required reporting currencies (USD, EUR, GBP, JPY, CHF, CAD and SEK) have been increasing in recent years (Graph 2, green line).4 Contracts in the other currencies amounted to $47 trillion at end-June 2016, but rose to $80 trillion at end-June 2019, with their share in total interest rate contracts going up from 11% to 15% (dashed line).
The overall increase in notional amounts was common across both short- and long-maturity contracts. Contracts of up to and including one year, accounting for 48% of outstanding notional amounts, rose from $201 trillion at end-2018 to $253 trillion at end-June 2019. Contracts of longer than one year increased from $236 to $271 trillion.
Trend decline in gross market values halts
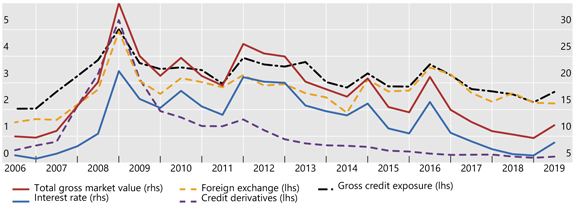
Graph 3: Outstanding gross market values of OTC derivatives, by instrument; and outstanding gross credit exposures, USD trillions (interactive graph).
Source: BIS OTC derivatives statistics (Table D5.1).
The trend decline in the gross market value of derivative contracts - which provides a measure of amounts at risk - appears to have come to a halt in the first half of 2019 (Graph 3, red line). It increased slightly, from $9.7 trillion at end-2018 to $12.1 trillion at end-June 2019. This was driven entirely by interest rate contracts (blue line), in particular euro-denominated contracts (which rose from $3.1 trillion to $4.4 trillion). US dollar-denominated interest rate contracts also rose, from $1.2 trillion to $1.7 trillion. The gross market value of both foreign exchange and credit derivatives remained relatively stable, standing at $2.2 trillion and $0.2 trillion, respectively, at end-June 2019 (yellow and purple dashed lines).
Gross credit exposures (Graph 3, black dashed line), which adjust gross market values for legally enforceable bilateral netting agreements (but not for collateral), also rose for the first time since end-June 2016 (from $2.3 trillion at end-2018 to $2.7 trillion at end-June 2019). Despite that slight increase, gross credit exposures declined as a share of gross market value over the same period, from 24% to 22% (Graph A1, right-hand panel).
Larger role for EME dealers in foreign exchange and commodities
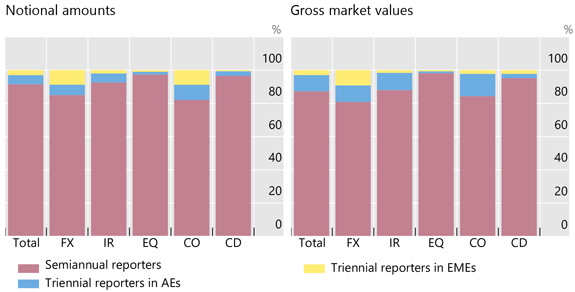
Graph 4: OTC derivatives, by measure and instrument, percent of total, end-June 2019. CD = credit derivatives; CO = commodity derivatives; EQ = equity-linked derivatives; FX = foreign exchange derivatives; IR = single currency interest rate derivatives.
Source: BIS OTC derivatives statistics; BIS calculations.
The derivatives statistics published by the BIS on a semiannual basis capture the outstanding derivatives positions of 70 large banks and other dealers in 12 jurisdictions. This information is complemented every three years by the more comprehensive BIS Triennial Survey, which covers more than 30 additional jurisdictions and over 300 additional dealers.5 This latest Triennial Survey was completed this year, and the data captured by it are used to scale up the semiannual data to more accurately reflect the global size and composition of OTC derivatives markets.
Large dealers in advanced economies (AEs), who report data to the semiannual survey, accounted for the overwhelming majority (92% of notional amounts, 87% of gross market value) of outstanding positions at end-June 2019 (Graph 4). Nevertheless, the contribution of the smaller dealers who report data only once every three years was significant in some segments. Dealers in EMEs accounted for 9% of notional amounts of outstanding foreign exchange and commodity derivatives, up from 7% at end-June 2016. This reflects the importance of exchange rate risk and commodity price movements for EMEs.
1 The latest Triennial Survey captures data from smaller dealers in emerging market economies and elsewhere, with those data being used to scale up the semiannual data to more accurately reflect the global OTC derivatives market.
2 End-December data show the same trend, going from $482 trillion at end-2016 to $532 trillion at end-2017 to $544 trillion at end-2018.
3 Other derivatives comprise credit, equity and commodity contracts as well as other minor instruments.
4 These other currencies feature more prominently in the more comprehensive data collected every three years as part of the BIS Triennial Survey. Data collected in the Triennial Survey are used to scale up volumes collected in the semiannual surveys.
5 These additional dealers include smaller dealers located in the 12 jurisdictions that report data on a semiannual basis.