Emerging derivatives markets?
Only 10% of global derivatives turnover is in contracts denominated in the currency of an emerging market economy (EME), much lower than the share of these economies in global GDP or world trade. Derivatives in EME currencies also tend to be less complex and more likely to be traded outside the home economy than those in advanced economy currencies. Differences persist even if we control for key drivers of derivatives turnover such as the size of the bond market, the openness of the capital account, the amount of foreign trade and the size of external liabilities. Instead, the small size of EME derivatives markets appears to reflect differences in per capita income. Large external asset holdings by residents of a country go hand in hand with lower turnover, perhaps because they are used as a hedge against country risk.1
JEL classification: F31, G12, G23.
The economies and financial markets of emerging market economies (EMEs) tend (with some exceptions) to be more volatile than those of advanced economies. This is true whether one looks at output growth, exchange rates, interest rates or capital flows. Given this volatility, one would expect hedging markets in EMEs to be well developed. But this does not seem to be the case. EMEs make up about one third of the global economy when measured at market exchange rates and just under one half when measured at purchasing power parity. Their share in global trade is 36%. Still, derivatives referencing their currencies or interest rates account for only 10% of the global turnover of such contracts, despite notable growth in some cases in recent years.
But the desire to hedge need not result in liquid markets unless there is somebody willing to take the other side. For idiosyncratic risks that are easily diversifiable, a financial intermediary could sell the appropriate insurance. But creating a market for macroeconomic risks, such as exchange rate and interest rate risk, is much more difficult unless there are agents who are exposed to such risk in opposite ways.
Consider the example of an EME with a volatile exchange rate. Residents and foreign investors alike will probably be interested in protecting themselves against a depreciation in the exchange rate, but it is less obvious who would be willing to take the other side. Of course, foreign financial institutions with no particular interest in gaining exposure to the currency could offer such protection, but they would probably charge a very high price. More attractive terms could be obtained from market participants wanting to protect themselves against an appreciation - for instance, domestic holders of foreign assets or foreigners issuing domestic currency debt.
This article uses the latest vintage of the BIS Triennial Central Bank Survey to examine how derivatives trading on EME exchange rates and interest rates has evolved and why it remains lower than for advanced economies. Our focus is on the ability to trade EME risks rather than on trading derivatives locally, so we focus on derivatives on EME currencies and interest rates (including those traded offshore) and not just on contracts traded domestically in EMEs. Given the focus of the Triennial Survey, we limit ourselves to exchange rate and interest rate contracts and do not discuss other risk categories such as equities and commodities, despite their importance for both EME residents and foreign investors.
The article is divided into two parts. In the first part, we compare derivatives markets in EMEs with those in the advanced economies using data from the Triennial Survey. In the second part, we look at the factors that explain cross-country differences in the development of these markets.
Derivatives markets in emerging and advanced economies
The sharp movements in exchange rates during the past few years masked a solid increase in activity in EME derivatives. Average daily turnover in FX and interest rate derivatives denominated in EME currencies stood at $0.8 trillion in April 2016, almost the same as in April 2013, on the cusp of the bout of sharp market moves that started a month later (the so-called taper tantrum).2 But this apparent stagnation paints a misleading picture of the underlying dynamics of the market, as the sharp depreciation of many EME exchange rates between the last two Triennial Surveys depressed volumes measured in US dollars. Measured in local currencies, turnover actually expanded by 25%, albeit with large differences across currencies (Graph 1).
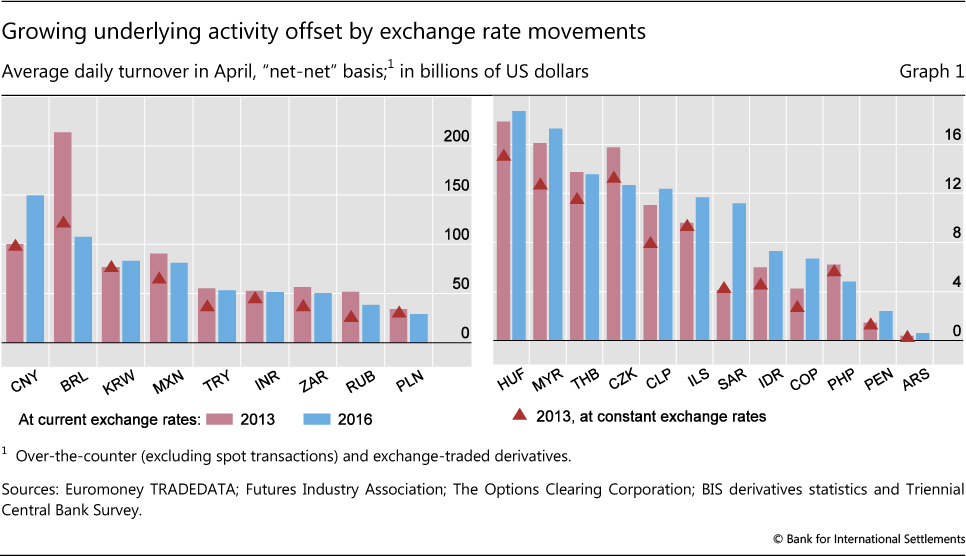
The size and depth of derivatives markets vary considerably across currencies. The largest and most rapidly growing market is the one for contracts on the Chinese exchange rate and Chinese interest rates. Its activity grew by 50% between the 2013 and 2016 surveys (55% when measured in local currency) to reach $150 billion a day in April 2016. This makes the Chinese renminbi the eighth most traded currency in the global derivatives market in 2016, overtaking the Brazilian real ($108 billion), Korean won ($83 billion) and Mexican peso ($81 billion). The rapid growth of the renminbi market is part of a broader internationalisation of the currency (see "The rise and financialisation of the renminbi" in Moore et al (2016), and Box A). Other EME currencies with significant market activity are the Turkish lira, the Indian rupee and the South African rand with just over $50 billion turnover a day each.
Large as they may seem, these numbers are relatively modest when set against GDP or proxies for hedging needs, as measured by international trade or investment. On all those measures, even EMEs with relatively developed and deep derivatives markets sustain lower turnover than most advanced economies. Median EME derivatives turnover is roughly 5% of annual GDP, well below the median for advanced economies, which is close to 20%. Even advanced economies that are neither financial centres nor issuers of a reserve currency, such as Australia, Canada, New Zealand, Norway and Sweden, have much higher turnover-to-GDP ratios than any EME (Graph 2, top panel). The only EME currencies coming close to the advanced economy median are the South African rand and the Hungarian forint, with ratios of 15-20%. The picture does not change much when derivatives turnover (FX contracts only, as interest rate contracts are unlikely to be used in this context) is set against foreign trade (Graph 2, middle panel). On both measures, CNY contracts rank close to the bottom of the distribution. When derivatives volumes are compared with cross-border investment positions, the differences between advanced and emerging economies are less stark (Graph 2, bottom panel).
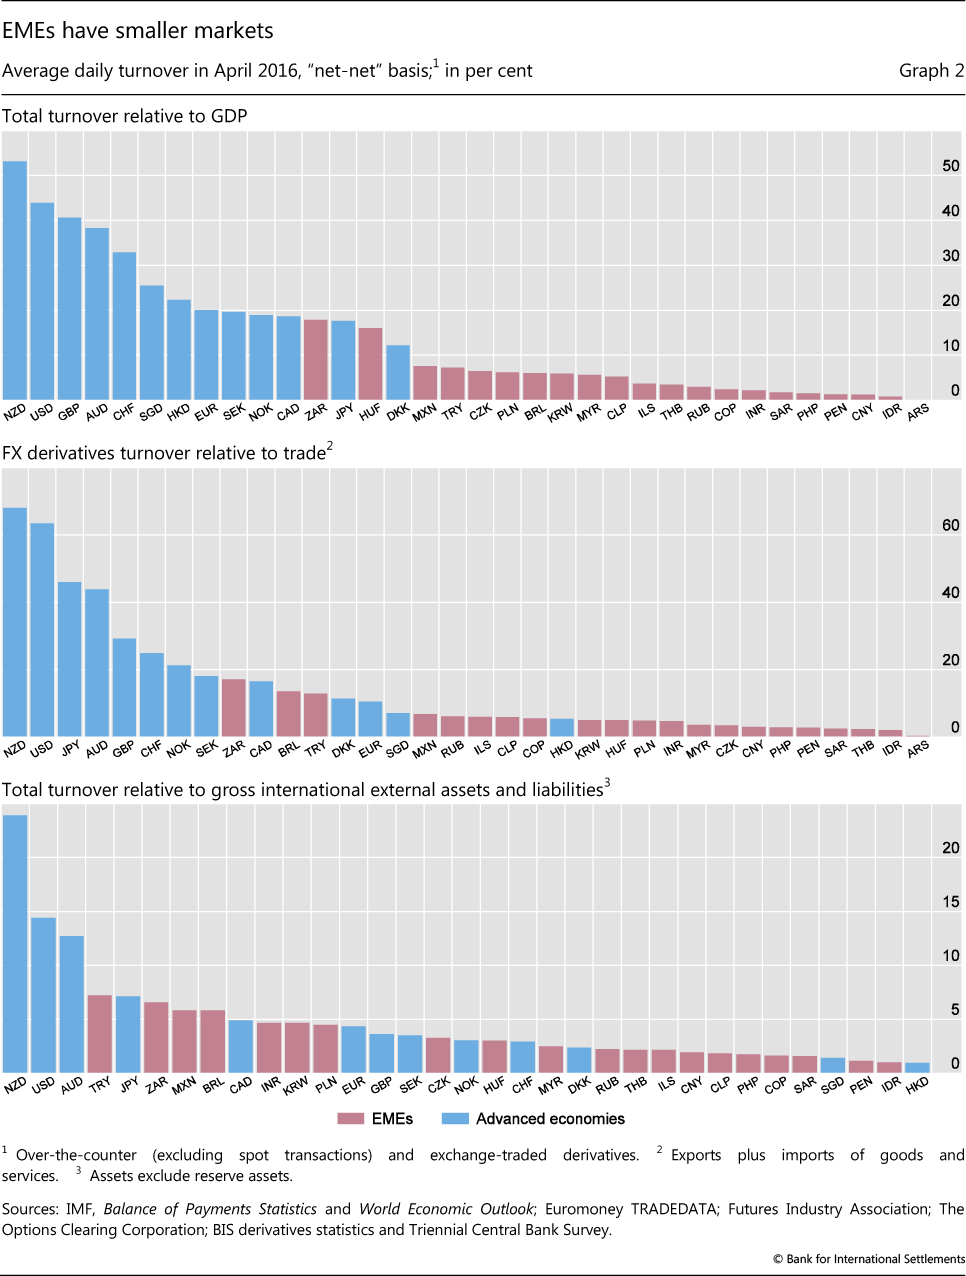
The low ratios of FX derivatives turnover to foreign trade in EMEs could indicate that exporters and importers in these countries still find it relatively difficult to hedge the exchange rate risk associated with their transactions, although one cannot say this for sure in the absence of detailed data on their use of derivatives.
Derivatives trading in EMEs is heavily geared towards FX contracts, which account for 75-90% of turnover in most cases (Graph 3, first panel). FX contracts also outweigh interest rate contracts in advanced economies, though by a smaller margin. Currencies with relatively low FX shares are the Brazilian real (with a share of 56%), Hungarian forint (59%), Chilean peso (66%), South African rand (67%) and Mexican peso (68%).
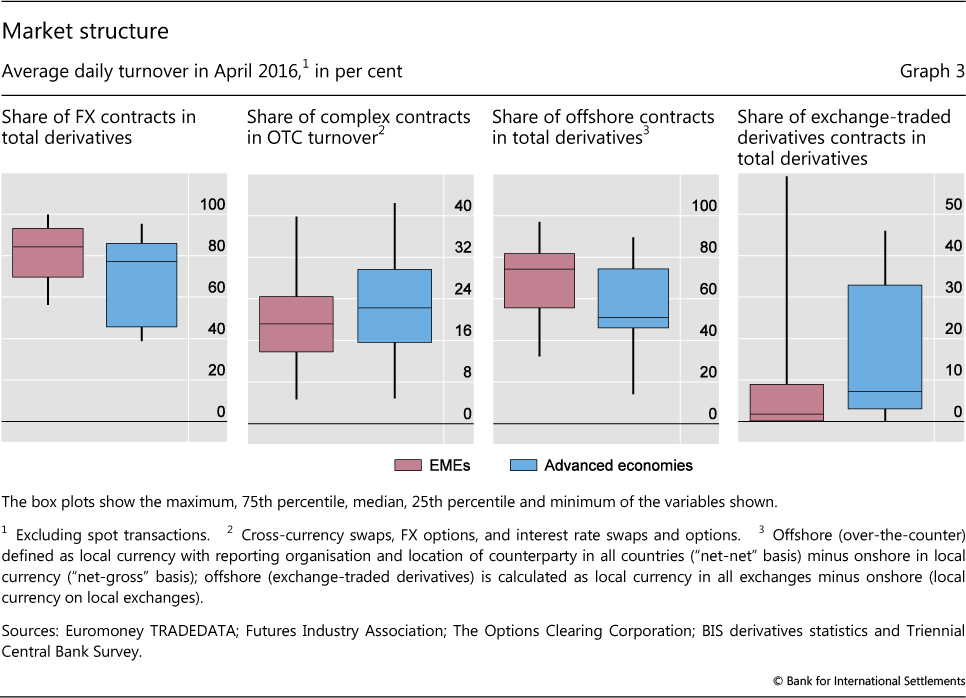
EME derivatives markets are not only smaller than their advanced economy counterparts, they also feature less complex contracts. At least this is the message from the relatively coarse instrument breakdown of the Triennial Survey. More sophisticated contracts, such as cross-currency swaps, FX options, interest rate swaps and interest rate options, account for a lower share in total turnover in emerging than in advanced economy derivatives markets (Graph 3, second panel). But there are signs that such contracts are becoming more common in some EMEs. For example, Mexico and South Africa have comparatively liquid cross-currency swap markets. In the interest rate segment, many economies have developed active over-the-counter (OTC) markets for options.
Another feature that sets some, albeit not all, EME derivatives markets apart is the prevalence of non-deliverable contracts. Three quarters of Brazilian real FX forwards and swaps and two thirds of Korean won contracts are non-deliverable in the sense that they are settled in a single currency. The other markets with a significant share of non-deliverable contracts are the New Taiwan dollar (56%) and the Indian rupee (47%). The prevalence of non-deliverable contracts reflects the presence of restrictions on currency convertibility, which hinder the development of contracts settled in two currencies. That said, non-deliverable markets may continue to exist well after controls have been lifted. Developments in the non-deliverable FX market are discussed in McCauley and Shu (2016); for background on the Brazilian market, see Box B.
With some notable exceptions, EME FX and interest rate derivatives are mostly traded outside the home economy, usually in a major global financial centre such as New York, London, Hong Kong and Singapore (Graph 3, third panel). Very few EMEs have onshore markets that come close, in terms of activity, to the offshore market. Only in the Brazilian real, Russian rouble and Korean won does onshore OTC turnover exceed offshore turnover, although the Indian rupee, Israeli new shekel and South African rand come close. Offshore trading tends to take place in the same time zone. For instance, Latin American currencies tend to be traded in New York, central and eastern European currencies in London, and Asian currencies in Hong Kong and Singapore. Box A compares on- and offshore renminbi markets.
Box A
The changing landscape of renminbi offshore and onshore markets
Encouraging the growing international use of the renminbi (RMB) has been a long-standing element of China's FX liberalisation strategy. As part of this strategy, many new instruments are permitted first to develop in the offshore RMB market. RMB offshore trading in non-deliverable forwards (NDFs) first emerged in Hong Kong SAR in 1996 and then in Singapore, where the offshore RMB business was subsequently mostly concentrated. The 2016 Triennial Central Bank Survey revealed that the already exceptionally large offshore share of over-the-counter (OTC) derivatives turnover in RMB had risen to 73%. That said, there have been significant changes in the composition of offshore trading by instrument and nationality that have reflected policy shifts and the dynamic nature of the RMB's internationalisation. There has been convergence between on- and offshore trading patterns in some, but not all, respects. And there have also been very significant developments since 2013 in the offshore trading of exchange-traded derivatives.
Cross-border RMB demand has increased through a number of channels. First, starting in July 2009, China allowed the use of the RMB in the settlement of its cross-border trade, which in terms of both imports and exports grew rapidly to CNY 7.23 trillion (ie to nearly 30% of trade) in 2015 before falling somewhat in 2016. Second, both outward and inward direct investment have grown rapidly, with RMB outward direct investment reaching CNY 736.2 billion in 2015. Third, offshore RMB can also serve as a vehicle for portfolio investment in China. Channels for such investment include dim sum bond issuance (offshore RMB-denominated bond issuance) and the RMB Qualified Foreign Institutional Investor (RQFII) scheme, which allows the RMB funds raised in Hong Kong by the subsidiaries of domestic fund management companies and securities companies to be invested in the mainland securities market. The RQFII scheme had 169 participants and an approved quota of CNY 511.34 billion by the end of September 2016.
Looking at the location of offshore activity, the RMB is still traded mostly within the Asian region, but also spans a wider international dimension than before. The share of turnover in Hong Kong declined from 43% to 39% of total RMB offshore trading, although it is still much larger than in 2013 in absolute terms. At the same time, trading in Singapore and other Asian economies has increased, so that the share of total offshore trading taking place in Asia summed to 65% (Graph A1, left-hand pie). Offshore RMB trading outside Asia has also grown; while trading in the United Kingdom edged down from 21% to 20%, the share of RMB offshore turnover occurring in the United States rose from 7% to 12% in 2016.
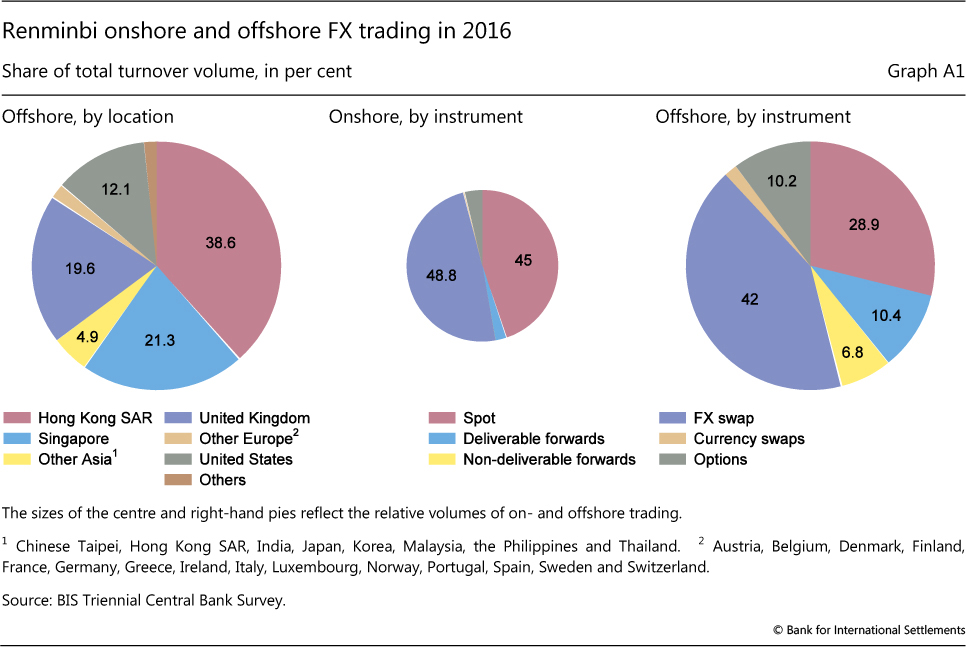
In terms of instruments used in RMB trading, there has been some convergence between the off- and onshore markets since the preceding Triennial Survey in 2013 (Graph A1, centre and right-hand pies). This is particularly noticeable in the case of spot trading, which fell as a share of the onshore market from 60% to 45%, while it rose from 16% to 29% in the offshore market. At the same time, NDFs, which had accounted for nearly one fifth of all offshore trading in 2013, constituted only 7% of activity in 2016, a development examined by McCauley and Shu (2016). Offshore option trading also declined significantly. The one significant exception to the trend of convergence was deliverable forward transactions, which showed slightly larger shares of overseas trades (11% vs 10%) but collapsed in the onshore market (from 8% to 2%). Diminished turnover in onshore forwards may have been related to reserve requirements on forward transactions, which were instituted in August 2015 to discourage speculation in the RMB after a period of exceptional volatility.
The rapid growth of the offshore market for the RMB and related derivatives is not limited to OTC FX market transactions covered by the Triennial Survey. Futures turnover grew strongly on the exchanges of Singapore and Chinese Taipei, in addition to Hong Kong (Graph A2, left-hand panel). RMB futures products, first offered more than 10 years ago on the Chicago Mercantile Exchange, were launched on the Hong Kong Exchange in September 2012, and in Singapore and Chinese Taipei in October 2014 and July 2015, respectively (as well as in Brazil in August 2011, South Africa in May 2013 and Korea in October 2015). The growth in these instruments, while still relatively small, has paralleled the growth of RMB deposits outside China, another component of China's capital account liberalisation (Graph A2, centre panel).
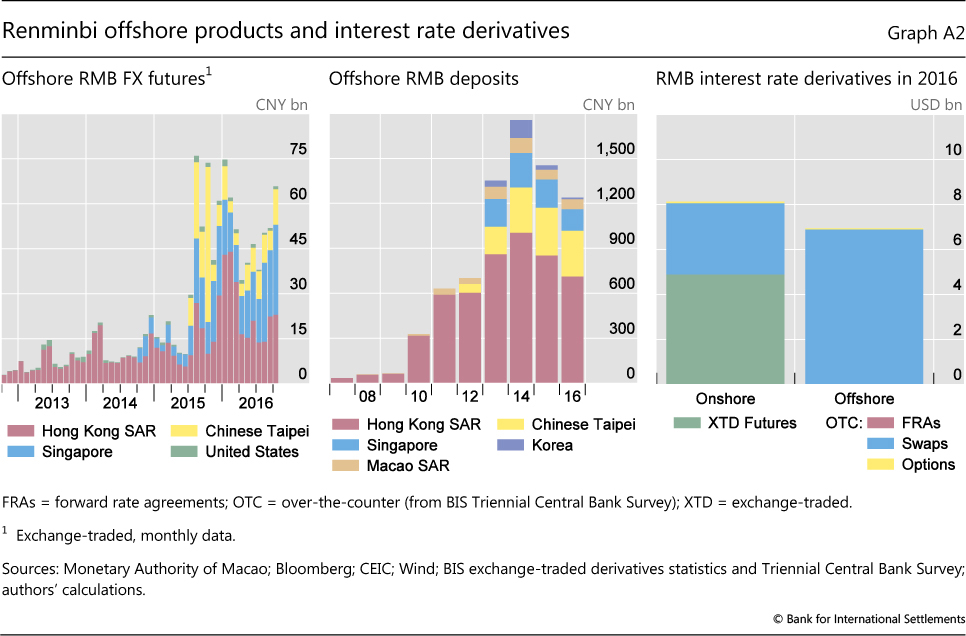
Both on- and offshore, RMB interest rate derivatives markets remain less developed than their FX counterparts. Average daily turnover in OTC and exchange-traded markets increased slightly, by $0.6 billion to $15 billion, between 2013 and 2016. The increase was entirely driven by onshore futures contracts, whereas turnover in OTC markets - mainly swaps - declined by $4 billion to $10 billion (Graph A2, right-hand panel). In comparison with the markets in advanced economies, the depth of the interest rate derivatives market remains very limited (Ehlers and Eren (2016)). While net bond issuance by Chinese residents has been similar to that by US residents in recent years, total RMB interest rate derivatives turnover in April 2016 was less than 1/300 of turnover in US dollar contracts. This suggests that the issuers and holders of RMB bonds, mainly Chinese residents, may not be actively hedging the underlying interest rate risks. In contrast to the key role of offshore markets in the rapid expansion of RMB FX markets, opportunities to hedge RMB interest rate risk may depend on developments in onshore markets - not least because most RMB bonds are held by domestic investors.
Finally, EME derivatives are disproportionately traded over the counter (Graph 3, fourth panel). OTC trading exceeds exchange-based trading by a factor of three, with Brazil being the only major market in which derivatives exchanges account for a large fraction of turnover (Box B). Many other EMEs have active futures exchanges, but these tend to concentrate on stock index and commodity contracts rather than FX and interest rate instruments. For example, only 2.5 million of the close to 1 billion contracts traded on Chinese derivatives exchanges in the first quarter of 2016 referenced interest rates. According to Euromoney TRADEDATA, there are no listed contracts on exchange rates in China. And even in Brazil, equity contracts account for 50% of total turnover (measured by the number of contracts); interest rate contracts follow with 28% of turnover and FX contracts with 11%.
Why is EME derivatives turnover so low?
What explains the comparatively low level of activity in EME currency derivatives? In the introduction, we argued that the development of a liquid derivatives market - of any market, in fact - requires the existence of regular two-way flows. So, what explains the existence of such flows, and thus the size of the market? In this section, we aim to address these questions by estimating the determinants of activity in derivatives markets across a wide range of economies - emerging and advanced - on proxies for the hedging needs of different investor types. Our sample comprises 34 economies (24 emerging and 10 advanced economies)3 and the data from the Triennial Survey responses in April 2013 and April 2016. Unfortunately, the incomplete currency breakdown in earlier surveys precludes us from going back further.
The first, and most obvious, hedging motive derives from international trade, which we proxy by summing the exports and imports of the home economy.
The second motive concerns the hedging of financial exposures. We proxy those exposures by the size of the bond market in domestic currency. Investors in this market may want to hedge the interest rate risk associated with these bonds, so we would expect a larger market to go hand in hand with higher turnover in the interest rate segment. Foreign investors in particular may also want to hedge the currency risk associated with their bond holdings, so we would expect bond market size to be related to turnover in the FX segment too. Unfortunately, we do not have data on the currency composition of domestically issued bonds, so we limit our attention to international issues. Since investors, even those who hold securities until maturity, tend to follow overlay strategies when hedging interest rate and currency risks, we look at amounts outstanding rather than new issuance.
The third motive is related to the level of integration with global markets as measured by the size of external assets and liabilities. We would expect high external liabilities to be associated with a high demand for (FX) hedging instruments on the part of domestic borrowers and thus larger turnover. The impact of large external assets on turnover is more ambiguous. On the one hand, the holders of these assets may want to hedge the associated exchange rate risk in derivatives markets,4 thus providing a natural counterpart to external borrowers. On the other hand, external assets may provide a natural hedge against currency fluctuations, thus dampening derivatives turnover. Since these effects centre on FX exposures, ideally we would like to separate each of these variables further, into domestic currency- and foreign currency-denominated assets and liabilities. Unfortunately, data availability precludes us from doing so for a large enough sample of countries.
Box B
Derivatives markets in Brazil
Virtually alone among emerging economies, Brazil boasts relatively large and well developed onshore derivatives exchanges that trade FX and interest rate contracts in addition to stock and commodity instruments. Brazilian FX futures and options are non-deliverable, in that they are settled in domestic currency. A particular combination of factors gave rise to such a large derivatives market, where exchange-traded, both onshore and non-deliverable, transactions predominate.
The instability of the Brazilian economy has created strong demand for hedging instruments, contributing to the development of a large derivatives market. High and volatile inflation, in particular at the end of the 1980s and beginning of the 1990s, led to widespread inflation-indexing and volatile real interest rates, which fostered the demand for instruments to manage inflation and interest rate risks. In the second half of the 1990s, after the "Real Plan" succeeded in reducing inflation and stabilising the exchange rate, the private sector made greater use of lower-cost foreign currency borrowing. The resulting exposure to foreign debt incentivised the use of FX futures for hedging.
The Brazilian legal and regulatory framework puts constraints on over-the-counter (OTC) trading, thus encouraging the migration of trading to exchanges. Taxes levied on revenues and cash flows rather than income or value added create a bias towards a system in which profits and losses of individual contracts can be netted, thus reducing the tax burden. This is the case on exchanges, where purchases and sales of the same contract can be offset against each other, but not in most OTC markets, where positions are closed by offsetting outstanding trades.
Restrictions on the use and trading of foreign currencies provide a further incentive for the use of derivatives as a substitute for cash transactions, while also explaining the preference for non-deliverable instruments settled in local currency. Access to the FX spot market is highly restricted, since only chartered banks have such authorisation. Also, local banks are not allowed to take deposits in foreign currency. In addition, the Brazilian real is not fully convertible and cannot be delivered outside the country, which precludes the development of a liquid (deliverable) offshore market.
Given its high liquidity, the FX futures market in Brazil is considered more developed than the spot market. The demand for hedges against exchange rate exposures is concentrated in the futures market, which in effect provides price discovery for the spot exchange rate. The link between those two markets is established via "synthetic" operations, known as "casado" or "differential" transactions, which are used to match positions between them. In such operations, it is possible to buy or sell dollars in the spot market while simultaneously selling or buying the same amount of dollar/real futures.
The liquidity of FX derivatives markets has encouraged central bank intervention in these markets, which has in turn spurred further development of these markets. During the 1990s, when the real followed a crawling peg, the central bank intervened by selling US dollar futures through state-owned commercial banks as intermediaries. Since 1999, when the floating regime was introduced, auctions of domestic non-deliverable currency swaps (the "swap cambial") to dealer banks have been very prominent. Another important intervention instrument has been the FX repo, which has been used to deal with liquidity shortages of FX cash, for example after the Great Financial Crisis. Derivatives-based interventions aim at providing liquidity in FX cash (eg repo) or a hedge (eg non-deliverable currency swap) to the private sector, without drawing, at least not definitively, on official FX reserves.
Owing to its depth and high level of development, the Brazilian derivatives market has been innovative and resilient to financial distress. During many episodes of financial turbulence, including the East Asian financial crisis (1997), the Russian debt moratorium (1998), the abandonment of the real peg (1999), the Argentine default (2001), the Great Financial Crisis (2007-09) and the recent fiscal and political crisis in Brazil (2015), the Brazilian derivatives market arguably helped prevent more serious financial distress or a credit crunch. It did so by providing low-cost, transparent and liquid trading vehicles for a wide range of customers (Dodd and Griffith-Jones (2007)). In particular, dealers, rather than taking market and counterparty risks on their own balance sheets, have been using the exchanges. The exchanges have maintained their prominent role by investing in efficiency improvements and have endeavoured to adopt international best practices. For example, they recently implemented a multimarket architecture that allows integrated risk management across a range of asset classes and contracts, as well as a post-trade integrated clearing house framework. This improves the netting of market risks and reduces the need for dealers to provide guarantees.
For more details, see Kohlscheen and Andrade (2014). Or are terminated; see Ehlers and Eren (2016). For details about price discovery in Brazilian FX markets, see Garcia, Medeiros and Santos (2014). For more about FX interventions in Brazil, see Garcia and Volpon (2014).
The fourth financial variable is the gross issuance of domestic currency bonds by non-residents. Several international financial institutions, such as the World Bank and the European Investment Bank, as well as other public and private entities issue bonds in EME currencies and swap the proceeds into their base currency. In contrast to the previous variables, this one does not refer to a stock but to a flow. This is because associated derivatives trades tend to be one-off transactions, often with tenors equal to the maturity of the underlying bond. We proxy these hedging needs with the gross issuance of local currency bonds by non-residents in the first half of the year.
In addition, we include measures for capital account controls and restrictions on cross-border derivatives transactions. Both are taken from Fernández et al (2015) and correspond to de jure restrictions, irrespective of how tightly they are enforced. Finally, we include GDP per capita of the home economy to control for income level.
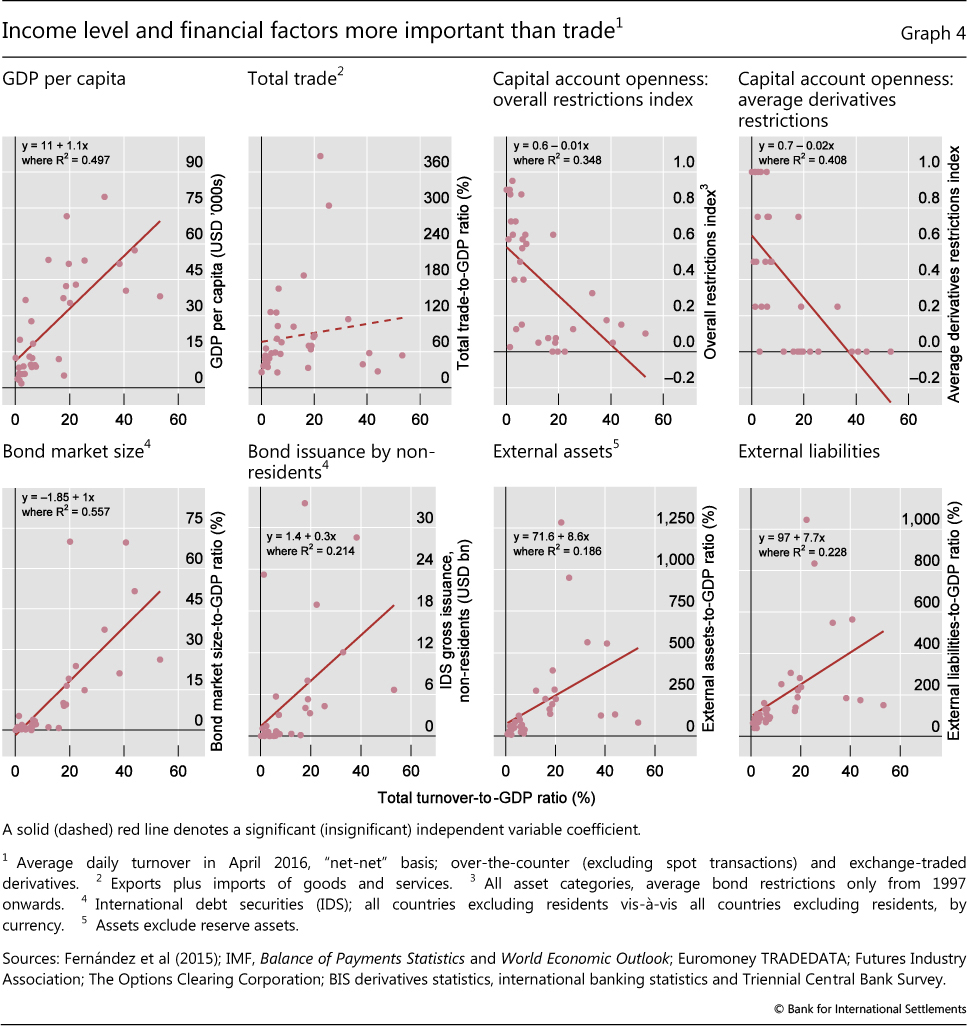
Simple bivariate regressions suggest that per capita GDP, capital account openness and bond market size are better predictors of market development than trade (Graph 4). This is in contrast with earlier work by Mihaljek and Packer (2010), who found a close association between (FX) derivatives turnover and trade. Non-resident bond issuance and large external assets and liabilities are also correlated with higher turnover, although their explanatory power is weaker.
These results are largely confirmed by multivariate regressions (Table 1). International trade remains insignificant regardless of the specification. By contrast, many of the financial variables turn out to be highly significant.
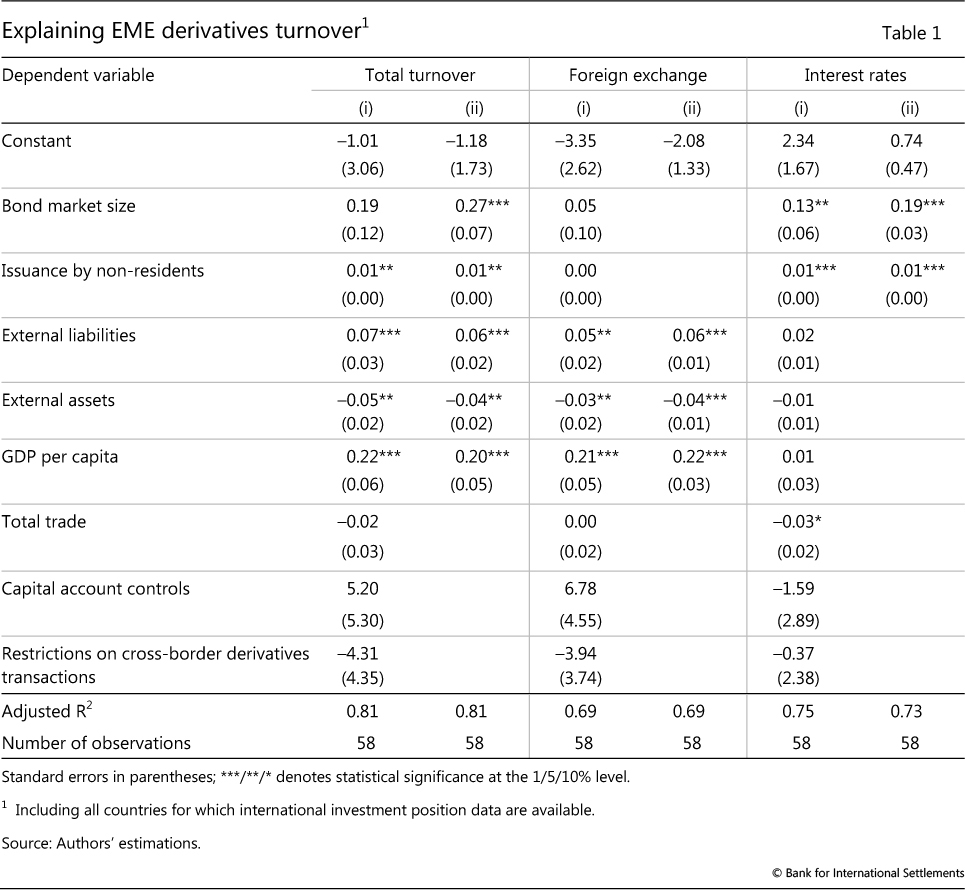
The total stock of bonds outstanding in a particular currency is an important driver of both interest rate and total derivatives turnover but is insignificant for FX turnover. Raising the stock of bonds outstanding to GDP by 1 percentage point is on average associated with a 0.3 percentage point higher ratio of derivatives turnover to GDP.
Large external liabilities are associated with significantly higher turnover in both FX and total derivatives, although the elasticity is smaller than for bond market size. High non-resident issuance in domestic currency is also associated with higher derivatives turnover, especially in the interest rate segment. Finally, economies with large external asset holdings tend to have lower derivatives turnover.
It is important to note that our results reflect correlations, not necessarily causality. While we measure all variables (except non-resident issuance) during or at the end of the previous year, this does not entirely eliminate endogeneity since the variables are mostly quite persistent. For instance, the negative coefficient on external assets could indicate that holders of external assets do not need to hedge their exposure to foreign currency; or, quite the contrary, that the limited ability to hedge through derivatives makes residents hold more external foreign currency assets. But in either case, there is little support for the notion that residents with external asset holdings provide a natural counterparty to those wanting to insure against currency fluctuations. The experience of Chile, where pension funds convert their external asset holdings into domestic currency and, in the process, serve as natural counterparts to residents wanting to hedge their foreign currency liabilities, appears to be the exception rather than the rule.
Controlling for such financial factors, the differences between advanced and emerging economy derivatives markets appear to reflect mainly differences in income. The level of per capita GDP is highly significant, both statistically and economically, whereas a dummy variable that takes the value of one if a country is an EME and zero otherwise turns out to be insignificant. Variables measuring capital account controls and restrictions on cross-border derivatives transactions also turn out to be insignificant. It is worthy of note that GDP per capita is significant for determining only turnover in the foreign exchange market, not that of interest rate contracts.5 This is quite puzzling because only relatively rich economies have sizeable interest rate derivatives markets.
Conclusions
Derivatives markets for EME currencies and interest rates tend to be much smaller than their advanced economy counterparts, in relation to both GDP and trade. EME derivatives markets are also limited to a narrower set of instruments, and a disproportionate part of trading takes place over the counter. While simple activity indicators such as the ones used in this article are only loosely related to market liquidity or trading costs, especially in the short term, there is reason to believe that residents of and investors in EMEs find it more difficult and more costly to hedge their exposures than their peers in advanced economies.
Our regression results suggest that the weaker turnover in EME reflects several factors, including a lower level of financial development (as measured by the size of the bond market in domestic currency), less integration in the global economy (as measured by the size of international liabilities) and lower per capita income. They also suggest that EME residents use their external asset holdings as a substitute for derivatives to hedge currency risk.
References
Avalos, F and R Moreno (2013): "Hedging in derivatives markets: the experience of Chile", BIS Quarterly Review, March, pp 53-63.
Bank for International Settlements (2016): "Glossary", BIS Quarterly Review, December, pp 27-33.
Chinn, M and H Ito (2008): "A new measure of financial openness", Journal of Comparative Policy Analysis: Research and Practice, vol 10, issue 3, pp 309-22.
Dodd, R and S Griffith-Jones (2007): "Brazil's derivatives markets: hedging, central bank intervention and regulation", Informes y Estudios Especiales, no 20, United Nations Publications, December.
Ehlers, T and E Eren (2016): "The changing shape of interest rate derivatives markets", BIS Quarterly Review, December, pp 53-65.
Fernández, A, M Klein, A Rebucci, M Schindler and M Uribe (2015): "Capital control measures: a new dataset", NBER Working Papers, no 20970, February.
Garcia, M, M Medeiros and F Santos (2014): "Price discovery in Brazilian FX markets", Textos para discussão, no 622, Department of Economics PUC-Rio (Brazil), May.
Garcia, M and T Volpon, (2014): "DNDFS: a more efficient way to intervene in FX markets?", Working Paper no 501, Center for International Development - Stanford University, May.
Kohlscheen, E and S Andrade (2014): "Official FX interventions through derivatives", Journal of International Money and Finance, 47, pp 202-16.
McCauley, R and M Scatigna (2011): "Foreign exchange trading in emerging currencies: more financial, more offshore", BIS Quarterly Review, March, pp 67-75.
--- (2013): "Currencies getting more financial", BIS Quarterly Review, December, p 25.
McCauley, R and C Shu (2016): "Non deliverable forwards: impact of currency internationalisation and derivatives reform", BIS Quarterly Review, December, pp 81-93.
Mihaljek, D and F Packer (2010): "Derivatives in emerging markets", BIS Quarterly Review, December, pp 43-58.
Moore, M, A Schrimpf and V Sushko (2016): "Downsized FX markets: causes and implications", BIS Quarterly Review, December, pp 35-51.
1 The views expressed here are those of the authors and do not necessarily reflect those of the BIS. We are grateful to Claudio Borio, Ben Cohen, Ramon Moreno, Hyun Song Shin and Phil Wooldridge for helpful comments and suggestions. Diego Urbina provided excellent research support; we are grateful for his patience and dedication. The authors of Box A would like to acknowledge the help of Steven Kong, Jimmy Shek, Tsvetana Spasova and Agne Subelyte. See the Glossary (BIS (2016)) for definitions of relevant technical terms.
2 Includes all contracts in the Argentine peso (ARS), Bulgarian lev (BGN), Bahraini dinar (BHD), Brazilian real (BRL), Chilean peso (CLP), Chinese renminbi (CNY), Colombian peso (COP), Czech koruna (CZK), Hungarian forint (HUF), Indonesian rupiah (IDR), Israeli new shekel (ILS), Indian rupee (INR), Korean won (KRW), Mexican peso (MXN), Malaysian ringgit (MYR), Peruvian sol (PEN), Philippine peso (PHP), Polish zloty (PLN), Romanian leu (RON), Russian rouble (RUB), Saudi riyal (SAR), Thai baht (THB), Turkish lira (TRY), New Taiwan dollar (TWD) and South African rand (ZAR). Data are subject to change.
3 The number of economies is constrained by the availability of data on international investment positions.
4 This might be because of having liabilities in domestic currency. Such a mechanism appears to be in place in Chile, where domestic pension funds hedge their foreign currency assets back into domestic currency (Avalos and Moreno (2013)).
5 McCauley and Scatigna (2011, 2013) find that FX turnover (including both spot and derivatives) increases with GDP per capita.