Sizing up global foreign exchange markets
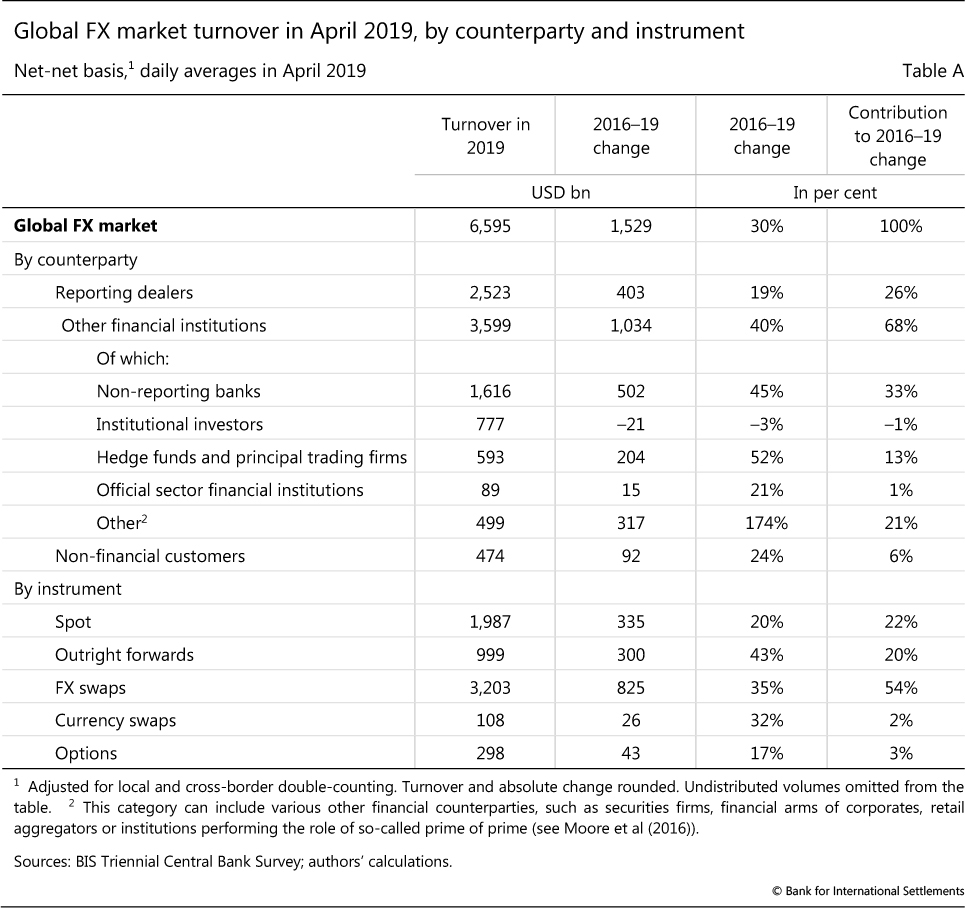
The latest BIS Triennial Survey shows that global foreign exchange trading increased to more than $6 trillion per day. Trading bounced back strongly following a dip in 2016, buoyed by increased trading with financial clients such as lower-tier banks, hedge funds and principal trading firms. Prime brokerage volumes recovered in tandem. These developments were driven in large part by the greater use of FX swaps for managing funding and greater electronification of customer trading. They led to further concentration of trading in a few financial hubs.1
JEL classification: C42, C82, F31, G12, G15.
Turnover in global foreign exchange (FX) markets reached $6.6 trillion per day in April 2019. This is up from $5.1 trillion per day in April 2016 and marked a return to the long-term upward trend in turnover recorded in each BIS Triennial Central Bank Survey since 2001. In this article, we explore the recent evolution in the size and structure of global FX markets by drawing on the latest survey.
The global FX market is more opaque than many other financial markets because it is organised as an over-the-counter (OTC) market built upon credit relationships. In recent years, changes in market structure, such as the internalisation of trades in dealers' proprietary liquidity pools, further reduced the share of trading activity that is "visible" to other market participants (Schrimpf and Sushko (2019) in this issue). The Triennial Survey provides a comprehensive, albeit infrequent, snapshot of activity in this highly fragmented market.2
Key takeaways
- Trading in global FX markets reached $6.6 trillion per day in April 2019, up from $5.1 trillion in April 2016.
- Increased use of FX swaps for bank funding liquidity management and hedging of foreign currency portfolios, as well as growth in prime brokerage, boosted trading.
- Electronification of FX markets spurred an even greater concentration of trading in a few financial hubs.
Statistical data: data behind all graphs
FX trading volumes in April 2019 were buoyed by a pickup in trading with financial clients, such as smaller banks, hedge funds and principal trading firms (PTFs). FX prime brokerage - intermediation services provided by top-tier FX dealers to financial clients - recovered in tandem. Prime brokerage expanded across all instruments, but was particularly visible in spot trading. This was largely due to a more active presence of PTFs, some of which have gained a firm footing as non-bank electronic market-makers. It also offset the continued decline in spot trading in inter-dealer markets.
A pickup in trading of FX swaps, especially by smaller banks, was the largest single contributor to the overall FX turnover growth (Annex Table A1). It was mainly driven by the use of swaps in banks' funding management. Another noteworthy development was robust trading in forwards, particularly in the non-deliverable forward (NDF) segment attractive to hedge funds and PTFs. While the increase in the trading of FX swaps and forwards accounted for about 75% of the rise in global FX volumes since 2016, growth in spot was more muted due to a prolonged period of subdued volatility and a decline in inter-dealer spot trading.
Further reading
Electronification in FX first took off in inter-dealer trading, but its trajectory has since changed. In recent years, the dealer-to-customer segment has seen the strongest rise in electronification. To the extent that electronic trading tends to be booked in a few major financial hubs, it also leads to a greater share of offshore trading.
This article is organised as follows. The first section provides empirical evidence of financial drivers behind FX volumes. The second digs deeper into developments in FX swaps, with a particular focus on trading by banks. The third discusses broader trends in trading with financial clients and across instruments, as well as FX prime brokerage. The fourth takes stock of the degree of electronification in FX trading across key market segments. The fifth section focuses on the trend towards more concentration of trading in major FX hubs, and, by extension, increased offshore trading. The final section concludes.
FX trading volumes mostly reflect financial motives
The recovery in volumes recorded in the 2019 Triennial Survey follows some unusually subdued trading activity three years ago, when the survey had shown a decline for the first time since 2001 (Graph 1, left-hand panel). In 2016, the prime brokerage business had still not fully recovered from the 2015 Swiss franc shock,3 the banking industry was adjusting to the new regulatory environment, and the composition of participants had changed in favour of more risk-averse players (Moore et al (2016)). Semiannual surveys by FX committees and other sources in the major centres confirm that 2019 represented a return to the long-term upward trend in FX trading (centre panel).4
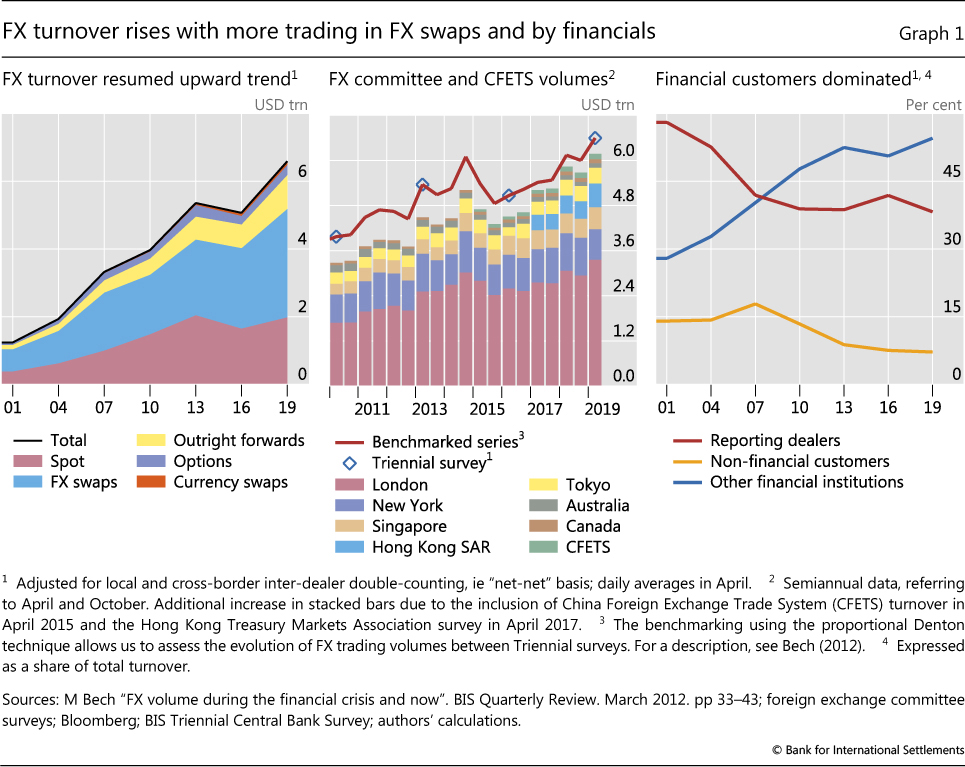
The 2019 survey shows that the evolution of FX trading volumes continues to be dominated mostly by financial institutions' motives as opposed to needs arising directly from real economic activity. The customer segment most closely linked to global trade is non-financial corporations, and in 2019 its share of trading remained almost unchanged at less than 8% (Graph 1, right-hand panel). The long-term shift towards financial customers outside the dealer community resumed, with the share of trading with other financial institutions rising from 51% in 2016 to 55% in 2019. By contrast, trading among reporting dealers grew little, so that the inter-dealer share in overall FX volumes continued its downward trend.
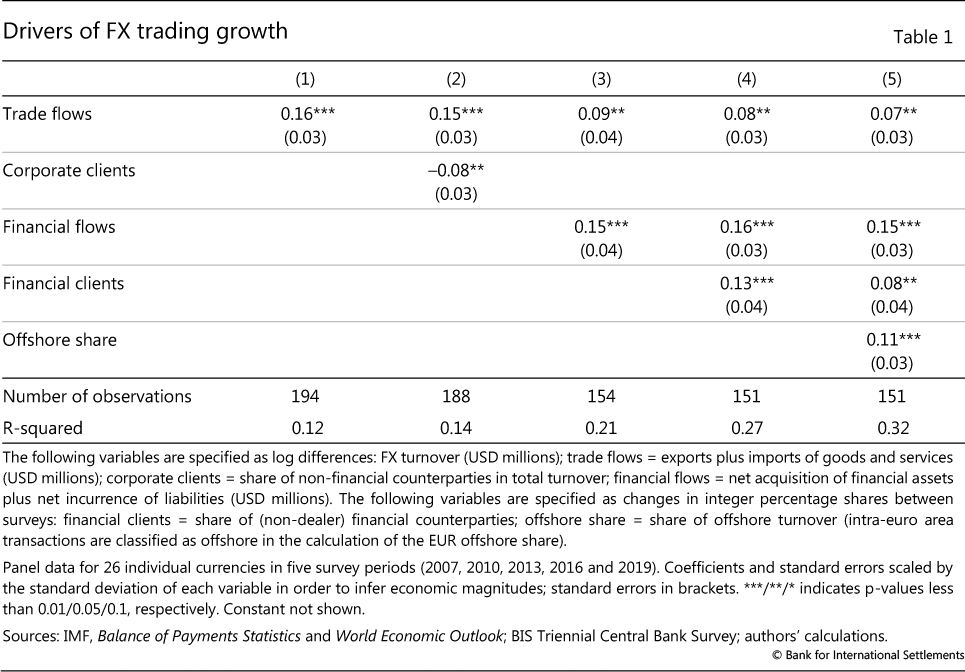
Regression analysis confirms the dominance of financial motives. As shown in Table 1, trade in goods and services shows a positive link with FX turnover (column 1), yet currencies featuring greater participation by corporates show sub-par growth (column 2). By contrast, FX turnover growth is better captured when financial flows (column 3) and the share of trading with financial clients (column 4) are accounted for. Furthermore, currencies featuring a higher share of trading offshore in financial centres have also seen higher FX turnover (column 5).5
Zooming in on FX swaps
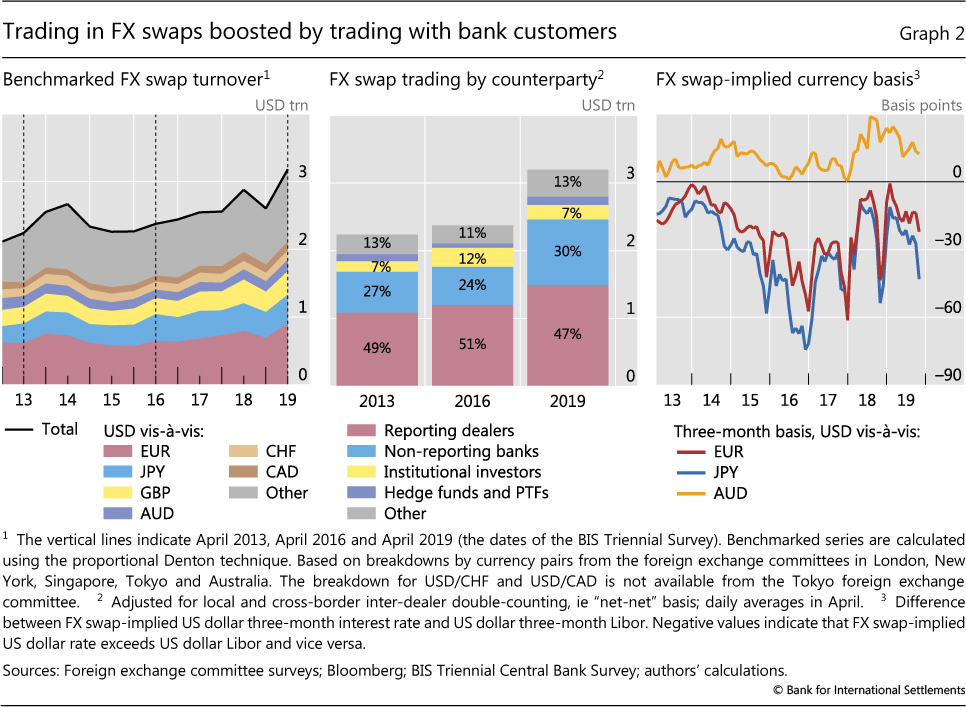
Since 2013, FX swaps and forwards have been the main instruments behind the growth in overall FX trading (Graph 1, left-hand panel).6 Their combined share of turnover rose from 54% in 2013 to 61% in 2016, and 64% in 2019. By contrast, the share of spot trading fell from 38% to 30% over this period.
The share of the US dollar in swaps is even higher than in spot, with USD on one side in more than 90% of FX swap turnover. The three most traded FX swap crosses are USD/EUR, USD/JPY and USD/GBP (Graph 2, left-hand panel). Two factors explain the dollar's dominance. First, it is the international funding currency of choice, and second, it serves as the primary vehicle currency for trading FX instruments.
FX swap trading picked up significantly between 2016 and 2019 (Graph 2, centre panel). The market has been in the spotlight since about 2014 on the back of the resurgence in price "anomalies" (right-hand panel; Borio et al (2016), Du et al (2018)). The rise in FX swap volumes went hand in hand with the divergence of FX swap-implied funding costs from money market rates in the respective currencies, continuing a trend already observed in 2016 (Moore et al (2016)).
Banks dominate FX swap trading
Inter-dealer trading accounted for 47% of all FX swap turnover. FX dealers can trade swaps for their own banks' treasury unit for funding, or on behalf of clients for funding and hedging purposes. They can also use FX swaps to construct offsetting hedges for their positions in related instruments, such as forwards and (longer-dated) currency swaps. Smaller banks ("non-reporting banks" in the survey terminology) accounted for another 30% of FX swap turnover. They enter FX swap transactions with reporting dealers to manage their own funding or FX hedging needs, or in order to provide intermediation services to their own local customer base, such as smaller and medium-sized corporates.7
Funding liquidity management and hedging of FX assets
The renewed expansion in FX swaps in the 2016-19 period largely owed to the increasing participation of lower-tier banks. The trading of these smaller and regional banks outside the group of global FX dealers accounted for $404 billion (about half) of the total increase in swap turnover. These banks relied more heavily on FX swaps for funding because they have more limited direct access to US dollar funding.
Major central banks' divergent balance sheet policies also affected banks' incentives to trade in FX swap markets. For instance, the abundant liquidity in the euro area strengthened European banks' incentives to swap excess euro liquidity into US dollars. Market sources indicate that this was driven by the demand to place abundant euro cash into a dollar-denominated safe and liquid asset, even if that meant paying up in the FX swap market to convert the currency. The actual need to fund longer-term dollar-denominated assets, by contrast, was reportedly a lesser consideration.
Banks' use of FX swaps for managing funding liquidity naturally favours shorter-term tenors. Indeed, $2.1 trillion, or 64%, of FX swap turnover was in maturities of seven days or less (Graph 3, left-hand panel). Over the 2016-19 period, the use of FX swaps relative to on-balance sheet funding by foreign bank affiliates in the US increased significantly (centre panel). This points to the importance of FX swaps in banks' funding liquidity management.
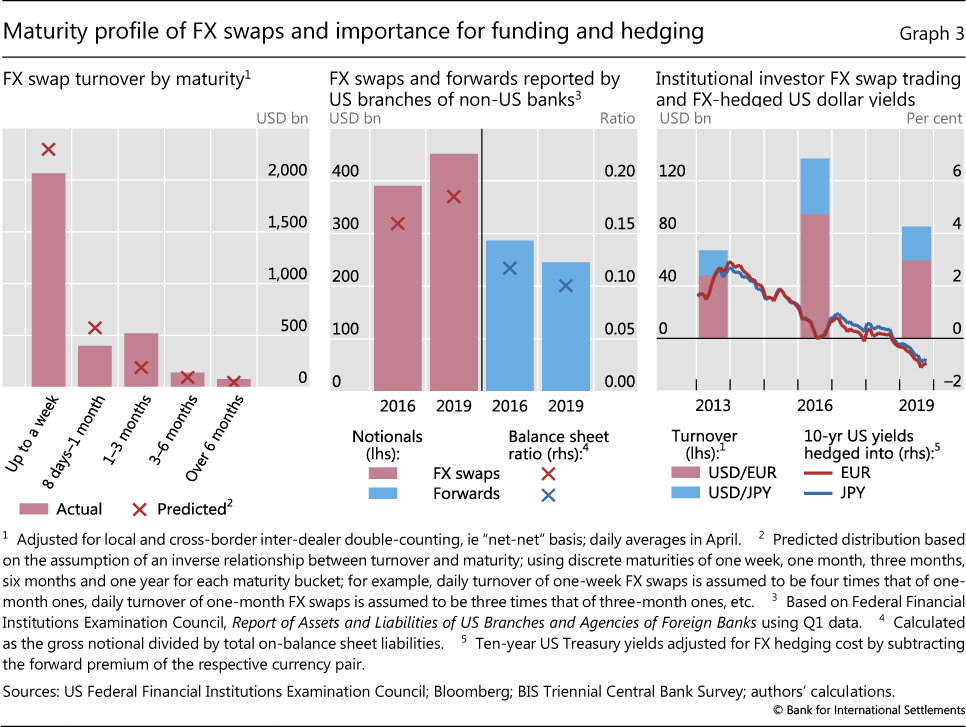
At the same time, asset managers and other investors also rely on FX swaps as rolling hedges for currency risk in international bond portfolios and passive investment fund vehicles. These have grown in both amounts and duration in recent years. FX swaps of one- to three-month tenors, which were popular maturities for such hedges, thus saw higher turnover compared with what one would expect solely on the basis of the inverse relationship between instrument maturity and trading frequency.
Opportunistic behaviour: arbitrage trades
Banks can also use FX swaps in order to exploit the pricing differentials implicit in them (the "cross-currency basis"), by varying their short-term borrowing and/or placement of funds across currencies. Specifically, financial institutions endowed with large amounts of US dollar reserve balances, or those with cheaper access to direct sources of dollar funding as well as access to central bank deposit facilities in different currencies, have been in a position to arbitrage dislocations in short-dated FX swaps (Rime et al (2017)). Opportunistic behaviour tends to intensify around regulatory reporting dates, and it goes both ways. Dealers of some of the largest banks reduce their FX swap intermediation around these dates (Krohn and Sushko (2019)), while some non-US banks face incentives to actively manage down their on-balance sheet funding by switching to off-balance sheet instruments, such as FX swaps. By contrast, others can take advantage of pricing dislocations by taking the other side and supplying the sought-after currency via FX swaps. Some central banks are also active in FX swaps, mostly as lenders of their US dollar reserves.
Other forms of arbitrage can also make use of FX swaps. For example, the linked exchange rate system of HKD/USD operates by capital flows arbitraging fluctuations in the Libor-Hibor interest rate differential (HKMA (2018)). Higher interest rate volatilities and divergence from US rates over the past three years have induced more arbitrage flows, with investors using FX swaps to synthetically create long/short positions in money markets in the two currencies. Such activity explains a good part of the doubling of HKD/USD turnover since the last Triennial Survey.
FX swap trading by institutional investors falls
In contrast to the increased FX swap trading by banks, trading by institutional investors has contracted since the last Triennial. This development was most visible in EUR/USD and JPY/USD - the two major crosses (Graph 3, right-hand panel). Institutional investors, such as insurance companies, typically use longer-dated FX swaps or forwards to hedge the currency risk of their foreign bond holdings.
The decline in swap trading by institutional investors in EUR/USD and JPY/USD since 2016 is explained by the evaporation of the pickup in yield from investing in long-term US Treasury bonds on an FX-hedged basis. In the past, with long-term yields compressed in conjunction with monetary easing by the ECB and the Bank of Japan, euro area and Japanese institutional investors sought higher yields by investing in US Treasury bonds. At the same time, they hedged the currency risk with FX swaps. A flattening of the yield curve since late 2016 made US Treasuries less attractive, once hedging costs (which are predicated on short-term rates in the two currencies) were factored in.8
Trading with financial clients and FX prime brokerage
Dealers' trading with "other financial institutions" - a category that includes non-reporting banks, hedge funds and PTFs, institutional investors and official sector financial institutions - grew notably since 2016 by $1 trillion, to $3.6 trillion. As such, the share of this heterogeneous group of financial clients has reached 55% of global volumes. Non-reporting banks - typically smaller, regional banks that serve as clients of the large FX dealer banks - remained the largest counterparty category within "other financial institutions", accounting for $1.6 trillion in daily turnover (Graph 4, left-hand panel). As described above, most of the FX trading activity by these smaller banks is in FX swaps.
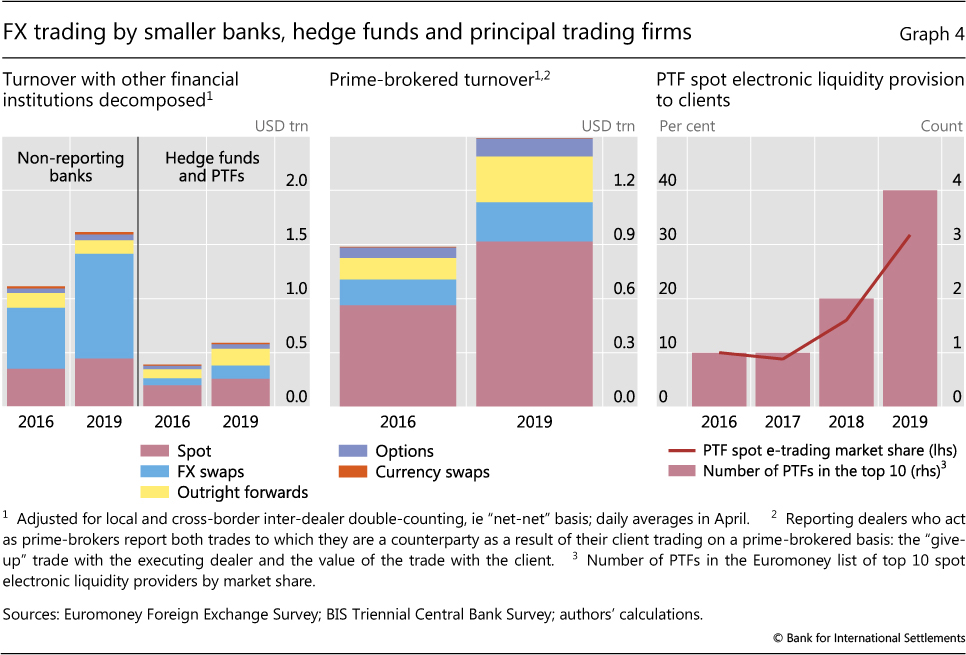
Trading with hedge funds and PTFs also increased significantly, to almost $600 billion. Hedge funds trade a variety of instruments, including FX swaps, forwards and options, which support their multi-asset trading strategies. By contrast, PTFs' algorithmic trading strategies employ instruments featuring a high degree of electronification, especially spot and, most recently, forwards.
Prime-brokered turnover recovers
Close to a third of trading by other financial institutions in 2019 was done via prime brokers, according to our estimates (see Box A). In a prime-brokered transaction, top FX dealers allow clients to trade directly in the bank's name with their established counterparties, subject to credit limits.9
Fuelled by greater demand from non-bank financial clients, the prime brokerage industry has largely recovered since 2015-16. Prime-brokered turnover rose to $1.5 trillion in April 2019, a 68% increase compared with the 2016 survey. While the growth mostly took place in spot (Graph 4, centre panel), it also exhibited a fairly large increase in FX swaps, outright forwards and options. At the same time, more conservative prime broker business models, tighter risk management practices and know-your-customer rules have favoured retaining only larger clients.
Non-bank electronic market-makers spur spot volumes
The 2019 Triennial points to an increased footprint of the so-called "non-bank electronic market-maker" community, which forms part of the broader group of PTFs. PTFs in general thrive on fast, algorithmic strategies and rely on speed instead of balance sheet to trade large volumes.10 To gain access to the FX market, PTFs rely exclusively on prime brokers. The OTC FX trading activity by these firms is almost exclusively in spot and has contributed to the rise in spot turnover.
The broader set of PTFs has long engaged in both "aggressive" (initiating trades) and "passive" (serving as a willing counterparty to trades initiated by others) trading on anonymous electronic brokerage platforms. Passive trading effectively represents liquidity provision: it involves posting price quotes (limit orders) that can be hit by aggressive orders by a counterparty seeking to execute a trade at the prevailing market price. Yet the anonymity of such trading means that the counterparty does not know that it is trading with a PTF, nor can it count on being matched with the same liquidity provider in the future.
What sets non-bank electronic market-makers apart from their other PTF peers is the greater use of passive (ie liquidity-providing) strategies and disclosed liquidity provision via a network of client relationships. Not only does the counterparty on the other side, such as a smaller bank or an asset manager, know they are trading with a non-bank market-maker, but they also count on the same firm for their FX liquidity needs in the future as repeat customers.
Non-bank electronic market-makers have now penetrated deeply into the realm that, until about five years ago, was exclusive to bank dealers. The 2019 Euromoney survey indicates that the share of PTFs in spot e-trading with buy-side clients rose sharply to 32%, up from 10% three years earlier (Graph 4, right-hand panel).11 What differentiates these new players from traditional bank dealers is that they substitute speed for balance sheet. As they have morphed into market-makers, alongside main FX dealing banks, they have become an integral part of FX intermediation and a key determinant of liquidity conditions, particularly in the spot market.
Box A
FX prime brokerage and its contribution to trading volumes
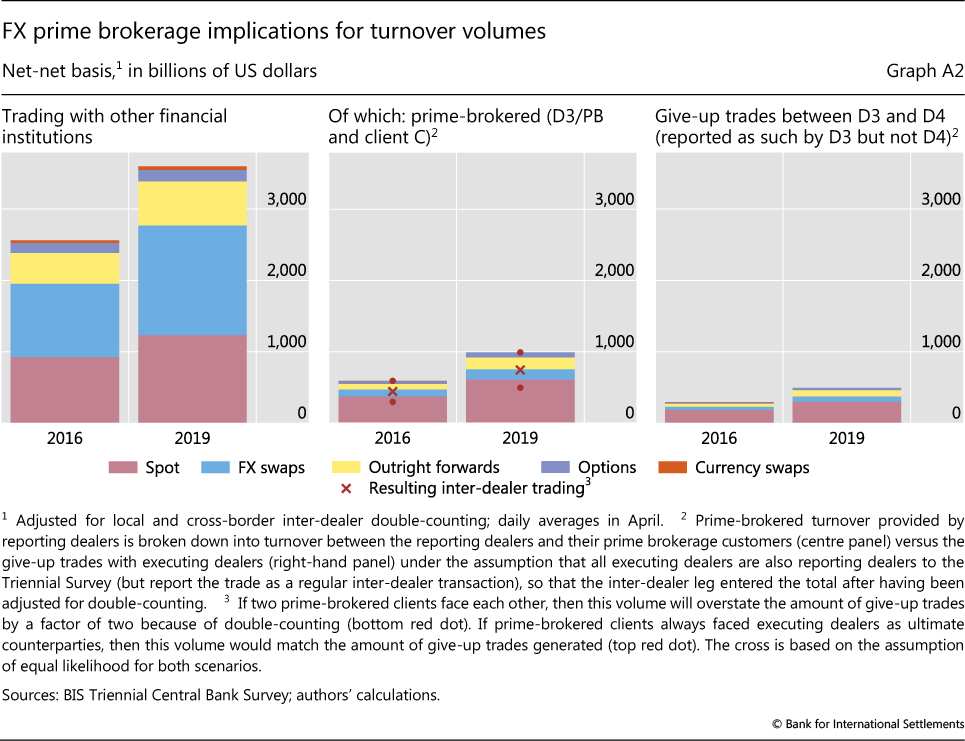
The biggest FX dealers in terms of volumes are also the biggest suppliers of prime brokerage (PB) services. PB enables clients to conduct trades with a group of predetermined third-party wholesale counterparties in the prime broker's name and using the prime broker's credit. This may also entail granting the client access to electronic platforms that once had been available only to major banks. By opening up the market and allowing greater participation by non-banks, PB has been an important catalyst of the move away from a clearly delineated two-tier market structure where dealers used to enjoy an exclusive role at the core.

In an FX PB relationship, the prime broker (D3/PB) guarantees the payment to the counterparty to the client's trade. As illustrated in Graph A1, the client (C) is granted credit to execute directly with another FX dealer (D4) in the prime broker's name (D3/PB). Upon execution, the client trade is normally "given up" to the prime broker. When the prime broker is informed and accepts the transaction between its client and another wholesale market participant (ie the so-called executing dealer, D4), it is the prime broker (rather than the client) which becomes the party to the transaction. The transaction between the prime broker and the executing dealer is defined by what is called a "give-up agreement".
A key benefit that prime brokers provide to their customers is anonymity: the counterparty to the customer's trade (executing dealer D4) typically does not know that they are in fact dealing with a client (C) of a prime broker (dashed red arrow), as they only see the prime broker's identity (D3/PB). Prime brokers receive a fee for these services, which also include consolidated settlement, clearing and reporting.
In 2019, close to a third of turnover with financial customers was prime-brokered, as estimated from the corresponding breakdown in the Triennial Survey (Graph A2, left-hand and centre panels). The rising prevalence of PB has implications for the turnover figures recorded by the Triennial. Even though effectively C trades with D4, there are actually two trades taking place which need to be recorded in the survey. In a scenario where two prime-brokered clients face each other directly, and their respective prime brokers each record another trade with their prime-brokered customer, a give-up trade executed by the two prime-brokered customers could create three times the turnover of a direct transaction. Hence, FX PB volumes to financial customers, which capture the amount of credit backing prime-brokered customer trades, may exceed the associated give-up trades in the inter-dealer market (centre and right-hand panels).
Given the central role played by credit, very large client trading losses can result in capital losses for prime brokers. The entire industry was jolted on 15 January 2015 when the Swiss franc moved by an intraday maximum of 39% against the euro after the Swiss National Bank abandoned its exchange rate ceiling. Although they recovered by the end of the day, key CHF exchange rate crosses against USD and EUR moved by as much as 12 standard deviations on that day. The shockwaves were felt in all corners of global FX markets. Prime brokers' risk management models were simply not set up to take into account such an extreme tail event. Individual losses to banks providing PB services to specialised retail FX margin brokers were in the hundreds of millions. Overall, the industry underwent a tightening of credit and risk management, more restrictive client onboarding requirements and consolidation. These developments were a key factor behind unusually depressed FX volumes as captured in the 2016 Triennial.
Despite industry-wide changes, more recent examples show that prime brokers continue to face idiosyncratic risks from losses on client trades. According to media reports, in December 2018 a major FX dealer bank faced large losses stemming from a hedge fund client's trades in the Turkish lira, which experienced a bout of unusual volatility. As the client could not meet a margin call, the ensuing losses triggered a revision of the bank's entire approach to FX PB, including offboarding of large PTFs engaged in FX as non-bank market-makers.
See Federal Reserve Bank of New York (2005) and Hasbrouck and Levich (2017) for a discussion. Prime-brokered turnover provided by reporting dealers is broken down into turnover between the reporting dealers and their prime brokerage customers (D3/PB with C) versus the "give-up" trades with executing dealers (D3 with D4) under the assumption that all executing dealers are also reporting dealers to the Triennial Survey, so that the inter-dealer leg entered the total after having been adjusted for double-counting. Many prime brokers evaluated their business model and risk appetite after the Swiss franc shock, shedding certain types of clients (smaller hedge funds and retail brokers, who were pushed towards the so-called prime of prime model; see Moore et al (2016) for a discussion).
Electronification of trading across key market segments
Electronic execution (e-trading) allows for fast trading and therefore contributes to overall FX turnover growth. In aggregate, the share of FX trading done electronically edged up only slightly to 56% in 2019. However, there are notable differences in the progress of electronification across instruments, and in inter-dealer versus dealer-to-customer market segments.
FX market electronification originally took off in the inter-dealer spot segment with the advent of centralised limit order books on electronic brokerage platforms such as EBS and Reuters (Refinitiv). However, this market segment no longer leads in electronification of FX trading. In fact, the share of e-trading in inter-dealer spot markets actually witnessed a decline (see Schrimpf and Sushko (2019) in this issue). It grew at a much faster pace in dealer-to-customer transactions with other financial institutions (Graph 5, left-hand panel). As discussed above, much of this increase owes to more active participation by PTFs as non-bank market-makers.
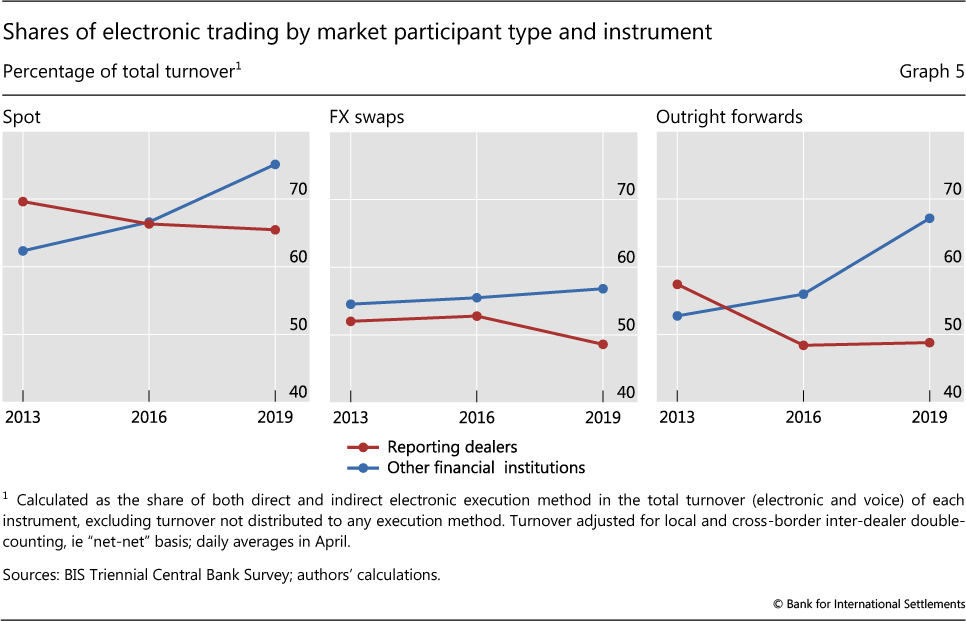
The divergence in the pace of electronification between the dealer-to-customer and dealer-to-dealer segments is also visible in other instruments, such as FX swaps and, especially, forwards (Graph 5, centre and right-hand panels). Trading in forwards between dealers and their financial customers exhibited the most rapid pace of electronification. Trading in NDFs constitutes a significant part of this activity (see Patel and Xia (2019) in this issue). In particular, making NDFs tradable on electronic platforms has attracted greater volumes from hedge funds and PTFs.12
Concentration of FX trading in offshore hubs
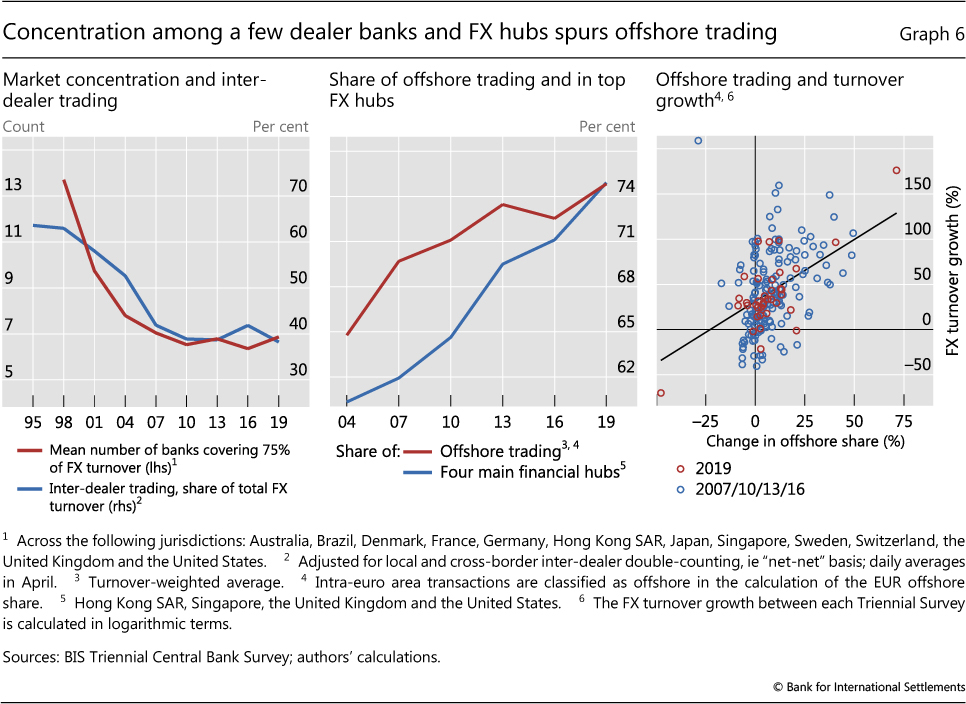
Even though FX trading is highly fragmented across numerous electronic venues and "liquidity pools", most activity passes through the desks of just a handful of top dealers (Graph 6, left-hand panel) in a few financial hubs. London alone accounts for 43%, while the combined share of the top four trading centres, which also include New York, Singapore and Hong Kong SAR, amounts to 75% of global FX turnover. Moreover, their combined share increased steadily (centre panel).
This concentration tendency has naturally gone hand in hand with a higher share of offshore trading, transactions where both counterparties are located outside the currency-issuing jurisdiction. In today's currency markets that trade around the clock, offshore trading is the norm. The share of offshore trading for the US dollar, euro and Japanese yen - the three most traded currencies - is 79%, 84% and 74%, respectively.
The economies of geographical concentration are the main force driving the rise of offshore trading. It is much less costly to build counterparty and credit relationships with dealers and clients in just a handful of centres than in each country separately. Placing FX desks within the same location as banks' other functions, such as money market and treasury units, also favours major financial centres. Differences in legal frameworks and IT infrastructures,13 and the sheer number of business affiliates that would be required to run geographically dispersed FX trading, all speak in favour of geographical concentration.14 In particular, major dealers tend to consolidate their electronic trading business in one of the major FX hubs. This concentration thus partly compensates for the decentralised OTC structure of FX markets.
Hence, a rise in the share of offshore trading is associated with a rise in that currency's trading volume, and vice versa (Graph 6, right-hand panel, and in line with regression results reported in Table 1). For example, the decline in the turnover in the Malaysian ringgit between 2016 and 2019 is consistent with authorities effectively prohibiting offshore MYR trading. The relatively slow growth of renminbi trading is also in line with the fall in the share of offshore renminbi (CNH) trading (see Box B).
Conclusion
Global FX volumes recovered from the lows recorded in the previous BIS Triennial Survey. FX trading volumes were buoyed by a pickup in trading with financial clients, such as smaller banks, hedge funds and principal trading firms. Prime brokerage volumes thus saw a rebound across all instruments, which was particularly visible in spot. A strong pickup in trading of FX swaps, especially by smaller banks, was the largest single contributor to overall FX turnover growth, and largely owed to the crucial role of these instruments in banks' funding liquidity management.
The 2019 Triennial results also point to the increased footprint of non-bank electronic market-makers, a subset of the broader class of principal trading firms. These new players provide FX intermediation services by substituting speed for balance sheet. Their larger FX market presence, now also in direct relationship trading akin to that of bank dealers, has become vital to understanding liquidity conditions and market functioning.
The dominance of financial trading motives and further electronification of FX trading, particularly in the dealer-customer segment, has been conducive to further concentration of trading in a few financial hubs where e-trading is booked. Hence, more geographically concentrated trading, aided by technology, compensates to some extent for the otherwise highly fragmented nature of FX markets.
Box B
Renminbi turnover tilts onshore
Frank Packer, Andreas Schrimpf and Vladyslav Sushko
The average daily turnover of the Chinese renminbi (RMB) surpassed $280 billion per day in April 2019, yet it remained only the world's eighth most traded currency (Graph B1, left-hand panel). The share of RMB in global FX trading rose by less than between previous Triennial Surveys, to 4.3% in 2019, because of subdued growth in offshore RMB (CNH) trading. RMB turnover remains lower than expected based on real economy indicators, such as trade volume and GDP per capita (centre panel). The deviation can be explained by financial drivers, such as restrictions on financial capital flows. For the first time in over a decade, the relative importance of onshore RMB trading on platforms such as CFETS increased, while the share of CNH turnover declined, from 73% in 2016 to 64% in 2019 (right-hand panel).
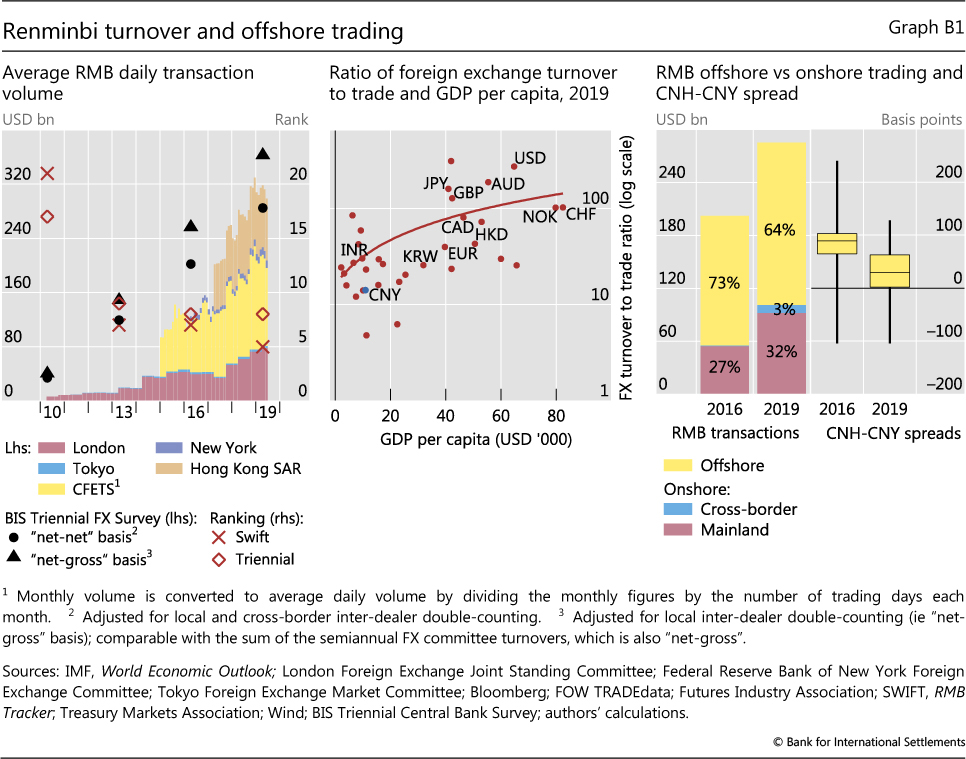
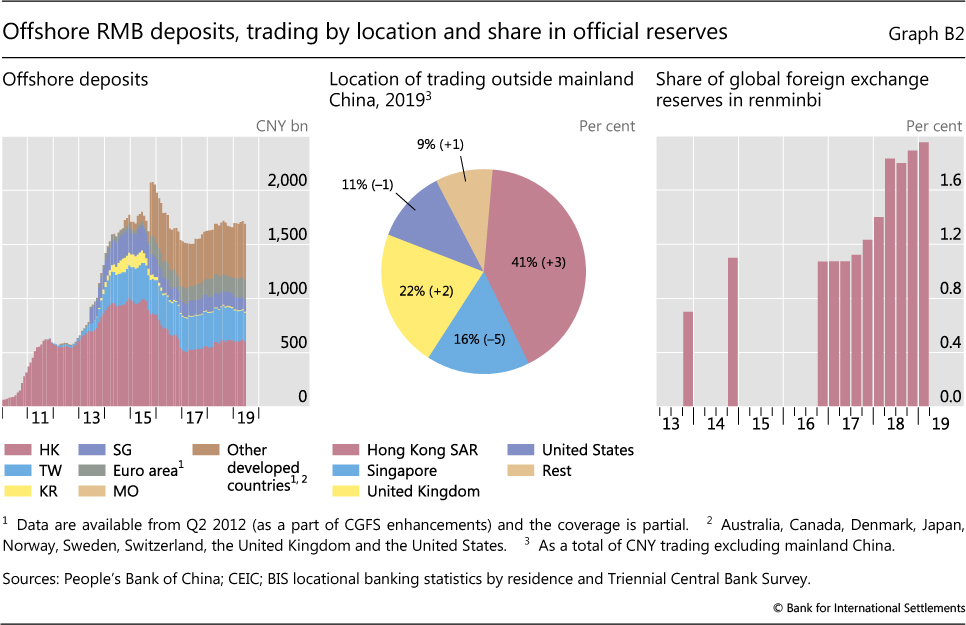
The offshore share of RMB activity declined for a few reasons. First, several liquidity squeezes in the CNH market in 2016-17 deterred speculative activity. CNH-CNY spreads were lower in 2019 than in 2016 (Graph B1, right-hand panel). Second, returns on offshore deposits were low, making them less attractive than those in other currencies and weighing on their growth (Graph B2, left-hand panel). Third, tighter controls by the mainland authorities reduced issuance of RMB bonds offshore (dim sum bonds) by Chinese corporates. The total stock of dim sum bonds declined between late 2016 and mid-2019, which had a negative impact on CNH liquidity. Fourth, Chinese authorities began to offer more direct ways for foreign investors to access onshore RMB markets. They opened more channels, such as Stock Connect, Bond Connect and CFETS Connect, and increased the quota for foreign institutional investors. These initiatives resulted in net investment flows from Hong Kong SAR to the mainland in excess of RMB 350 billion between Q2 2018 and Q1 2019.
Over the past three years, offshore RMB activity saw an important shift in terms of location of trading, with the shares of Hong Kong and London rising to 41% and 22%, respectively (Graph B2, centre panel). As hedge fund interest in CNH has waned, due to the factors listed above, offshore trading in RMB has favoured banking and clearing centres with direct onshore links, most notably in Hong Kong. Hence, in April RMB ranked fifth in SWIFT (Graph B1, left-hand panel), which captures bank-to-bank payment flows. London has also continued to increase its status as a leading offshore hub for RMB, having displaced Singapore as the largest trading centre for RMB outside greater China.
In contrast with the decelerating growth in overall RMB turnover, central bank reserves held in RMB rose significantly in recent years, with official institutions accounting for 51% of total turnover by foreign institutional investors by Q3 2018. RMB turnover involving official sector counterparties grew from a daily average of $1.1 billion to $2.0 billion over the last three years. At the same time, the RMB's share in total FX reserves almost doubled from 1% in 2016 to nearly 2% in 2019, equivalent to about $200 billion (Graph B2, right-hand panel), further evidence of the increased attention of the public sector to investment opportunities in RMB. RMB reserve allocations have benefited from the authorities' stepwise process of opening up onshore markets, as well as relatively high returns compared with other fixed income instruments and good diversification properties relative to other reserve currencies.
CNH is used to refer to offshore RMB activity, CNY onshore activity. In addition to intervention in the market, the People's Bank of China also imposed a reserve requirement on the offshore renminbi in 2016. See eg Ehlers et al (2016). Citi Research (2019). This is consistent with the prediction of Cheung et al (2019). Rigaudy (2019).
References
Bech, M (2012): "FX volume during the financial crisis and now", BIS Quarterly Review, March, pp 33-43.
Borio, C, R McCauley and P McGuire (2017): "FX swaps and forwards: missing global debt?", BIS Quarterly Review, September, pp 37-54.
Borio, C, R McCauley, P McGuire and V Sushko (2016): "Covered interest parity lost: understanding the cross-currency basis", BIS Quarterly Review, September, pp 45-64.
Cheung, Y W, R McCauley and C Shu (2019): "Geographic spread currency trading: the renminbi and other EM currencies", BIS Working Papers, no 806.
Chitu, L, B Eichengreen and A Mehl (2014): "When did the dollar overtake sterling as the leading international currency? Evidence from the bond markets", Journal of Development Economics, vol 111, pp 225-45.
Du, W, A Tepper and A Verdelhan (2018): "Deviations from covered interest rate parity", Journal of Finance, vol 73, no 3, pp 915-57.
Ehlers, T, F Packer and F Zhu (2016): "The changing landscape of renminbi offshore and onshore markets", BIS Quarterly Review, December, pp 72-3.
Eichengreen, B, R Lafarguette and A Mehl (2016): "Cables, sharks and servers: technology and the geography of the foreign exchange market", NBER Working Paper, no 21884, January.
Federal Reserve Bank of New York (2005): "Foreign exchange prime brokerage, product overview and best practice recommendations", Annual Report, pp 33-46.
Hasbrouck, J and R Levich (2017): "FX market metrics: New findings based on CLS bank settlement data", NBER Working Paper, no 23206.
Hong Kong Monetary Authority (2018): "Linked exchange rate system operations - mechanism and theory", Research Memorandum, 11/2018, December.
Krohn, I and V Sushko (2019): "FX spot and swap market liquidity spillovers", BIS Working Papers, forthcoming.
McCauley, R and M Scatigna (2011): "Foreign exchange trading in emerging currencies: more financial, more offshore", BIS Quarterly Review, March, pp 67-75.
Moore, M, A Schrimpf and V Sushko (2016): "Downsized FX markets: causes and implications", BIS Quarterly Review, December, pp 35-51.
Patel, N and D Xia (2019): "Offshore markets drive FX trading of emerging market currencies", BIS Quarterly Review, December, pp 53-67.
Rigaudy, J-F (2019): "Renminbi reserves are still relatively small", Central Banking, February.
Rime, D, A Schrimpf and O Syrstad (2017): "Segmented money markets and covered interest parity arbitrage", BIS Working Papers, no 651, July.
Schrimpf, A and V Sushko (2019): "FX trade execution: complex and highly fragmented", BIS Quarterly Review, December, pp 39-51.
Annex table
1 We thank Sirio Aramonte, Claudio Borio, Alain Chaboud, Ying-Wong Cheung, Stijn Claessens, Torsten Ehlers, Ingo Fender, Brian Hardy, Wenqian Huang, Robert McCauley, Dagfinn Rime, Maik Schmeling, Olav Syrstad and Philip Wooldridge for helpful comments and suggestions. We also appreciate the feedback and insightful discussions with a number of market participants at major FX dealing banks, buy-side institutions, electronic market-makers and trading platform providers. We are also grateful to Yifan Ma and Denis Pêtre for compiling the data and Adam Cap for excellent research assistance. The views expressed are those of the authors and do not necessarily reflect those of the Bank for International Settlements.
2 Central banks and other authorities in 53 jurisdictions participated in the 2019 survey, which collected data from close to 1,300 banks and other dealers. For information about the Triennial Survey, see www.bis.org/statistics/rpfx19.htm.
3 The abandonment of the Swiss franc's floor regime with the euro on 15 January 2015 led to extreme currency moves. It shook the entire FX industry, especially prime brokerage, and exerted lasting effects on trading volumes (see Box A and Moore et al (2016)).
4 Global FX turnover probably briefly surpassed $6 trillion already in September 2014, as discussed in Box A in Moore at al (2016).
5 These results extend the findings of McCauley and Scatigna (2011) and Chitu et al (2014). At the same time, these results may understate the importance of corporate clients in affecting FX flow. While large multinational corporations may trade directly with top-tier FX banks (captured as such in the Triennial), other corporates are more likely to be intermediated by smaller and more locally oriented (non-reporting) banks. Trading by the latter could hence effectively act as a conduit for real economy driven flows to reach the FX market.
6 An FX swap is an OTC derivatives contract consisting of a spot and a forward leg. Effectively it is a term loan of one currency collateralised with another currency. While FX swaps constitute an off-balance sheet derivatives position from an accounting perspective, in many respects they fulfil a similar economic function to secured foreign currency debt (Borio et al (2017)). The pricing of the FX swap, ie the forward premium/discount, is linked to money market rates in the two currencies via a law of one price relation known as covered interest parity (CIP).
7 Market sources indicate that second-tier banks have also increased their own presence as FX swap intermediaries. Krohn and Sushko (2019) find evidence that smaller banks displaced larger dealers as market-makers in FX swaps at times when large banks managed down their balance sheets around regulatory reporting periods.
8 The relative steepness of the US yield curve (vis-à-vis investors' home country one) matters because FX hedging costs depend on the level of short-term rates while the investment returns are predicated on the level of long-term yields. More precisely, euro area or Japanese institutions effectively pay the short-end yield differential (via the FX swap transaction) and earn the long-end yield differential.
9 This way, the client gains access to the deep liquidity of electronic trading venues.
10 In addition to market-making, PTF trading strategies can also include statistical arbitrage, latency arbitrage and momentum or trend-following. Many PTFs have their roots as high-frequency trading firms in equity and futures markets, but then ventured into OTC trading in deep and liquid FX spot markets. Electronic prime brokerage offers them access and anonymity for executing high-speed algorithmic strategies on electronic venues.
11 The 2019 Euromoney rankings of top electronic spot liquidity providers include non-bank names such as XTX Markets, HC Tech, Jump Trading and Citadel Securities, alongside known bank dealers such as Deutsche Bank, JPMorgan, UBS, Citi, Goldman Sachs and Bank of America Merrill Lynch. Other PTFs with sizeable FX market footprints, many of which operate across other asset classes, include Flow Traders, GTS, Hudson Trading, Tower Research Capital and Virtu Financial.
12 Discussions with market participants suggest that, while more than 90% of PTFs' turnover in OTC FX instruments is in spot, their trading in forwards has been growing rapidly and tends to be concentrated disproportionately in NDF currencies.
13 Eichengreen et al (2016) argue that technology has implications for the distribution of FX transactions across financial centres, boosting the share of London in global turnover by as much as one third.
14 For example, there are three main Equinix data centres and internet exchange sites: London (LD4), New York (NY4) and Tokyo (TY4). Major electronic brokers and FX dealers co-locate their servers in these locations, and so do the more sophisticated FX clients.