Offshore markets drive trading of emerging market currencies
FX markets for the currencies of emerging market economies grew more rapidly than those for major currencies between 2016 and 2019, rising from 19% to almost 25% of global turnover. At the same time, these currencies attracted a wider range of participants and saw a rapid increase in offshore trading activity. Offshore markets tended to drive onshore markets during times of global market stress.1
JEL classification: F31, G12, G23.
In foreign exchange (FX) markets, the trading of emerging market economy (EME) currencies outgrew that of major currencies between 2016 and 2019. While global turnover rose by 33%, the turnover of EME currencies rose by almost 60% over this period, to $1.6 trillion. This article highlights recent trends in the trading of EME currencies and discusses the main drivers of their recent growth.
One notable trend in EME currency trading was an increase in the share of trading generated by hedge funds, proprietary trading firms (PTFs) and other financial customers. A second trend was a surge in offshore trading. An important driver here was the growing appetite of global investors for EME assets. In addition, the electronification of FX trading enabled smaller players to participate in a market traditionally dominated by inter-dealer trading among large banks. Finally, activity continued to be influenced by restrictions on currency convertibility.
The remainder of this article is organised as follows. The next section describes the growth in FX markets for EME currencies between 2016 and 2019, drawing on data from the BIS Triennial Central Bank Survey.2 We then detail changes in the composition of market participants, instruments and trading venues and analyse their drivers. The last section summarises the key policy implications.
Key takeaways
- Markets for EME currencies grew faster than those for major currencies between 2016 and 2019.
- Global demand for emerging market assets and the electronification of trading drove recent growth.
- During times of FX market stress, offshore markets for EME currencies tend to drive onshore prices.
Statistical data: data behind all graphs
Growth of FX trading in EME currencies
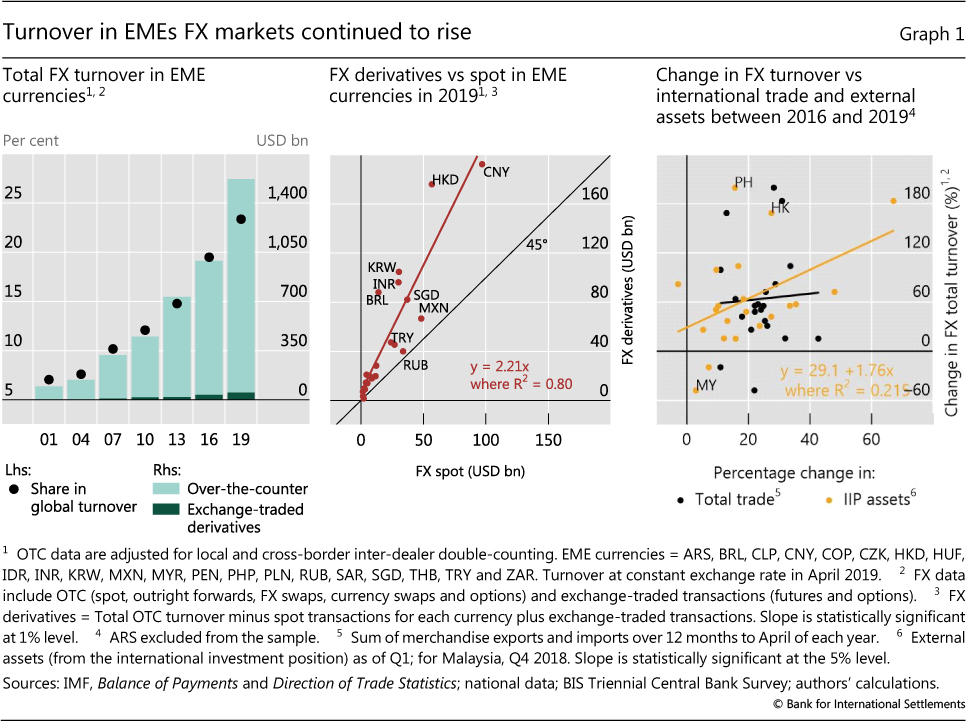
For many years, FX trading in EME currencies has outgrown that of advanced economy (AE) currencies. The average daily turnover of EME currencies rose by almost 60% between April 2016 and April 2019, to almost $1.6 trillion (Graph 1, left-hand panel). This boosted the share of EME currencies in global turnover to 23%, up from 19% in 2016 and 15% in 2013.
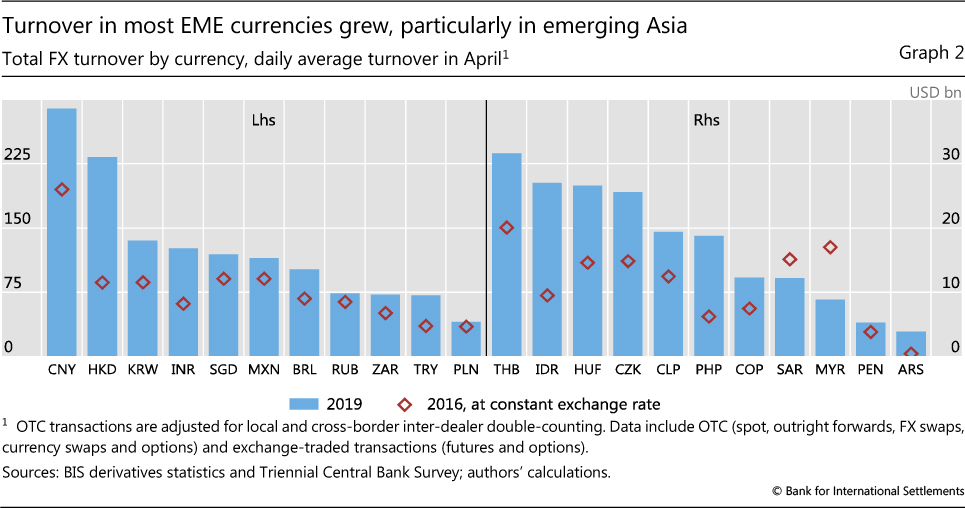
The increase in FX turnover was particularly pronounced in many Asian currencies (Graph 2). The Chinese renminbi was the most traded EME currency, at $289 billion per day in April 2019, but its 48% growth between 2016 and 2019 was moderate when compared with that of many other currencies (see Packer et al (2019) in this issue).
Trading in the Indian rupee, Indonesian rupiah and Philippine peso more than doubled, despite continued restrictions on their convertibility. In contrast, many of the more freely convertible EME currencies, such as the Mexican peso, Singapore dollar and South African rand, experienced below average growth. The Hong Kong dollar stood out with one of the largest increases in turnover, due probably to temporary factors in April 2019 related to local funding conditions.
A notable exception to the rapid increase in EME currencies' turnover was the Malaysian ringgit, which experienced a 48% decline in turnover between 2016 and 2019. New administrative restrictions contributed to the sharp decline in ringgit turnover. The Malaysian authorities banned offshore trading of non-deliverable forwards (NDFs) by domestic entities.3 As a result, offshore trading in the ringgit collapsed between 2016 to 2019. While measures were also introduced to promote onshore trading, the rise in onshore trading could not outweigh the decline in offshore trading.
Further reading
For EME currencies, as for AE currencies, the turnover of FX derivatives greatly exceeded spot transactions. Derivatives trading in EME currencies approached $1.1 trillion per day in April 2019, whereas spot trading was less than $0.5 trillion. The volume of derivatives trading was, on average, double that of spot trading for both EME and AE currencies (Graph 1, centre panel).4 Notable exceptions included the Mexican peso and Russian rouble, where derivatives trading in April 2019 was low relative to spot trading, and the Hong Kong dollar, where derivatives trading was relatively high. For most EME currencies, the FX derivatives markets were larger and more developed than those for interest rate derivatives (see Box A).
In line with global patterns, trading on over-the-counter (OTC) markets greatly exceeded that on exchanges. For EME currencies, OTC FX derivatives accounted for 95% of the total turnover, slightly below their 98% global share.5 In April 2019, exchange-traded derivatives accounted for a substantial share of activity in only two currencies: the Brazilian real (36%) and the Indian rupee (13%).
Box A
FX instruments dominate derivatives markets in EMEs
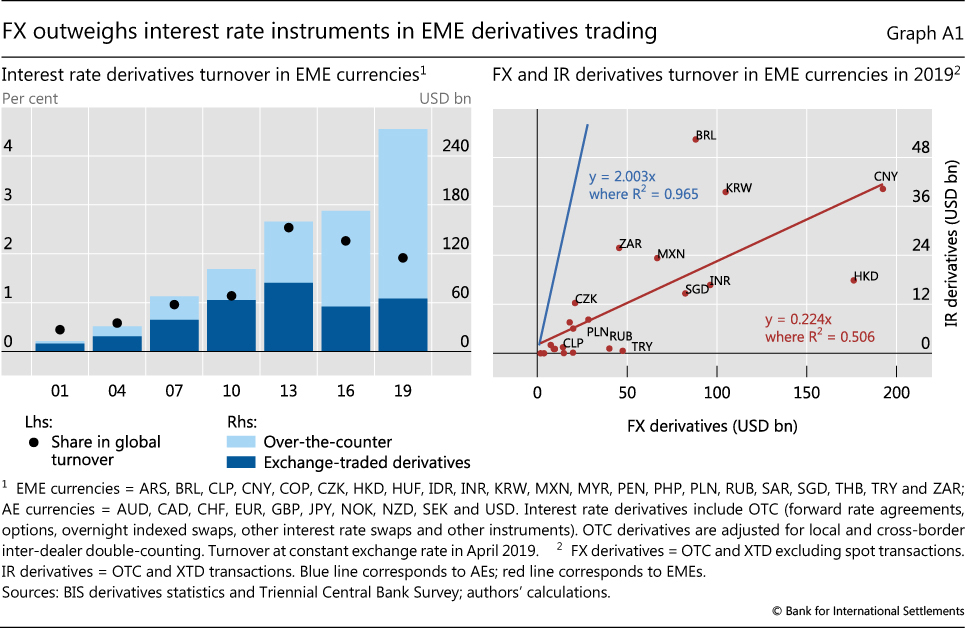
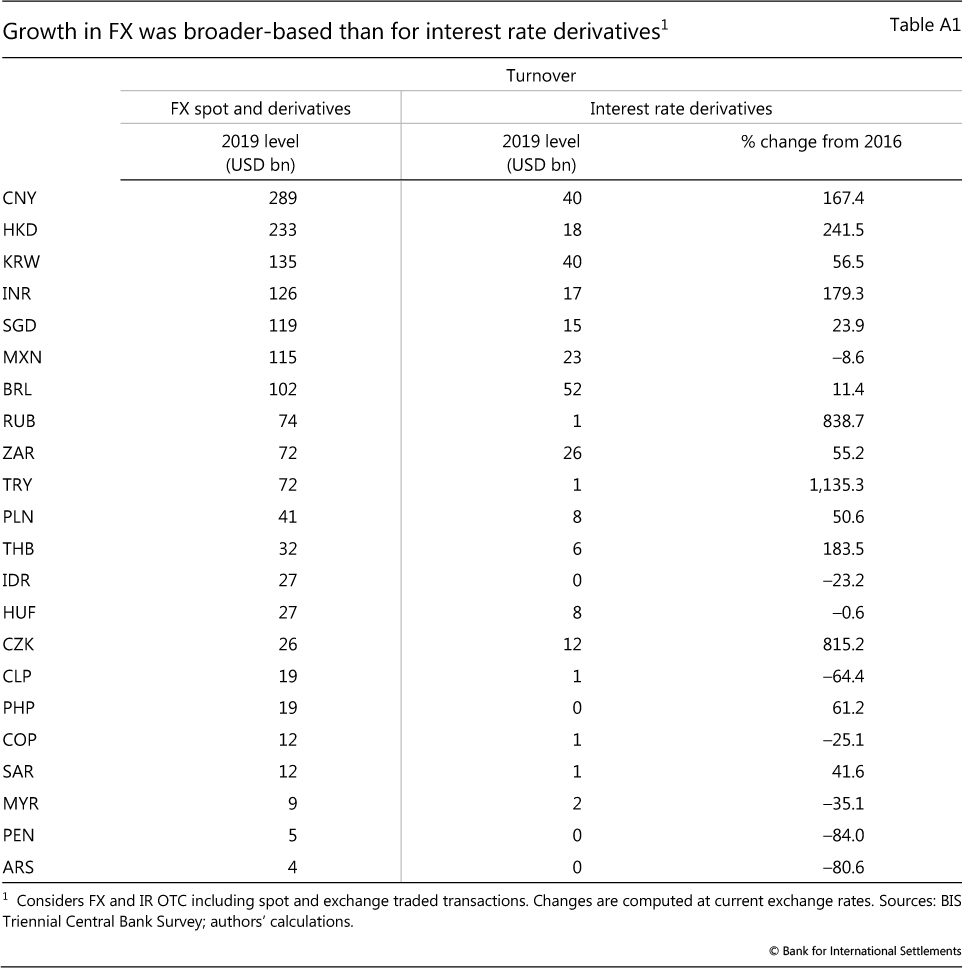
The relative size of FX and interest rate derivatives markets differs markedly between EMEs and AEs. The turnover of interest rate derivatives in EMEs rose significantly between April 2016 and April 2019, increasing from $173 billion to $273 billion (Graph A1, left-hand panel). Nevertheless, in April 2019, the turnover of FX derivatives denominated in EME currencies was still more than four times greater than that of interest rate derivatives. This was in stark contrast to AE currencies, where trading in the two asset classes was on a more equal footing. In the right-hand panel of Graph A1, the red line suggests that the ratio of interest rate to FX derivatives turnover is much smaller than one for EME currencies on average, indicating that FX instruments predominate in EME derivatives markets. In comparison, the blue line, for AEs, revealed more activity in interest rate derivatives than in FX derivatives.
The notional amounts outstanding painted a similar picture. For EME currencies, FX and interest rate derivatives markets were similar in size, whereas for AE currencies interest rate derivatives volumes exceeded those of FX derivatives by a large margin (see Aramonte and Huang (2019) in this issue).
The smaller scale of interest rate derivatives activity in EMEs, as compared with AEs, reflected several factors. Less-developed bond markets and benchmark rates in EMEs meant more limited demand for interest rate derivatives. In addition, tighter control of capital markets in EMEs further curbed demand, by restricting the investor base. The EMEs that stood out in terms of interest rate derivatives activity were Mexico and South Africa, which have better developed bond markets than most other EMEs, as well as freely convertible currencies.
Changes in the turnover of interest rate derivatives varied considerably across currencies (Annex Table A1, second and third columns). Most Asian currencies witnessed significant increases. In particular, renminbi interest rate derivatives increased more than threefold, overtaking the Mexican peso as the most actively traded EME instrument in this category. On the other side of the spectrum, interest rate derivatives trading declined in several Latin American currencies (Argentine peso, Chilean peso, Colombian peso and Peruvian sol).
See Ehlers and Hardy (2019) in this issue for an overview of recent trends in global interest rate derivatives markets.
Evolving market structure
Two notable trends have characterised the FX market for EME currencies in recent years; first, the increased presence of non-bank financial institutions; second, the rapid growth in forwards, in particular NDFs, and the related increased role of offshore transactions.
Rising prominence of non-bank financial institutions
In general, the growth of FX trading is linked more strongly to financial motivations than to trade in goods and services. In the right-hand panel of Graph 1, the orange line shows a positive relationship across EMEs between the growth in gross external financial assets and FX turnover. By contrast, the black line shows that the relationship between trade in goods and services and FX turnover was much weaker.6 These results accord with the dominant role of financial factors in driving activity in FX markets, as documented elsewhere (eg Schrimpf and Sushko (2019a) in this issue).
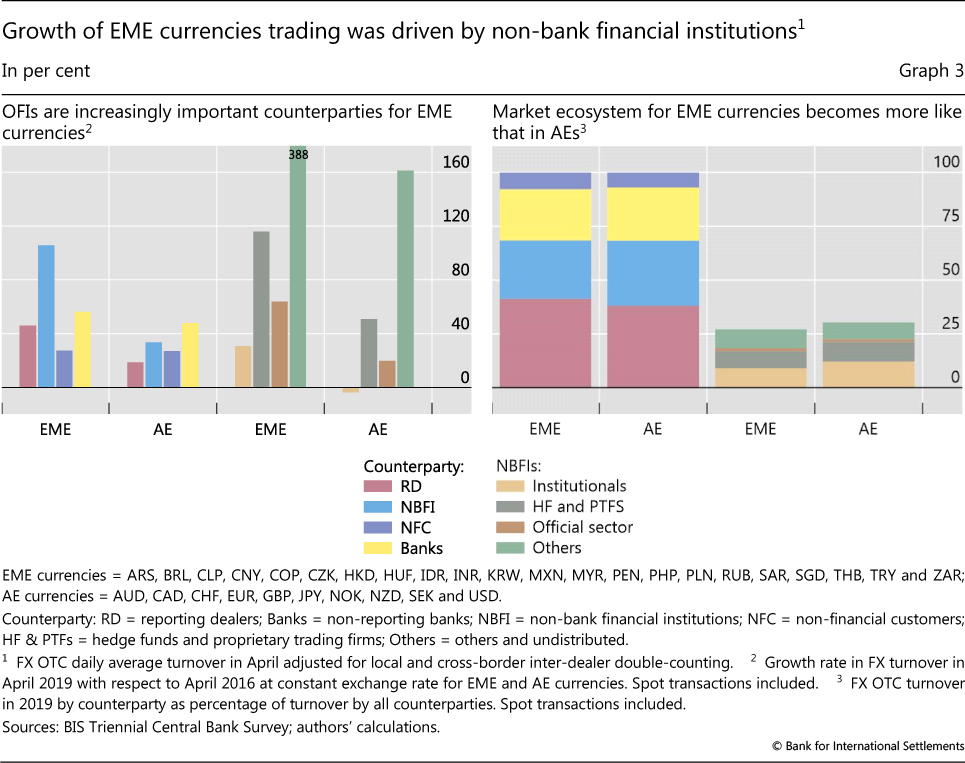
Consistent with the dominant role of financial factors, the recent growth in FX turnover for EME currencies was led by trading with non-bank financial institutions (NBFIs). This contrasts with AE currencies, where smaller (non-dealer) banks played the leading role (Graph 3, left-hand panel). Among NBFIs, the rise of "other" financial institutions (those not categorised as institutional investors, hedge funds, property trading firms or the official sector) was especially pronounced. This category includes retail aggregators.
These developments brought the composition of market participants more into line with that of AE currencies (Graph 3, right-hand panel). However some differences remained. For example, despite growing at a faster rate over the past three years, the share of institutional investors continued to be smaller in EME currencies than in AE currencies.
The rising share of NBFIs reflects increased non-bank and foreign demand for EME assets as financial intermediation shifts from banks to capital markets in EMEs. For example, the participation of foreign investors in local currency bond markets in EMEs has increased (BIS (2019)). Assets under management by dedicated EME equity and bond funds have doubled over the past decade (Graph 4, left-hand panel). In contrast, bank demand for EME assets has moderated. The share of banks in the Malaysian government bond market, for example, has fallen markedly over the last three years (Graph 4, centre panel).
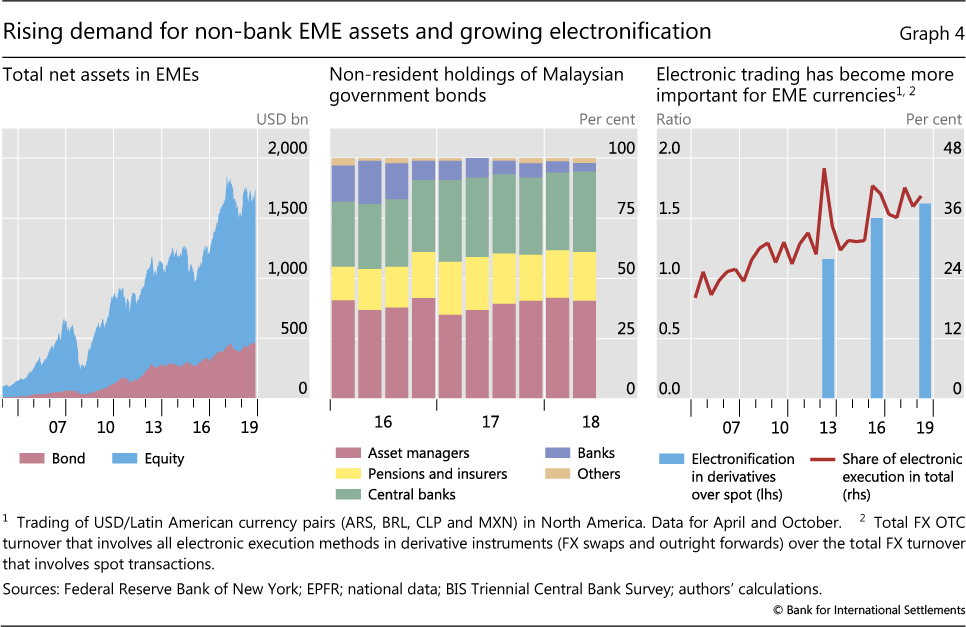
Hedge funds and PTFs, which are active in algorithmic trading, also saw swifter increases, as compared with their activity in AE currencies. This rise is attributable in large part to the continuing electronification of global FX markets (see Holden et al (2019) in this issue). As shown by the blue bars in the right-hand panel of Graph 4, electronic trading of EME currencies grew at a faster pace in derivatives than in the spot market.
Rapid growth in forwards and offshore trading
Outright forwards saw the sharpest increase in turnover in FX markets for EME currencies, followed by FX swaps and options (Graph 5, left-hand panel). On the other hand, turnover in currency swaps declined. This pattern was in sharp contrast to that seen in AE currencies, where currency swaps increased more than other instruments. As a result, the differences between EME and AE currencies in terms of forwards vis-à-vis FX swaps became more pronounced (Graph 5, centre panel).
NDFs contributed most to the increase in outright forwards. Driven in large part by increased market electronification, NDF turnover almost doubled (see Box B). Historically, NDFs have been used to meet hedging demands involving currencies that are not fully convertible because they allow for payoffs related to a currency's performance without requiring funding in the underlying currency. This trend continued for some currencies, even where controls on non-residents participating in onshore markets were relaxed.
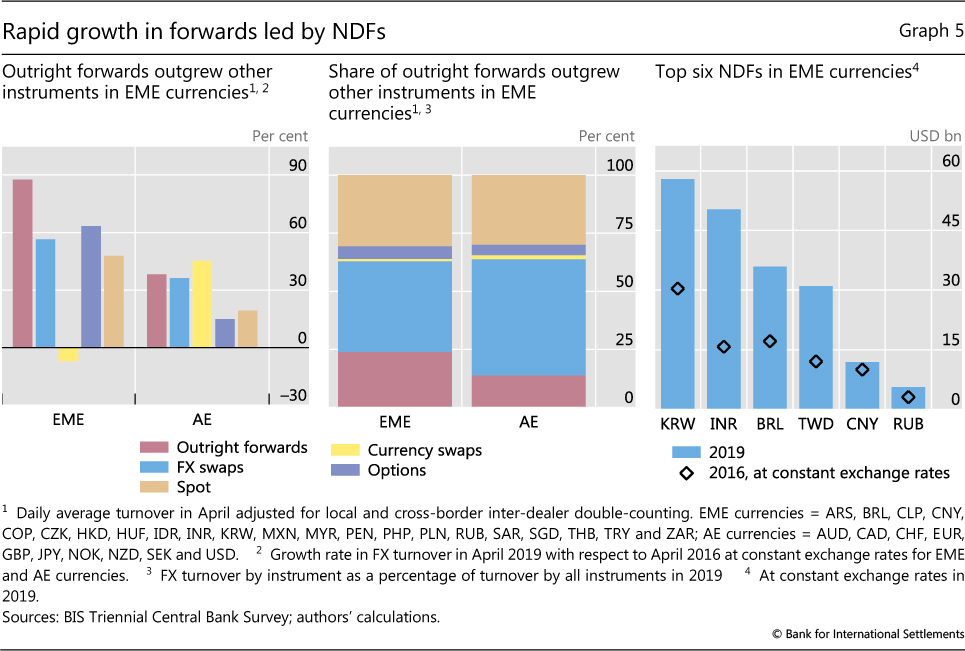
The increase in NDF turnover was broad-based; most of the top six most traded NDFs in EME currencies saw a marked increase (Graph 5, right-hand panel). The renminbi saw more modest growth, of less than 20%, probably reflecting authorities' initiatives to encourage hedging in the onshore deliverable forwards market.
Led by the robust growth in NDFs, the share of offshore trading in FX turnover increased for most EME currencies (Graph 6, left-hand panel). In April 2019, the volume of offshore trading in EME currencies exceeded that of onshore trading in all major regions. Latin American currencies had the highest share of offshore trading. In contrast, the offshore/onshore ratio for Asian EME currencies has stalled since 2016, due largely to a sizeable shift to onshore trading of the renminbi.7
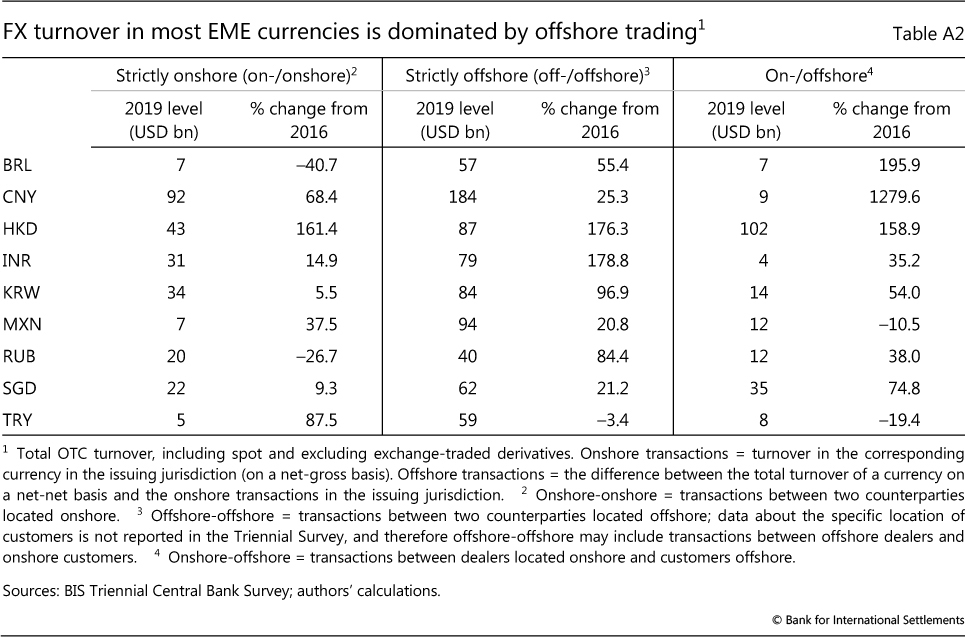
Strictly offshore trades (where both counterparties are located offshore) dominate the market for FX turnover in EME currencies (Graph 6, centre panel). By the location of a trade, defined as the location of the sales desk of the reporting dealer, a trade can be classified as either "strictly domestic" (between two parties located onshore), "onshore-offshore" (between one party located onshore and the other offshore) or "strictly offshore" (both parties located offshore).
The rapid expansion of strictly offshore trading was broad-based (Annex Table A2).8 Except for the Hong Kong dollar and the Malaysian ringgit, all other EME currencies were traded mainly between two parties located outside the domestic jurisdiction as of April 2019.
The vast majority of offshore FX transactions in EME currencies took place in a handful of locations. London played the most notable role, followed by New York, Singapore and Hong Kong SAR.
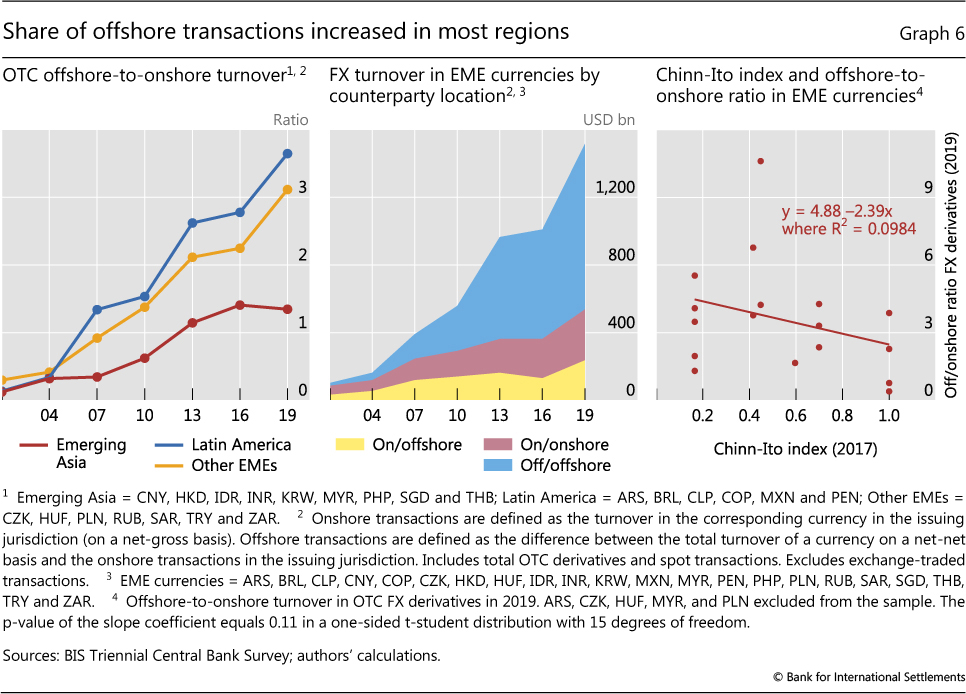
The prominence of offshore trading is not specific to EME currencies. It reflects the network effects that have led to a highly concentrated market structure within a handful of global financial centres. For EME currencies, capital account and currency convertibility restrictions represent an additional factor behind the higher share of offshore trading. In particular, jurisdictions with heavier capital account restrictions tend to have a higher share of offshore trading of derivatives (Graph 6, right-hand panel). In other words, capital controls appeared to boost the offshore trading of derivatives - NDFs in particular - at the expense of onshore trading.
Box B
NDF markets thrive on the back of electronification
Andreas Schrimpf and Vladyslav Sushko
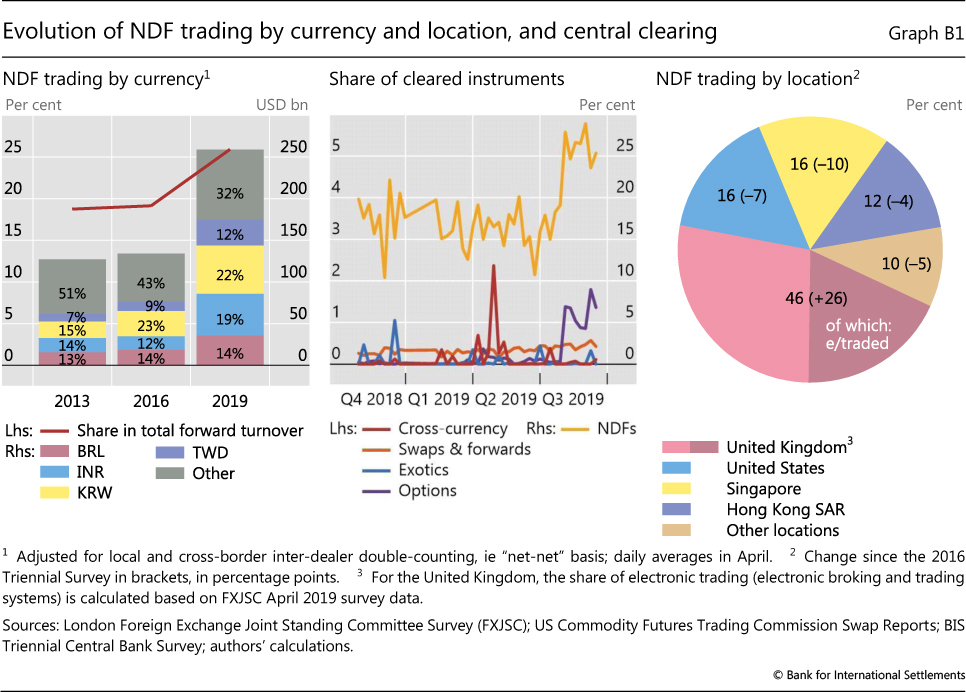
Trading of NDFs has almost doubled over the past three years, contributing significantly to the substantial increase in the trading of forwards recorded in the 2019 Triennial Survey. NDFs are contracts that, unlike their deliverable counterparts, settle in the same currency (typically the US dollar) at maturity, based on the movement of the underlying exchange rate. NDFs are particularly popular for trading non-convertible currencies. The key currencies behind the NDF surge include the Korean won, Brazilian real, Indian rupee and New Taiwan dollar (Graph B1, left-hand panel).
Hedge funds and PTFs can trade NDFs to arbitrage or take directional bets. In the process, they serve as natural counterparties to market participants who need to hedge currency exposures. NDFs exemplify two main trends in the structure of global FX markets, as highlighted in the main text: (i) electronification of trading with other financial institutions, and (ii) concentration of trading activity in the largest FX centres.
The trend towards electronification in NDF markets rides on the inclusion of these instruments among those traded on the main electronic broking platforms: EBS emerged as the electronic venue for NDF trading, while Reuters (Refinitiv) Matching plans to launch NDF trading in 2020. Electronification has also benefited from central clearing, which enables multilateral netting and reduces the need to post margins. As highlighted in McCauley and Shu (2016), the NDF market microstructure has started evolving rapidly on the back of global legal and regulatory reforms for derivatives markets. Since 2015, NDFs have started the transition from a decentralised, bilateral microstructure to one characterised by centralised trading, disclosure and clearing. The gradual phase-in of uncleared margin rules, requiring firms to post initial margins for certain uncleared derivatives, has incentivised greater central clearing of NDFs. To date, NDFs represent the only type of FX derivative with any meaningful share of centrally cleared transactions (Graph B1, centre panel).
These forces have naturally led to a further concentration of trading in the main FX hubs, with the share of NDF trading in the United Kingdom more than doubling from 20% in 2016 to 46% in 2019 (Graph B1, right-hand panel). Given the popularity of NDF trading in Asian currencies, London's overlap with the trading hours of Hong Kong SAR and Singapore puts the city in an advantageous position.
Policy implications
The rapid expansion of offshore trading in EME currencies presents both opportunities and challenges. On the one hand, offshore trading can increase liquidity and cut transaction costs. Electronification can encourage trading by a wider range of market participants, while overlapping time zones allow round-the-clock trading. Increased FX liquidity can in turn boost foreign investment and trade in goods and services.
On the other hand, offshore trading can influence the price discovery process for exchange rates, in markets that are more difficult than onshore centres for central banks to monitor. Estimates for the four largest NDF currencies suggest that, while a bidirectional relationship exists between the onshore and offshore markets during normal times, offshore venues tend to drive movements in the onshore markets during times of global market stress (Box C). This raises challenges for central banks, which have historically limited their market monitoring and intervention policies to the onshore market.
Many central banks have responded to the challenges posed by offshore markets by expanding their monitoring activities. They can expand their coverage of fast-paced electronic markets by tapping larger volumes of data from more diverse sources. They can also enhance the scope and coverage of their market intelligence-gathering efforts (Markets Committee (2016, 2018)). The Korean authorities, for instance, have encouraged domestic entities to play a greater role in offshore markets, with the aim of increasing their monitoring capabilities for offshore markets via these entities. The move has also served to integrate the on- and offshore markets, reducing price discrepancies between the two.
Other central banks, such as those in Indonesia, Malaysia and Turkey, have taken steps to deepen their nascent onshore derivatives markets, often acting as the primary providers of liquidity. Initiatives such as extending onshore trading hours and providing more flexibility for foreign investors to hedge their positions in the domestic markets have also been considered (Reserve Bank of India (2019)).
Furthermore, while spot interventions still remain the dominant intervention tool, some central banks have reacted to the increasing weight of offshore derivatives in the FX market by increasing the use of derivatives in their FX intervention frameworks, including in offshore markets (BIS (2019)).
Box C
How onshore and offshore markets interact: an empirical investigation
Understanding the information flow between onshore and offshore markets is of prime importance, particularly for policymakers. It sheds light on the price formation process and reveals the venue of price discovery, which is critical for informing a central bank's FX intervention strategy and market monitoring efforts.
Policymakers often see spillovers from hard-to-monitor offshore markets as an area of concern (Central Bank of Malaysia (2018)). Indeed, the empirical analysis below shows that, while a bidirectional relationship exists between the onshore and offshore markets during normal times, it turns unidirectional during times of market stress, when offshore markets tend to drive onshore price developments.
In the absence of permanent frictions between the onshore and offshore markets, prices across venues are cointegrated, as confirmed by our empirical estimates. Short-run fluctuations and lead-lag relationships can then be studied using a vector error correction model for onshore spot and forward rates and offshore non-deliverable forward (NDF) rates. This represents the information flow between the onshore and offshore markets, and shows how it varies over time. The model consists of two sets of equations, the first of which captures the long-run relationship between spot and NDF rates. The second set examines how deviations from the long-term relationship affect the short-term dynamics of these rates, an "error correction" mechanism in the spirit of Engel and Granger (1987). This provides information about the direction of the linkage between onshore and offshore markets. The analysis focuses on five currencies with large NDF markets, namely the Brazilian real, Chinese renminbi, Indian rupee, Korean won and New Taiwan dollar.
The long-run equations are as follows:
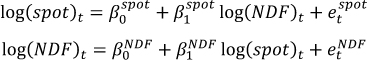
β1spot and β1NDF quantify the strength of the long-run relationship between the two exchange rate measures, with a value close to 1 indicating a complete pass-through and the absence of permanent frictions between the two markets.
The short-run equations are as follows:
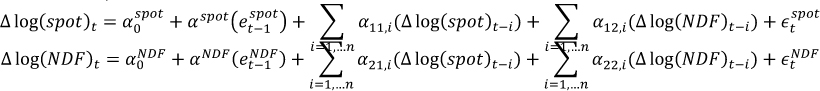
αspot and αndf are the coefficients of interest. They reveal the rate of adjustment when the system departs from equilibrium. We use them as a measure of the direction of influence. For example, when αspot is negative and statistically significant, it indicates that NDF rates will affect the dynamics of spot rates in the next period.
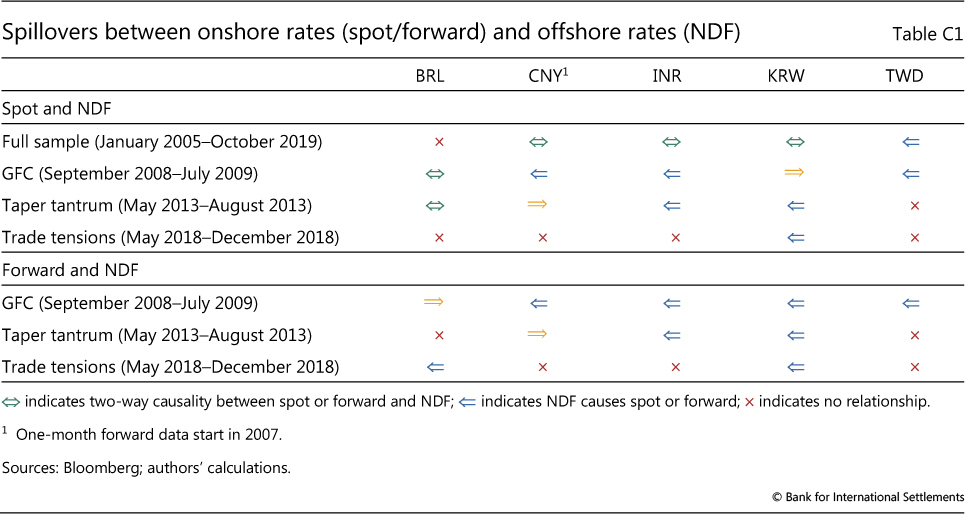
The analysis reveals, first, that most currencies show a bidirectional relationship: spot prices affect subsequent NDF rates and vice versa. For the Chinese renminbi, Indian rupee and Korean won, this bidirectional relationship holds when the model is estimated over the full sample from January 2005 to October 2019 (Table C1, first row). The New Taiwan dollar stands out as the only currency with unidirectional spillovers from the NDF rates to spot rates. This could reflect the fact that offshore branches of local banks are allowed to participate in the NDF market, which brings additional information to the NDF rates.
 Unlike the other currencies in the sample, the Brazilian real shows no significant evidence of spillovers from one market to the other. This may reflect the important role that exchange trading plays for the Brazilian real, with price discovery taking place largely in the futures market rather than in the offshore NDF or spot market.
Second, during times of global market stress, it is more likely that the offshore NDF markets will drive onshore prices (Table C1, second to fourth rows). For example, during the Great Financial Crisis (GFC) and the "taper tantrum", the Indian rupee saw spillovers from the NDF rates to the spot rates but not vice versa. Similar dynamics were also observed for the renminbi and New Taiwan dollar during the GFC, and for the Korean won during the taper tantrum and recent trade tensions. The pattern also manifests itself between the offshore NDF rates and the onshore forward rates (fifth to seventh rows).
The unidirectional influence from offshore to onshore markets during global market stress for Asian currencies likely reflects a number of factors. For one, the onshore and offshore markets span different time zones. As a result, news related to Europe and the United States that arrives during prime trading hours in London and New York is too late for Asian trading hours. Thus, this news affects NDF rates first, before subsequently affecting the onshore prices the following morning. However, this is probably not the only reason, as the case of the Indian rupee shows. Here Reserve Bank of India (2019) finds the unidirectional flow to hold during market stress episodes, even though the NDF and spot prices are recorded at exactly the same time (the closing time of the onshore market). Other factors, such as different degrees of risk aversion and changes in the wealth of offshore investors during global market stress episodes, could contribute to the unidirectional influence.
In a few cases, spot rates have led the NDF rates during global stress episodes. One example is the Korean won during the GFC. This likely reflects the central bank's interventions in the onshore markets, which then become the primary venue of price discovery.
The finding that offshore centres tend to lead price discovery during times of stress presents central banks with both opportunities and challenges. The challenge lies in the fact that interventions are primarily restricted to the onshore spot markets, whereas the venues for price discovery during times of stress tend to be the offshore derivatives markets (Cavalino and Patel (2019)). However, the results also indicate that proactive interventions at such times could nevertheless help to counter trends originating in the offshore markets.
The approach is similar to the one used in Reserve Bank of India (2019). See also Behera (2011). These results are consistent with prior studies, including McCauley et al (2014). See Annex A in Tsuyuguchi and Wooldridge (2008). For details of price discovery in Brazilian FX markets, see Garcia and Santos (2014). See Garcia and Santos (2014) for how central bank interventions relate to the price discovery process. See Ryoo et al (2013) for the role of the Bank of Korea's interventions during the GFC.
References
Aramonte, S and W Huang (2019): "OTC derivatives: euro exposures rise and central clearing advances", BIS Quarterly Review, December, pp 83-93.
Bank for International Settlements (2019): Annual Economic Report, Chapter II, "Monetary policy frameworks in EMEs: inflation targeting, the exchange rate and financial stability".
Behera, H (2011): "Onshore and offshore market for Indian rupee: recent evidence on volatility and shock spillover", in Macroeconomics and Finance in Emerging Market Economies, vol 4, no 1.
Cavalino, P and N Patel (2019): "FX intervention: goals, strategies and tactics", in BIS Papers, no 104, October, pp 25-44.
Central Bank of Malaysia (2018): Annual Report, "Monetary and financial conditions in 2018".
Ehlers, T and B Hardy (2019): "The evolution of OTC interest rate derivatives markets", BIS Quarterly Review, December, pp 69-82.
Engle, R and C Granger (1987): "Co-integration and error correction: representation, estimation, and testing", Econometrica, March, pp 251-76.
Garcia, M and F Santos (2014): "Price discovery in Brazilian FX markets", Textos para discussão, no 622, Department of Economics PUC-Rio (Brazil), May.
Markets Committee (2016): "Market intelligence gathering at central banks", Markets Committee Papers, no 8, December.
--- (2018): "Monitoring of fast-paced electronic markets", Markets Committee Papers, no 10, September.
McCauley, R and C Shu (2016): "Non-deliverable forwards: impact of currency internationalisation and derivatives reform", BIS Quarterly Review, December, pp 81-93.
McCauley, R, C Shu and G Ma (2014): "Non-deliverable forwards: 2013 and beyond", BIS Quarterly Review, March, pp 75-88.
Packer, F, A Schrimpf and V Sushko (2019): "Renminbi turnover tilts onshore", BIS Quarterly Review, December, pp 35-6.
Reserve Bank of India (2019): Report of the task force on offshore rupee markets, July.
Ryoo, S, T Kwon and H Lee (2013): "Foreign exchange market developments and intervention in Korea", BIS Papers, no 73, October, pp 205-13.
Schrimpf, A and V Sushko (2019a): "Sizing up global foreign exchange markets", BIS Quarterly Review, December, pp 21-38.
--- (2019b): "FX trade execution: complex and highly fragmented", BIS Quarterly Review, December, pp 39-51.
Tsuyuguchi, Y and P Wooldridge (2008): "The evolution of trading activity in Asian foreign exchange markets", BIS Working Papers, no 252, May.
Wooldridge, P and D Xia (2019): "Derivatives trading in OTC markets soars", BIS Quarterly Review, September, pp 32-3.
Annex tables
1 The authors would like to thank Claudio Borio, Michael Chui, Stijn Claessens, Mathias Drehmann, Bryan Hardy, Robert McCauley, Benoît Mojon, Denis Pêtre, Andreas Schrimpf, Hyun Song Shin, Vladyslav Sushko, Christian Upper and Philip Wooldridge for helpful comments and Samuel Carrasco for excellent research assistance and comments. The views expressed here are those of the authors and do not necessarily reflect those of the Bank for International Settlements.
2 For information about the Triennial Survey, see www.bis.org/statistics/rpfx19.htm.
3 NDFs are forward contracts that do not involve an actual exchange of currencies. Instead, they entail a settlement of the difference between the actual and a pre-agreed exchange rate in a single US dollar payment at maturity.
4 The ratio understates spot trading because, in the Triennial Survey, the spot leg of FX swaps is not reported. This bias is more sizeable for AE currencies, given their larger share of FX swaps trading.
5 The dominant share of OTC markets is partly explained by the greater flexibility that OTC deals offer to meet special demands, such as for specific maturities and trading currency pairs not involving the US dollar (Wooldridge and Xia (2019)). While the US dollar remained dominant, as the currency on one side of 99% of all trades on exchanges in April 2019, its share in OTC markets was lower, at 90%.
6 Interestingly, growth in gross external financial liabilities plays a less significant role, probably reflecting that EME liabilities consist mainly of equity and foreign direct investments, which generate less turnover owing to both their longer term and lower hedging requirements.
7 The ratio for EM Asia excluding China continued to increase between 2016 and 2019.
8 The Triennial Survey might overstate "strictly offshore" trading. Dealers report whether a trade is local, with a resident counterparty, or cross-border, with a non-resident. Therefore, trades between dealers located offshore and customers located onshore are included with offshore trades.