Renminbi turnover tilts onshore
The average daily turnover of the Chinese renminbi (RMB) surpassed $280 billion per day in April 2019, yet it remained only the world's eighth most traded currency (Graph B1, left-hand panel). The share of RMB in global FX trading rose by less than between previous Triennial Surveys, to 4.3% in 2019, because of subdued growth in offshore RMB (CNH) trading. RMB turnover remains lower than expected based on real economy indicators, such as trade volume and GDP per capita (centre panel). The deviation can be explained by financial drivers, such as restrictions on financial capital flows. For the first time in over a decade, the relative importance of onshore RMB trading on platforms such as CFETS increased, while the share of CNH turnover declined, from 73% in 2016 to 64% in 2019 (right-hand panel).
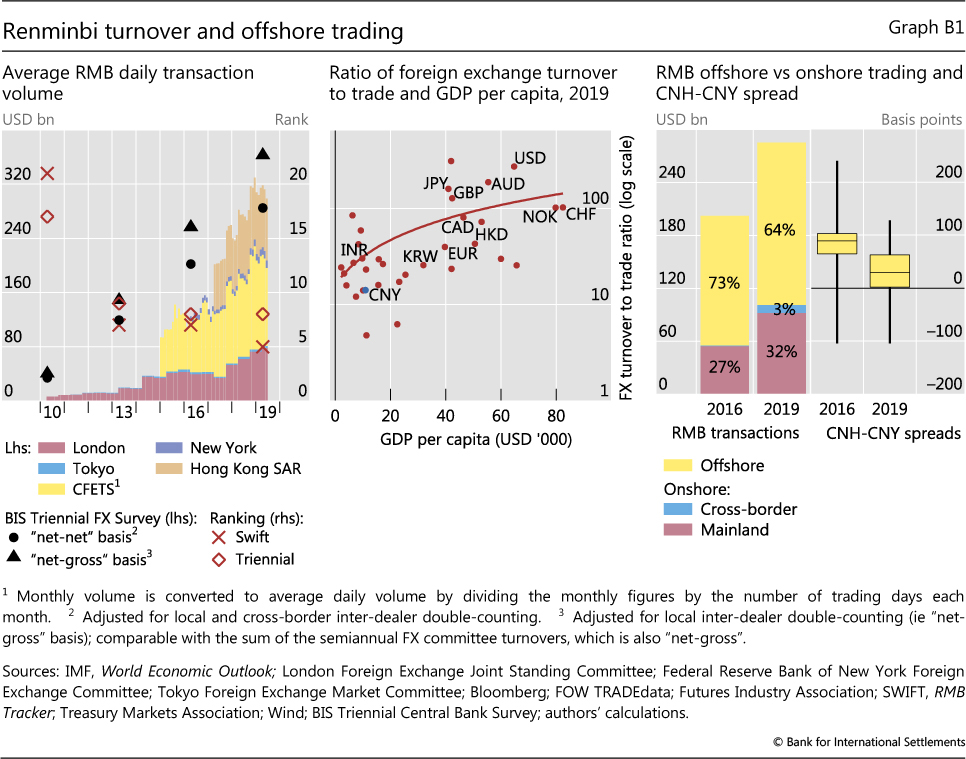
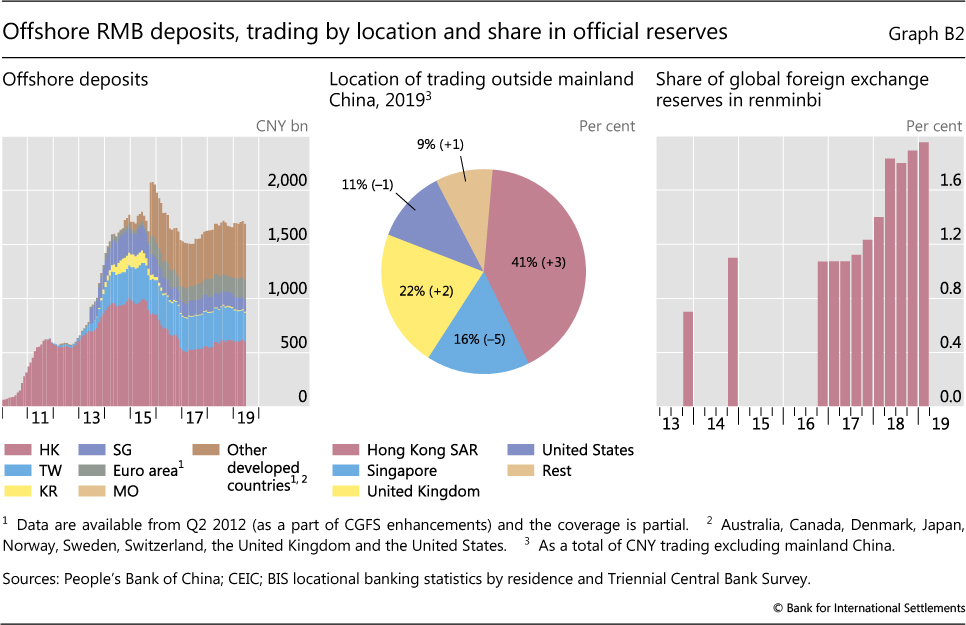
The offshore share of RMB activity declined for a few reasons. First, several liquidity squeezes in the CNH market in 2016-17 deterred speculative activity. CNH-CNY spreads were lower in 2019 than in 2016 (Graph B1, right-hand panel). Second, returns on offshore deposits were low, making them less attractive than those in other currencies and weighing on their growth (Graph B2, left-hand panel). Third, tighter controls by the mainland authorities reduced issuance of RMB bonds offshore (dim sum bonds) by Chinese corporates. The total stock of dim sum bonds declined between late 2016 and mid-2019, which had a negative impact on CNH liquidity. Fourth, Chinese authorities began to offer more direct ways for foreign investors to access onshore RMB markets. They opened more channels, such as Stock Connect, Bond Connect and CFETS Connect, and increased the quota for foreign institutional investors. These initiatives resulted in net investment flows from Hong Kong SAR to the mainland in excess of RMB 350 billion between Q2 2018 and Q1 2019.
Over the past three years, offshore RMB activity saw an important shift in terms of location of trading, with the shares of Hong Kong and London rising to 41% and 22%, respectively (Graph B2, centre panel). As hedge fund interest in CNH has waned, due to the factors listed above, offshore trading in RMB has favoured banking and clearing centres with direct onshore links, most notably in Hong Kong. Hence, in April RMB ranked fifth in SWIFT (Graph B1, left-hand panel), which captures bank-to-bank payment flows. London has also continued to increase its status as a leading offshore hub for RMB, having displaced Singapore as the largest trading centre for RMB outside greater China.
In contrast with the decelerating growth in overall RMB turnover, central bank reserves held in RMB rose significantly in recent years, with official institutions accounting for 51% of total turnover by foreign institutional investors by Q3 2018. RMB turnover involving official sector counterparties grew from a daily average of $1.1 billion to $2.0 billion over the last three years. At the same time, the RMB's share in total FX reserves almost doubled from 1% in 2016 to nearly 2% in 2019, equivalent to about $200 billion (Graph B2, right-hand panel), further evidence of the increased attention of the public sector to investment opportunities in RMB. RMB reserve allocations have benefited from the authorities' stepwise process of opening up onshore markets, as well as relatively high returns compared with other fixed income instruments and good diversification properties relative to other reserve currencies.
CNH is used to refer to offshore RMB activity, CNY onshore activity. In addition to intervention in the market, the People's Bank of China also imposed a reserve requirement on the offshore renminbi in 2016. See eg Ehlers et al (2016). Citi Research (2019). This is consistent with the prediction of Cheung et al (2019). Rigaudy (2019).