Non-deliverable forwards: impact of currency internationalisation and derivatives reform
Global turnover in non-deliverable forwards (NDFs) continues to rise in aggregate. But the paths of NDF markets have diverged across currencies: renminbi internationalisation has led to rapid displacement of NDFs by deliverable forwards, while the NDF market has retained or even gained in importance in other emerging market economy currencies. Policy reforms to reduce systemic risk in derivatives markets are changing the microstructure of the NDF market.1
JEL classification: F31, G15, G18.
The 2016 BIS Triennial Central Bank Survey of Foreign Exchange and Derivatives Market Activity ("the Triennial") gathered, for a second time, global data on non-deliverable forwards (NDFs), shedding light on an active, yet little studied, segment of foreign exchange (FX) markets. NDFs are contracts for the difference between an agreed exchange rate and the actual spot rate at maturity, settled with a single payment for one counterparty's profit. They allow hedging and speculation in a currency without providing or requiring funding in it. Investors thereby circumvent limits on home market ("onshore") trading and on delivery of the home currency offshore.
The Triennial Survey shows that NDF turnover grew by 5.3% in dollar terms between April 2013 and April 2016. This growth is remarkable in that three currencies with large NDF markets - the Brazilian real (BRL), the Indian rupee (INR) and the Russian rouble (RUB) - depreciated notably vis-à-vis the US dollar during the period. It is also remarkable given the sharp drop in turnover in the renminbi (CNY) NDF.
Divergent trends in NDF trading among the six emerging market economy (EME) currencies identified in the Triennial highlight three distinct paths of FX market development. In a path exemplified by the Korean won (KRW), NDFs gained in importance in a policy regime with restrictions on offshore deliverability. In a second, represented by the liberalised rouble, the NDF maintained its minor role amid financial sanctions and policy uncertainty. China has taken a unique, third path of currency internationalisation within capital controls. For the renminbi, deliverable forwards (DFs) have been displacing NDFs offshore.
The microstructure of NDF trading is evolving under the global force of legal and regulatory reforms of derivatives markets. NDFs have started the transition from a decentralised, bilateral microstructure to centralised trading, disclosure and clearing. Disclosure of derivatives transactions (including NDFs) has become mandatory in many jurisdictions (CPMI-IOSCO (2015), FSB (2016)). Centralised NDF clearing took off in September 2016 when US, Japanese and Canadian banks began to post higher required margins for uncleared derivatives. A shift to centralised trading is also evident.
Reform allows us to assess NDF turnover spillovers from surprises like the adjustment in the renminbi exchange rate regime in August 2015. We supplement data from the Triennial and a similar survey for FX trading in London with higher-frequency data from central banks, a clearing house (LCH) and a trading registration system (the Depository Trust & Clearing Corporation (DTCC)). With this combination of sources, we find that, ironically, liberalisation of the renminbi is boosting other Asian NDFs even as it strangles the CNY NDF.
This analysis should interest policymakers concerned about spillovers from an offshore NDF market to the onshore market. In addition, for observers of capital account liberalisation, the diversity in policy choices and NDF market developments offer a natural experiment on paths of currency internationalisation. Finally, this analysis helps policymakers to assess progress in derivatives reforms.
This article is in three parts. Developments in NDF turnover, counterparties and location during 2013-16 are discussed first. The second part maps paths for NDF market development, drawing implications for currency internationalisation. The third assesses changing NDF trading, disclosure and trading, given derivatives reforms.
NDF developments in 2013-16
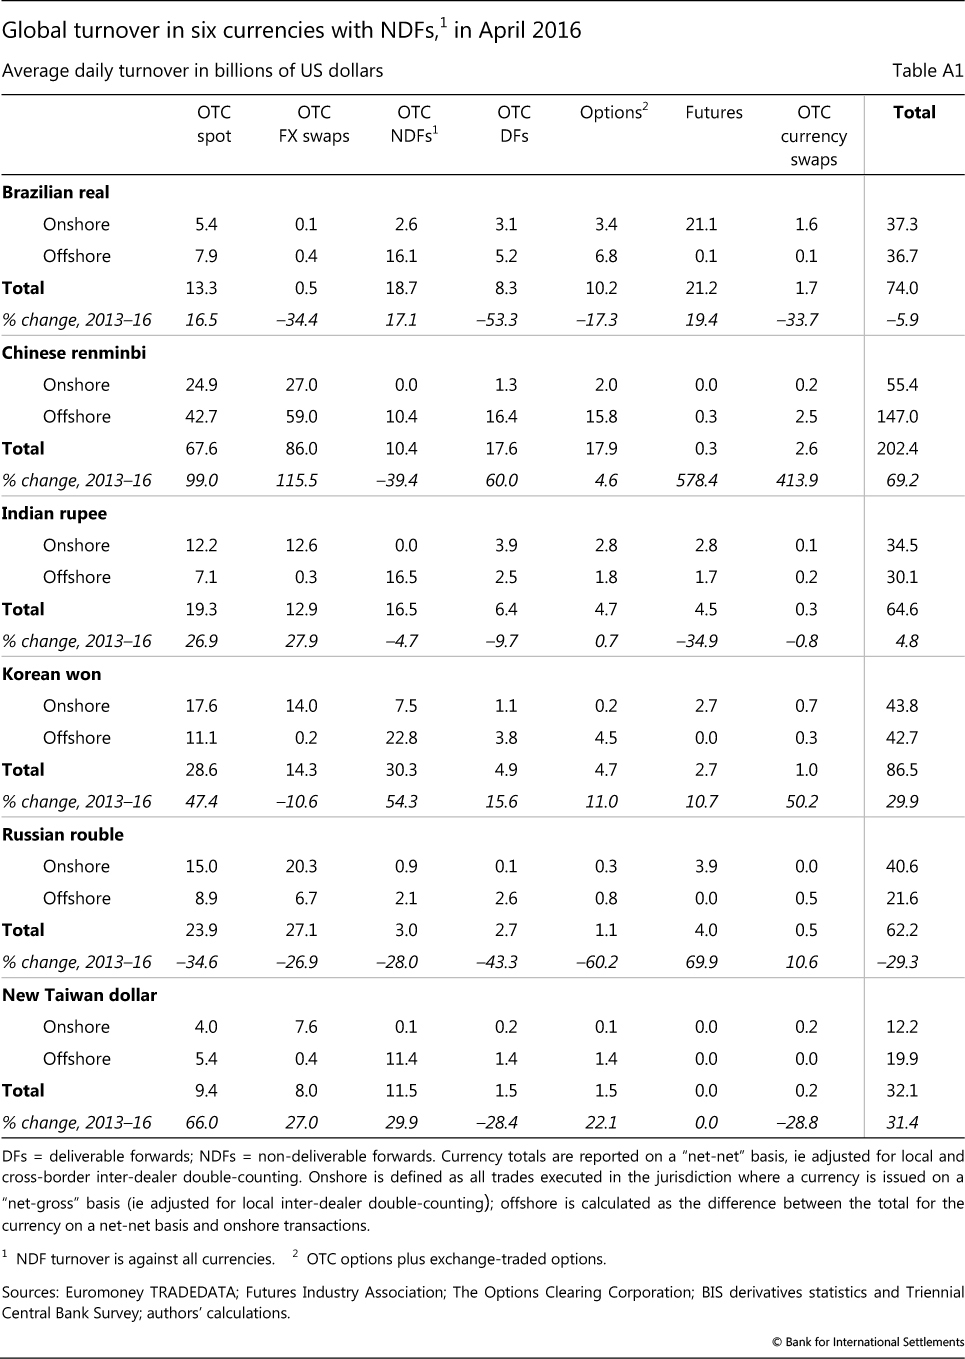
According to the 2016 Triennial, global NDF turnover amounted to $134 billion in April 2016, up 5.3% since April 2013 (Table 1). Expansion of the NDF market is consistent with the overall growth of markets for EME currencies (BIS (2016a)). The NDF share in the categories reported to the Triennial has stayed broadly stable over the last three years: NDFs continue to represent about a fifth (19%) of outright forward trading, and about a 40th (2.6%) of overall FX trading. The Triennial did not collect data on non-deliverable options and currency swaps, which might have grown faster. NDFs written against the US dollar accounted for 97% of the total, an even higher share than for EME FX generally.
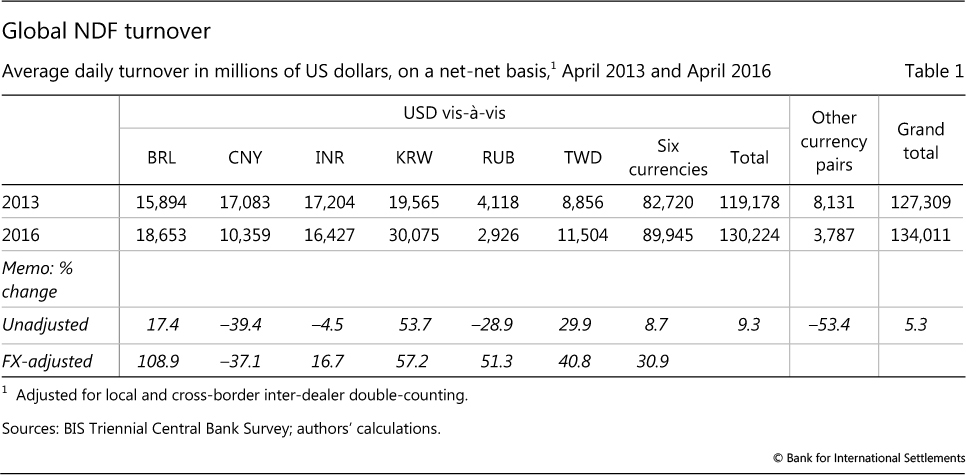
In the six currencies singled out by the Triennial, which account for two thirds of all NDFs, turnover increased at a faster pace, by 8.7%. Growth was much stronger in exchange rate-adjusted terms (30.9%, Table 1) than in current dollar terms, owing to depreciation against the dollar of the real, rupee and rouble. Indeed, BRL NDF turnover would have doubled in the absence of BRL depreciation. By contrast, the substantial decline in CNY NDFs and the rapid growth of KRW and Taiwan dollar (TWD) turnover owed little to movements against the US dollar. Apart from the six surveyed currency pairs, NDF markets are active in a number of other currencies. The DTCC data (see below) show that the Indonesian rupiah, Malaysian ringgit, and Chilean and Colombian pesos also have sizeable NDF trading.
Apart from the renminbi, NDFs grew in line with turnover in EME currencies. As a hedging market, they grew along with the increased trading of swaps and forwards in the broader global FX market (Moore et al (2016)).
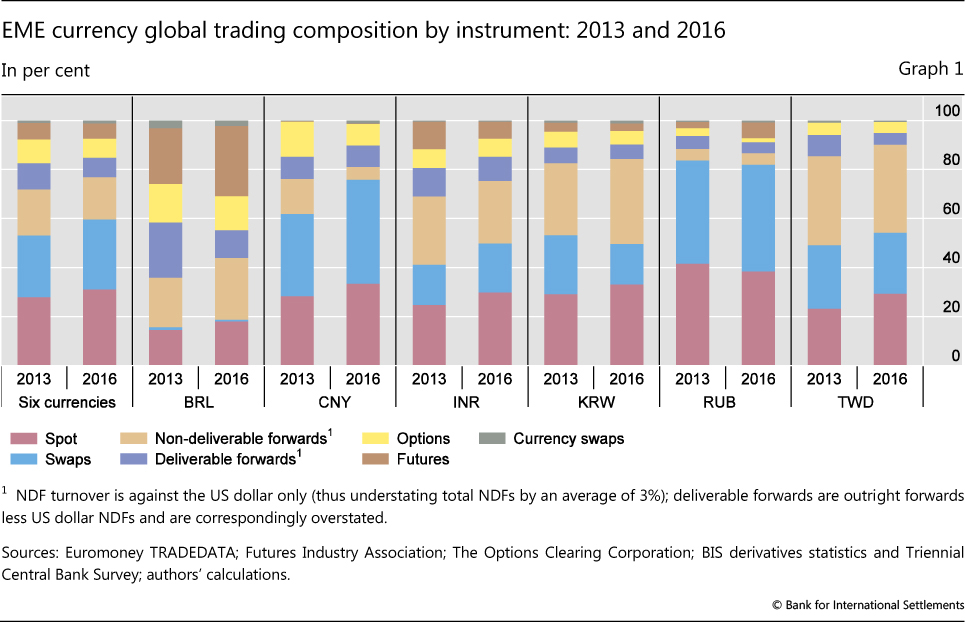
In aggregate, the share of NDFs in currency trading has declined relative to spot trading and swaps (Graph 1, two left-hand bars), but this is due entirely to the renminbi. Apart from it, NDFs actually gained share in BRL and KRW trading, and retained their share in the other three currency pairs. (These data on instruments combine data from the Triennial and futures exchanges. The Annex table gives the underlying dollar amounts and growth rates of the instrument breakdown.)
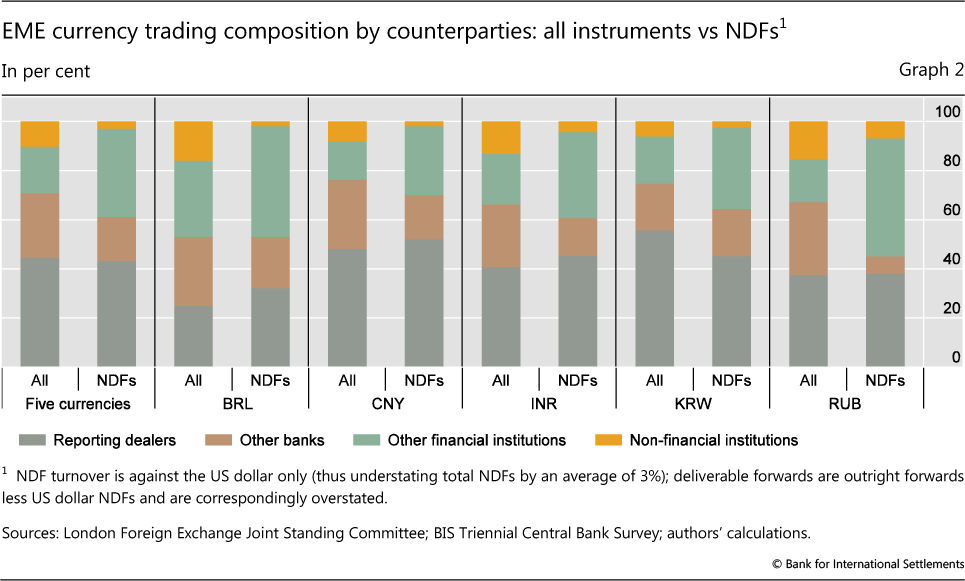
Compared with other FX instruments, NDF counterparties are skewed towards non-bank financial firms (Graph 2). This category includes not only institutional investors hedging their holdings but also leveraged accounts. The London Foreign Exchange Joint Standing Committee, a Bank of England-hosted group, reports more prime broker customers - mainly hedge funds and the like - for NDFs than for DFs, including FX swaps. The role of such traders may have contributed to the suspicion with which some policymakers are said to view NDFs (IGIDR Finance Research Group (2016); see also Ibrahim (2016)).
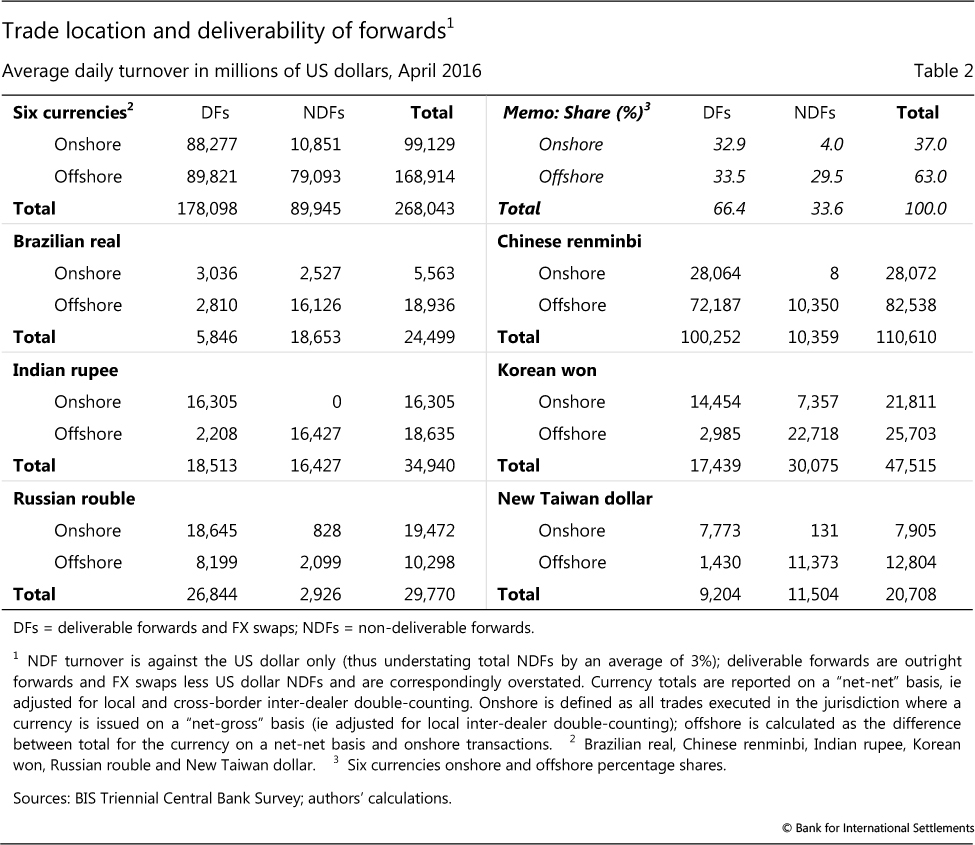
The NDF is a key instrument in EME currencies' offshore, but not onshore, trading (Graph 3; see Ehlers et al (2016) for an analysis of CNY on- and offshore trading). For a full picture of FX instrument composition, we again add exchange-traded turnover to the over-the-counter turnover collected in the Triennial. NDFs trade onshore to some extent in the real, won, rouble and New Taiwan dollar.2 Outside Brazil, the modal domestic trade is a swap, as in the global FX market.3 By contrast, NDFs are over 40% of offshore FX trades in the real, rupee, won and New Taiwan dollar.
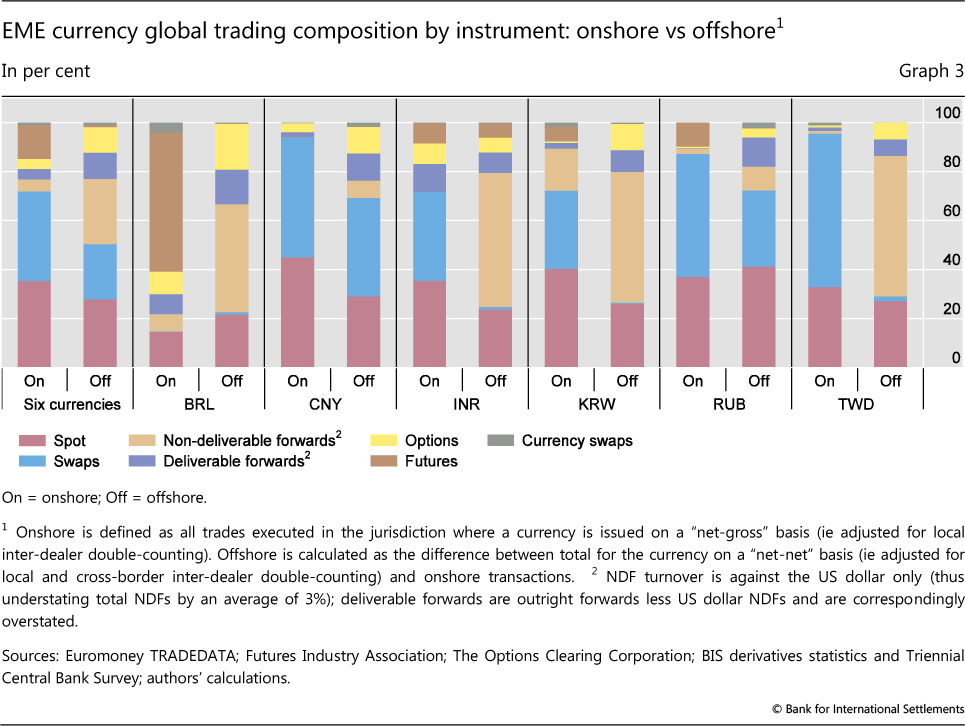
DFs (including FX swaps) tend to trade onshore and NDFs offshore. As shown in the top panels of Table 2, offshore NDFs account for 29.5% of total forward trading, higher than the 21.1% share that would hold if the deliverable/non-deliverable split were the same onshore and offshore. Similarly, DFs trade disproportionately onshore.4 The lower six panels of Table 2 show that the strength of the relationship, though uniformly highly significant in statistical terms, varies across the six currency pairs. Segmentation is strongest in the rupee, for which NDFs do not trade onshore at all and DFs trade predominantly onshore, followed by the New Taiwan dollar, won, renminbi, real and rouble. In India, the sense that onshore markets had lost market share led the Ministry of Finance to commission a group of experts (Standing Council on International Competitiveness of the Indian Financial System (2015)). Supporting the Standing Council in its investigation of markets, the Indira Gandhi Institute of Development Research Finance Research Group (2016, p 29) suggested that domestic banks in India be allowed to participate in the NDF market.
NDFs and paths of foreign exchange liberalisation
The divergent trends across currencies point to three stylised paths for the development of FX markets, from a starting point where restrictions on foreign participation in the domestic FX markets and offshore deliverability have fostered the emergence of an NDF market. One is a sudden liberalisation of FX trading and the capital account. The second is market development around an entrenched NDF market. And the third is a controlled opening up of the FX market within a regime that retains effective capital controls.
The rouble has followed the first path.5 It was made fully convertible in mid-2006 amid current account surpluses, large foreign exchange reserves and official ambitions for its international use. Among our six currencies, the rouble NDF has the smallest share among the different instruments used for RUB trading (Graph 1). Bloomberg stopped publishing a separate exchange rate series for the rouble NDF in 2014, citing its price convergence with the deliverable forwards.
Still, the rouble NDF has lingered for 10 years and even enjoyed a modest revival recently. One interpretation of the revival is that credit and legal concerns since 2014 have prolonged the life of the rouble NDF. In 2013, the concentration of liquidity in offshore markets (including the NDF) was ascribed to concerns about the enforceability of collateral arrangements in Russia (HSBC (2013)). In early 2014, a series of financial sanctions on certain Russian individuals, defence firms, energy firms and banks were reported to have led non-financial firms to use NDFs rather than DFs (Becker (2014)). In September 2014, sanctions were extended to Russia's largest bank. The share of NDFs in RUB forward trades in London bottomed out in October 2014, and has since risen slightly in the three subsequent semiannual London surveys (Graph 4, left-hand panel).
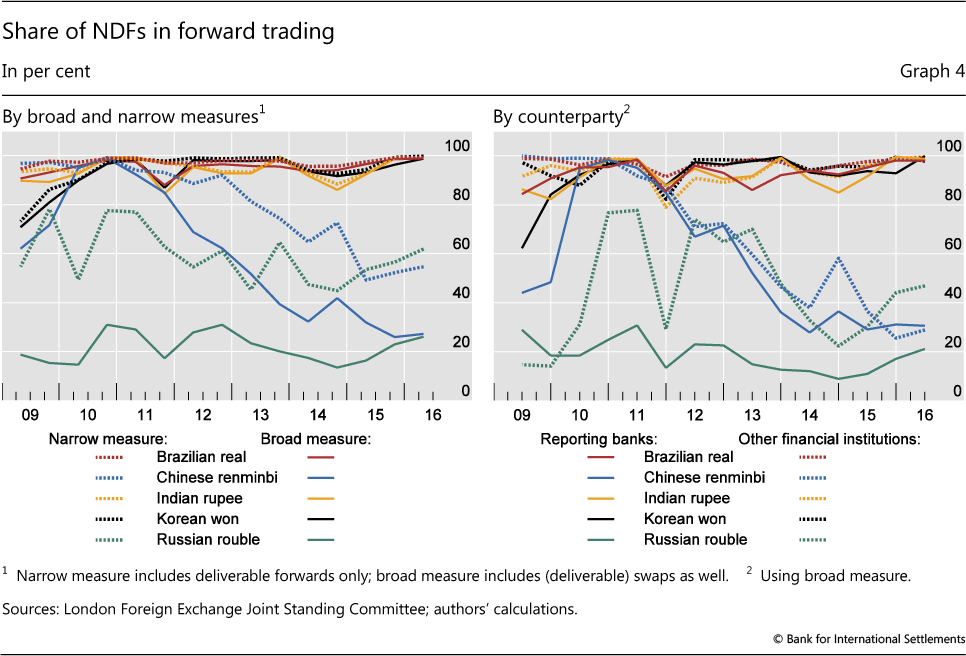
The won exemplifies the second path, in which the foreign exchange market develops around an entrenched NDF. While having a generally open capital account, Korea still limits non-residents' won borrowing from banks in Korea in the DF market. As a result, the NDF has the lion's share of forward won trading in London (Graph 4). However, Korean banks can arbitrage between the onshore forward and NDF markets, and various interest rate and currency derivatives trade actively in the non-deliverable form. The KRW/USD pair is now by far the most traded NDF globally, and KRW NDF turnover expanded by over half between 2013 and 2016, even faster than the strong growth of KRW spot and forward trading (Table 1). It is possible that market developments associated with derivatives reforms have contributed to the rise in the turnover in the KRW NDF (see below).
The renminbi's internationalisation has taken the third path. Under China's capital controls, residents have access to offshore markets, and non-residents have access to onshore markets, generally only through administered channels. Non-residents do not generally enjoy access to onshore DFs and therefore cannot use them to borrow renminbi from banks in China. Instead, the authorities have permitted, within still effective (although leaky) capital controls, a pool of offshore renminbi that can be freely traded and delivered (Shu et al (2015)). The renminbi forward market is thus split into three: an offshore NDF market (starting in the 1990s), an onshore DF market (since 2007) and an offshore DF market, known as the CNH market (since mid-2010).
The progress of deliverable renminbi at the expense of the NDF is very evident in London trading (Graph 4, left hand panel). By mid-2016 the NDF share of forward trading in London had declined to that of the rouble (25%). The NDF's share declined sharply between 2011 and 2014 across all counterparties (Graph 4, right-hand panel). Before the August 2015 reform of the onshore renminbi fixing mechanism, the NDF was a problematic hedge, with a gap as wide as 2% between its settlement rate and the renminbi's actual trading level (McCauley et al (2014)).6
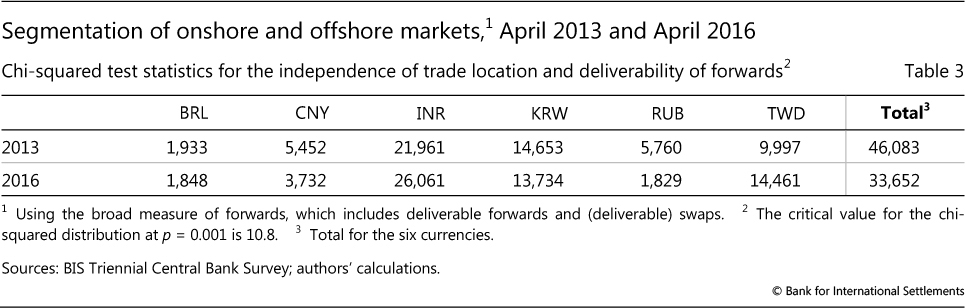
The renminbi and rouble stand out from the other four owing not only to the declining share of NDFs in forward turnover, but also to the declining segmentation between onshore and offshore markets. For the renminbi, the relationship between deliverability and location has weakened - a drop in the chi-squared statistic from 5,452 to 3,732 (Table 3) - as offshore deliverable CNY trades doubled and offshore NDF trades shrank. Likewise, the increase in NDF trading in Moscow reduced the segmentation between onshore and offshore rouble markets.
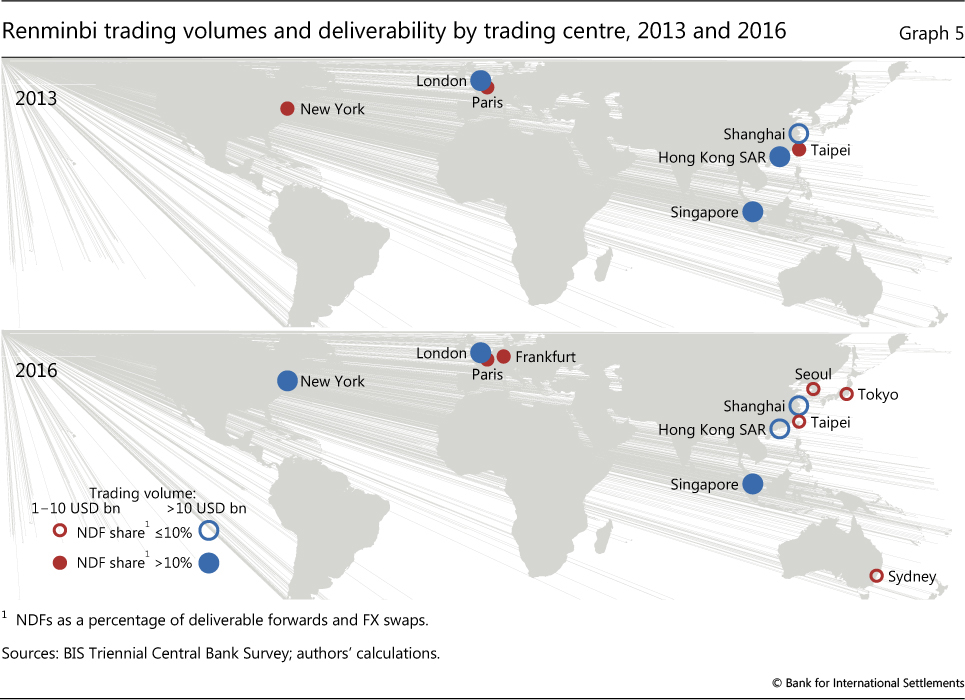
The displacement of the renminbi NDF by deliverable CNY trades has progressed furthest in the offshore centres that have traded the renminbi the longest. Asian centres enjoyed an early lead in renminbi trading under the strategy of renminbi internationalisation. Graph 5 shows that, as of April 2016, the Asian centres traded a mix of forwards that was very light in NDFs, compared with April 2013. NDFs still have a higher share in European and US CNY trading.
NDFs and derivatives reform
International regulatory initiatives have begun to transform NDF markets, as they have other derivatives markets. Policymakers concluded from the events of 2008-09 that the opacity and decentralisation of derivatives markets posed systemic risks. Measures to reduce such risks include promotion of trading on electronic platforms, mandatory trade reporting and centralised clearing. As a result, NDFs, along with other derivatives (particularly interest rate derivatives; see Ehlers and Eren (2016)), have started the transition from a decentralised, bilateral microstructure to centralised trading platforms and clearing with mandatory disclosure.
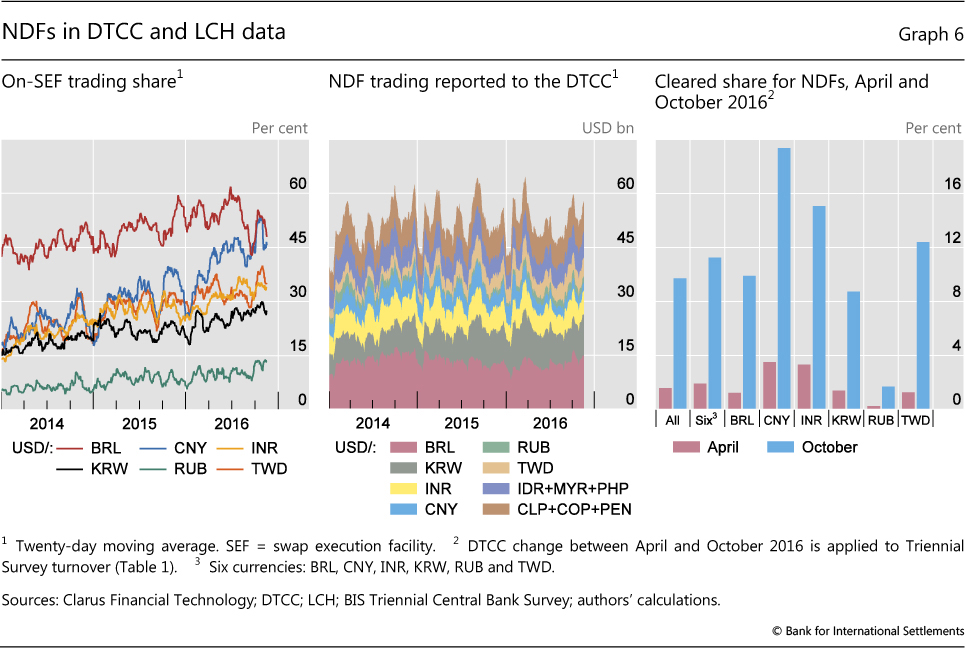
According to the DTCC data (see below), trading of NDFs on electronic platforms has risen considerably in the last few years. The share of NDF trading on swap execution facilities (SEFs) reached 15% for the rouble, about 30% for the rupee, won and New Taiwan dollar, and 45% for the real and renminbi in September 2016 (Graph 6, left-hand panel). This increase in centralised NDF trading occurred without a requirement that FX products be traded on such platforms (FSB (2016)).
A large number of jurisdictions now require public trade reporting for NDFs and other derivatives (FSB (2016)). Volumes of NDFs reported to the DTCC involving US counterparties amounted to 40% of the total trading of our six currencies in April 2016. In particular, about a third of NDF trades in the renminbi, rupee, won and New Taiwan dollar were reported for April 2016, and 60% of trades in the real and rouble.
Box A
NDF trading during the August 2015 renminbi volatility
Using DTCC and Triennial data, this box explores how renminbi market developments in August 2015 spilled over into emerging FX markets. This analysis using newly available turnover data sheds new light on international spillovers from China's currency markets, heretofore identified through prices (Shu et al (2016)).
On 11-12 August 2015, the renminbi daily fixing was set successively 1.9% and then 1.6% lower than the previous day, and fears of a steep CNY depreciation led to widespread pressure on forwards of EME currencies (Graph A, left-hand panel). The INR three-month NDF and DF depreciated by 2.9% and 1.9% against the US dollar, respectively, in three days. The BRL DF and NDF both depreciated by 2.3-2.4%. The Korean won and New Taiwan dollar depreciated less, but, like the rupee, moves were larger for NDFs than DFs. These two currencies' NDF rates switched from implying a smaller depreciation than their DF counterparts before 11 August, to a greater depreciation after.
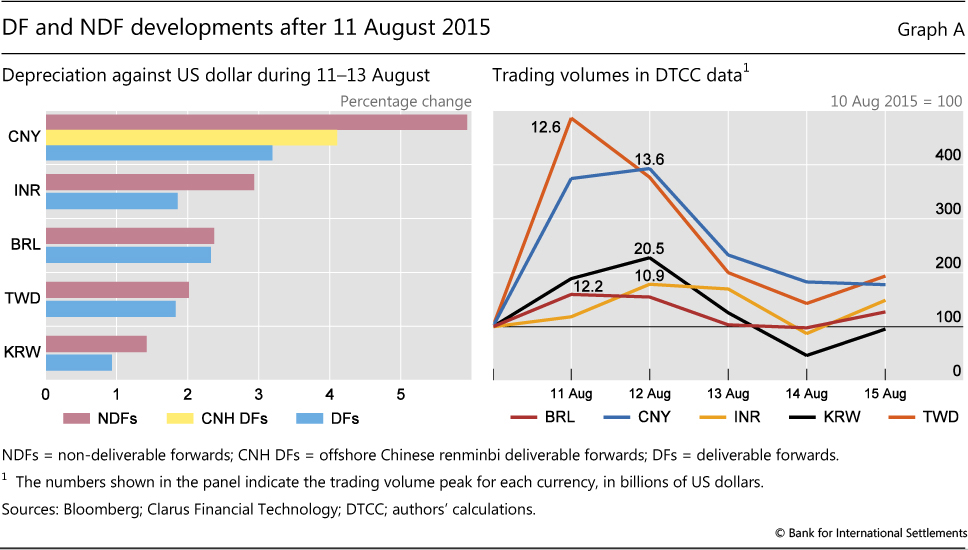
The volume response was bigger in the currencies of China's neighbouring economies. The DTCC data show that KRW and TWD NDF trading involving US counterparties saw larger rises in volumes, even though the INR and BRL rates depreciated more (Graph A, right-hand panel). On 11 August, renminbi NDF trading almost quadrupled to $13 billion. Given the ratio of DTCC turnover to global turnover in April, this implies around $40 billion in global CNY NDF turnover, four times the April 2016 level. CNY NDF turnover rose further on the following day before falling back. TWD NDF trading surged even more on 11 August, to 486% of the previous day's volume, or an estimated 3.7 times the April volume. While KRW NDF turnover only doubled, its increase of $10 billion was the largest response of the five currencies. In terms of volume, the responses of the INR and BRL NDFs were the smallest. Similar increases in NDF trading occurred during a bout of CNY turbulence in January 2016. On this evidence, it appears that, even though the CNY NDF turnover is fading, renminbi developments are boosting Asian NDFs.
Observations for three countries with daily data on domestic trading suggest that the NDF's share of trading increased in China and India in this episode, but not in Brazil. For the renminbi, the daily onshore spot trading through the China Foreign Exchange Trade System (CFETS) rose by 50% on average in the five days after 11 August, a modest increase compared with that of NDF trading registered with the DTCC. On 11 August when NDF trading peaked, the ratio of NDF trading in DTCC data to onshore spot trading (CFETS) rose to 50%, well above the ratio of 42% for the global NDF trading to onshore spot trading reported by the April 2016 Triennial. Data from the Reserve Bank of India show that increases in spot trading volumes in the initial days after the devaluation were comparable to those of the NDF trading reported in the DTCC data, but onshore DFs showed lower increases. Spot trading rose by more than that of NDFs over a five-day period in the case of the real, according to the Central Bank of Brazil.
Data made available through mandatory disclosure have made it possible to study NDF market dynamics at a high frequency. For example, DTCC data suggest that NDFs experienced peak volumes in August 2015 (Graph 6, centre panel). This timing points to the influence of the changes to the renminbi's exchange rate management on NDF volumes, not only in the renminbi but also in other Asian currencies (see box).
In almost all jurisdictions, central clearing of NDFs, though not legally mandated, is being encouraged by higher margins for non-cleared NDFs. From September 2016, large banks in the United States, Japan and Canada must post both initial and maintenance margins for NDFs and higher margins for those not centrally cleared.
When these rules came into effect, cleared NDF trades immediately surged, and rose to a record high in October. We estimate that the share of cleared NDF trades quintupled to about 10% in October 2016 from the low base of April 2016 (Graph 6, right-hand panel; see Barnes (2016) for method). The Triennial and clearing house data suggest that in April 2016, before the new rules, just 1-2% of global NDFs were centrally cleared. The cleared share ranged from practically zero for the rouble and 1-2% for the real, won and New Taiwan dollar to 3-4% for the renminbi and rupee. The imposition of higher margin requirements saw the share of cleared CNY, INR and TWD NDFs rise by over 10 percentage points.7
Conclusions
The NDF market has maintained its share globally in overall FX trading, despite shrinkage of CNY NDF turnover in recent years. It remains a particularly important offshore FX instrument for many EMEs. This market's resilience reflects hedging and position-taking demand for currencies subject to restrictions on non-resident use.
Nonetheless, different policies towards such restrictions have led to different paths in NDF market development. The Korean won NDF bulks large in trading in that currency owing to official constraints, and its turnover may be spurred by renminbi developments while its liquidity gains from ongoing market centralisation. The rouble NDF is lingering with a low market share despite full convertibility of the currency, possibly due to credit constraints and political developments. At the same time, renminbi DFs are displacing the NDF, thanks to currency internationalisation.
The corner of the foreign exchange market represented by NDFs also opens a window for assessing the progress of derivatives reforms. Trading of NDFs has begun to shift to centralised platforms, and higher margin requirements for non-cleared derivatives trades implemented in September saw centralised clearing of NDFs jump. Disclosure of trades has become mandatory in a number of jurisdictions, and the resulting increased transparency can inform a better understanding of market dynamics.
References
Bank for International Settlements (2016a): "Foreign exchange turnover in April 2016", Triennial Central Bank Survey of Foreign Exchange and Derivatives Market Activity, September.
--- (2016b): "Glossary", BIS Quarterly Review, December, pp 27-34
Barnes, C (2016): "BIS 2016 FX data - how much of the NDF market is cleared?", blog, www.clarusft.com.
Becker, L (2014): "Banks split ruble forwards books on Russia sanctions fears", Risknet, 25 March.
Committee on Payments and Market Infrastructures and Board of the International Organization of Securities Commissions (2015): Public quantitative disclosure standards for central counterparties, February.
Debelle, G, J Gyntelberg and M Plumb (2006): "Forward currency markets in Asia: lessons from the Australian experience", BIS Quarterly Review, September, pp 53-64.
Ehlers, T and E Eren (2016): "The changing shape of interest rate derivatives markets", BIS Quarterly Review, December, pp 53-65.
Ehlers, T, F Packer and F Zhu (2016): "The changing landscape of renminbi offshore and onshore market", BIS Quarterly Review, December pp 72-3.
Financial Stability Board (2016): OTC derivatives market reforms, August.
Garcia, M and T Volpon (2014): "DNDFS: a more efficient way to intervene in FX markets?", Stanford Center for International Development Working Paper no 501, May.
HSBC (2013): Emerging markets currency guide 2014, December.
Ibrahim, M (2016): "Financial markets and the ringgit: our journey forward", remarks at the Financial Market Association (PPKM) Annual Dinner, Kuala Lumpur, Malaysia, 18 November.
Indira Gandhi Institute of Development Research (IGIDR) Finance Research Group (2016): "Features and trends of NDF markets for emerging economy currencies: a study of the Indian rupee", IGIDR working paper, March.
Kohlscheen, E and S Andrade (2014): "Official FX interventions through derivatives", Journal of International Money and Finance, vol 47, pp 202-16.
McCauley, R, C Shu and G Ma (2014): "Non-deliverable forwards: 2013 and beyond", BIS Quarterly Review, March, pp 75-88.
Moore, M, A Schrimpf and V Sushko (2016): "Downsized FX markets: causes and implications", BIS Quarterly Review, December, pp 35-51.
Shu, C, D He and X Q Cheng (2015): "One currency, two markets: the renminbi's growing influence in Asia-Pacific", China Economic Review, vol 33, pp 163-78.
Shu, C, D He, J Y Dong and H L Wang (2016): "Regional pull vs global factors: China and US influence on Asia-Pacific financial markets", BIS Working Paper, no 579.
Standing Council on International Competitiveness of the Indian Financial System (2015): International competitiveness of currency, equity and commodity derivatives markets, Department of Economic Affairs, Ministry of Finance.
Upper C and M Valli (2016): "Emerging derivatives markets?", BIS Quarterly Review, December, pp 67-80.
Wooldridge, P (2016): "Central clearing predominates in OTC interest rate derivatives markets", BIS Quarterly Review, December, pp 22-4.
Annex
1 The authors thank Iñaki Aldasoro, Claudio Borio, Benjamin Cohen, Emanuel Kohlscheen, Guonan Ma, Hyun Song Shin, Christian Upper, Laurence White and Philip Wooldridge for discussions, and Norma Abou-Rizk, Kristina Bektyakova, Denis Pêtre, Jimmy Shek, Tsvetana Spasova, José María Vidal Pastor and Alan Villegas for research assistance. The views expressed are those of the authors and not necessarily those of the BIS. See the Glossary (BIS (2016b)) for definitions of relevant technical terms.
2 Some NDFs traded in Brazil settle in reais (Garcia and Volpon (2014); Kohlscheen and Andrade (2014)).
3 For the real, futures trading dominates onshore. See Upper and Valli (2016).
4 The share of offshore NDF trading (29.5%) is over 8 percentage points higher than in the case of the same DF and NDF split onshore and offshore (33.6% * 63.0% = 21.1%). Similarly, DFs' onshore share (32.9%) is higher than expected (37.0% * 66.4% = 24.6%). A chi-squared test strongly rejects the independence of trading location and deliverability (Table 3).
5 In the early 1980s, the Australian dollar also followed this first path. The domestically traded and domestic currency-settled NDF market disappeared four years after liberalisation in 1983 (Debelle et al (2006)).
6 Since the reform, the gap has narrowed, as the "fixing rate" used for settlement - set every morning at 9.30 am in the China Foreign Exchange Trade System - is not far from the previous day's close. The reduced "basis risk" from the convergence between the NDF's settlement rate and the market rate made the NDF more useful, but came too late: liquidity had already tipped to DFs.
7 See Wooldridge (2016) for further discussion on central clearing of OTC derivatives.