International finance through the lens of BIS statistics: bond markets, domestic and international

The period since the Great Financial Crisis has seen a shift in debt financing from loans to bonds. This article provides an overview of how the BIS debt securities statistics can be used to examine the size and structure of bond financing, including its sectoral and currency composition. Government issuance drove the growth of bond markets, but private sector activity fuelled their broader development, including access for a more diverse mix of borrowers. Governments stepped up their borrowing mainly in their domestic currency. Meanwhile, private sector borrowers continued to tap bond markets in foreign currency, mainly US dollars.1
JEL classification: F34, F36, G10, G15, H63.
The period since the Great Financial Crisis (GFC) of 2008–09 has seen a shift in debt financing from loans to bonds. While in many countries, bank loans have remained the main source of debt financing, bond financing has grown at a faster pace. Globally, bond markets are set to surpass bank lending as the dominant funding source for non-financial borrowers.
This article is a primer on how the BIS debt securities statistics can be used to examine the size and structure of bond financing and assess associated vulnerabilities that could pose risks to financial stability. The statistics encompass the issuance and outstanding amounts of bonds and bills issued by governments and private sector borrowers, with breakdowns by market, sector, currency, maturity and interest rate type. Coverage of debt securities issued offshore in international markets and domestically in markets of major economies is reasonably complete. However, the history and granularity of breakdowns vary across markets, and data on markets in smaller economies are less comprehensive.
Based on these statistics, the article highlights salient trends that have shaped bond markets. Since 2020, governments have become the largest borrowers in global bond markets, accounting for more than half of outstanding debt securities. The largest surges in government issuance were seen during the GFC and the Covid-19 pandemic, as governments financed expanding deficits.
Key takeaways
- The period since the Great Financial Crisis of 2008–09 has seen a shift in debt financing from loans to bonds.
- Government issuance drove the expansion of bond markets, with outstanding government bonds now outweighing private sector bonds in many economies.
- Governments increasingly relied on domestic currency bonds, but private sector borrowers continued to issue sizeable amounts in foreign currency, mainly US dollars.
Government bonds today are predominantly denominated in the borrower's domestic currency. This has long been the norm for advanced economies (AEs). In emerging market economies (EMEs), governments' ability to tap bond markets in their own currency is a more recent development.2 It has helped EME borrowers to reduce their exposure to currency and maturity mismatches. At the same time, it has heightened the sensitivity of financial conditions in EMEs to mismatches on the balance sheets of global investors.
In contrast to governments, private sector borrowers continue to issue substantial amounts in foreign currency. The bulk of foreign currency bonds are denominated in US dollars, although the range of currencies that borrowers use has widened over time. Foreign currency bonds might be hedged by international sales or financial derivatives, but incomplete information about hedging raises concerns about the systemic risks posed by potential currency mismatches at these entities.
The first section of this article explains the concepts underlying the BIS debt securities statistics, with additional details about their scope and dimensions provided in the Annex. The second section documents the growing importance of bond financing in the global financial system. The article then examines trends in government and private sector bond markets, followed by a section on the currency mix. The concluding section outlines challenges arising from those developments.
Concepts underpinning the BIS debt securities statistics
The BIS debt securities statistics record primary issuance in money and bond markets. They capture debt securities placed by residents in their domestic market – known as domestic debt securities (DDS) – as well as those issued outside the market where the borrower resides, for example in international financial centres – known as international debt securities (IDS).3 Total debt securities (TDS) sum DDS and IDS together, representing all debt securities issued by residents of an economy regardless of currency or the issuer's nationality.
The debt securities statistics are compiled at the country level, disaggregated by sector. Resident issuers are categorised as belonging to the general government sector, financial corporations (which comprise banks, non-bank financial institutions (NBFIs) and central banks) or non-financial corporations (NFCs).4
The statistics capture each sector's financing choices across currencies, maturities and interest rate types. The currency dimension is central to BIS international banking, derivatives and other statistics (McGuire et al (2024b)). Currency risk is an integral aspect of bond financing: issuers borrowing unhedged in a foreign currency face the risk of a rising debt burden when their domestic currency depreciates, whereas borrowing in their own currency shifts the currency exposure to creditors. Attributes like maturity and interest rate type (fixed vs variable) also have a critical influence on the risks associated with bond financing. Longer maturities protect borrowers from refinancing risk. Yet they expose bondholders to greater duration risk: the value of their holdings becomes more sensitive to changes in interest rates.
The debt securities tables published by the BIS show quarterly data for issuers in about 50 major economies, as detailed in the Annex. The TDS and DDS statistics are based on aggregates compiled by national authorities. The IDS statistics are compiled by the BIS using security-level data from commercial sources; they are available for all countries issuing IDS.
The BIS also publishes holdings statistics on a from-whom-to-whom basis, with breakdowns by residence and sector. The trading of bonds in secondary markets makes it difficult to identify ownership, and thus the country and historical coverage of holdings statistics is more limited than that of the issuance statistics. The issuance statistics are mostly shown at face value or at nominal value – the amount that the debtor owes. In contrast, holding statistics are shown at market value, which is the more relevant metric from a creditor's perspective.
The rise of bond markets
Since the 1990s bond markets around the world have expanded rapidly, outpacing economic activity. Debt securities outstanding rose from 98% of global GDP in 2000 to over 135% by end-2024, topping $150 trillion (red line, Graph 1.A). The GFC and the Covid-19 pandemic saw sharp increases in the ratio of bonds to GDP, owing in part to declines in GDP. Yet the upward trend has been evident outside these crises.
While the largest AEs have long had well developed bond markets, smaller AEs and EMEs have tended to rely less on bond financing. EMEs' dependence on banks, especially for cross-border funding, left many exposed to currency and maturity mismatches, which led to a series of financial crises in the 1980s and 1990s. These crises motivated initiatives to develop domestic bond markets, where funds could be raised in local currency at fixed rates for long maturities (CGFS (2007)).
The shift towards bond markets was given an impetus by the GFC, which set in motion two related structural changes (BIS (2025)). First, as banks retrenched after the crisis, the post-GFC financial system saw portfolio investors take centre stage as creditors. Between 2009 and 2023, financial assets held by non-bank creditors surged from 167% to 225% of global GDP (BIS (2025)). Over the same period, banks' total assets grew more modestly, from 164% to 177% of global GDP. Notably, global portfolio investors stepped up their purchases of bonds denominated in EME currencies, supporting the development of domestic markets. International bond markets expanded at a slower pace (Graph 1.A).
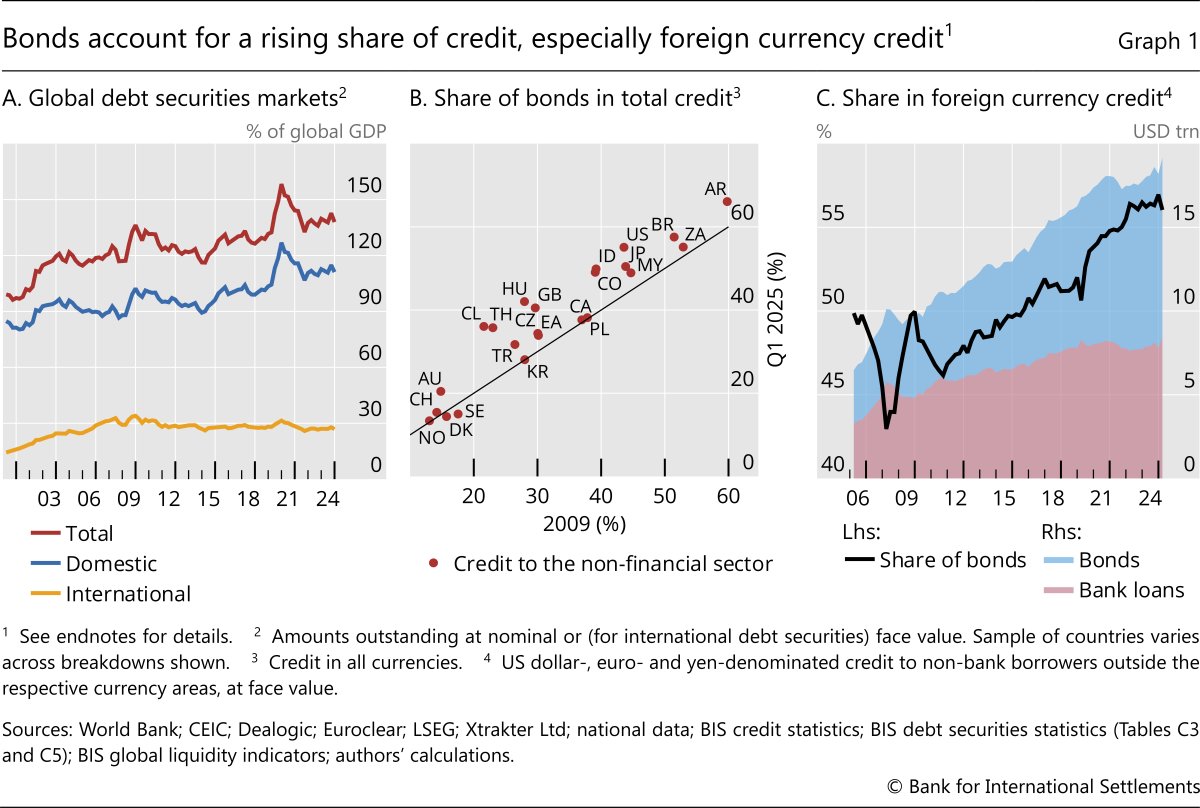
The second change was a shift from lending to private sector borrowers to claims on the government. This shift was driven by increased fiscal deficits, especially during the Covid-19 pandemic. Government issuance helped to propel the growth of domestic bond markets in particular, which expanded from 95% of global GDP in 2009 to about 110% in 2024 (Graph 1.A).
These changes led to a shift in debt financing from loans to bonds. While loans remain the largest source of debt financing in most countries, the share of bonds has risen since 2009, as shown by the number of countries lying above the 45° line in Graph 1.B. By end-March 2025, the share of bonds in total credit to non-financial borrowers – governments, NFCs and households – had risen to 40% globally and exceeded 50% in Brazil, the United States and several other economies. The shift towards bonds was especially significant for foreign currency credit, which, since 2016, has been extended predominantly in the form of bonds (Graph 1.C). The rise was less pronounced for smaller EMEs and developing countries, whose financial systems remain largely bank-based.
Government issuance fuels domestic bond markets
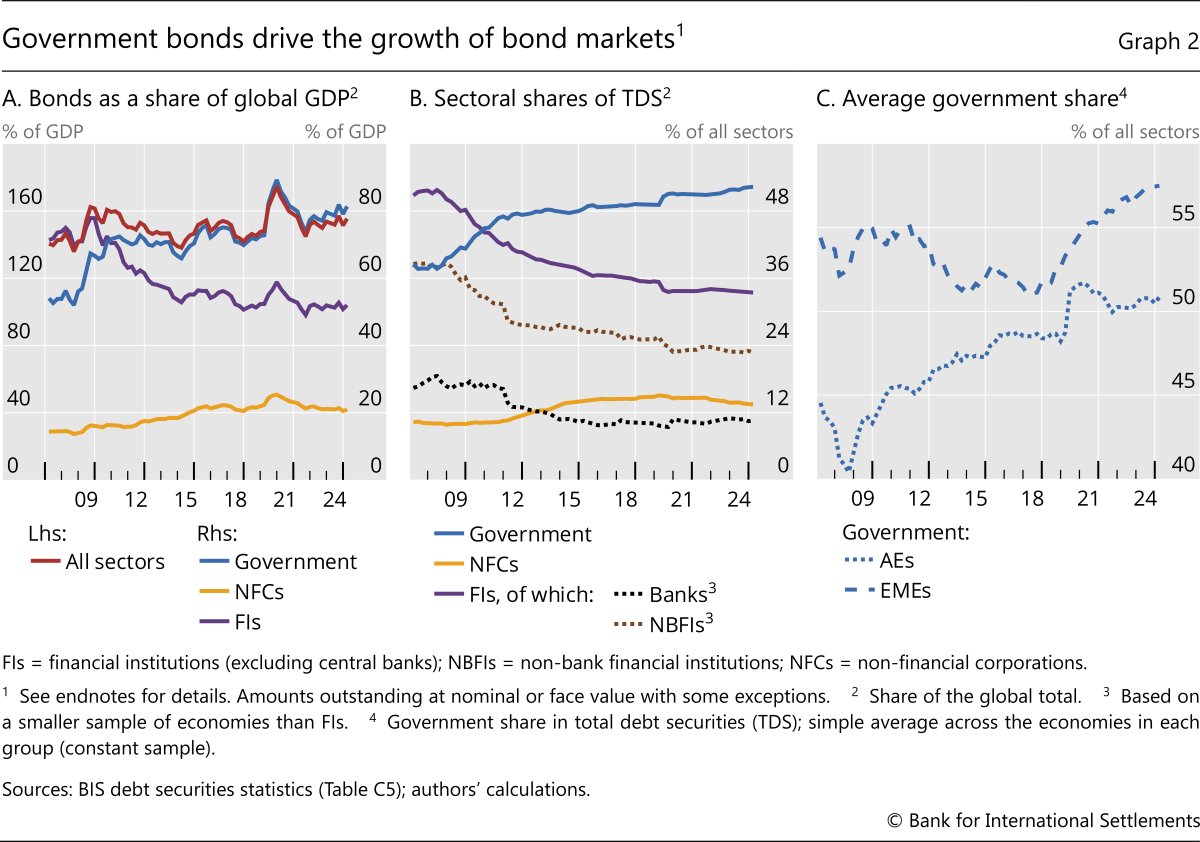
Since 2020, governments have become the largest borrowers in global bond markets, accounting for more than half of total debt securities outstanding. Government bonds outstanding rose from around 65% of global GDP in 2009 to over 80% by end-March 2025 (Graph 2.A).5 This took the share of government bonds in global TDS to 52% (Graph 2.B). The share of government bonds in TDS is higher for the average EME than for the average AE: 58% versus 51% (Graph 2.C).
The largest surges in government issuance were seen during the GFC and the Covid-19 pandemic, when governments sought financing for expanded deficits (Graphs 2.A and 2.B). The jump in AE government issuance during the pandemic abated as GDP recovered. In contrast, EME government issuance continued to trend up as a share of total issuance even after the pandemic (Graph 2.C).
Most government bonds are issued by the central government, although in some economies other levels of government add substantially to outstanding debt. Globally, state and local governments accounted for only about 20% of government bonds outstanding in 2024. In countries with federal systems, this share was often considerably higher, as much as 50% in Canada and 36% in India. In China, most of the large increase in government debt since the mid-2010s was incurred by local governments.
On occasion, central banks have also issued debt securities at scale. Central bank issuance accounts for little overall, averaging 0.5% of outstanding TDS since the pandemic. However, it occasionally jumps, particularly in small open economies and EMEs when central banks issue bills to sterilise foreign exchange intervention or absorb liquidity in the financial system.6
Governments often borrow at long maturities. Prior to the GFC, the longest maturity was typically 30 years in AEs and perhaps 10 years in EMEs. During the low-for-long period that followed the GFC, some governments extended the maturity of their bonds to 50 or even 100 years. For example, in 2017 the Argentine government issued a US dollar bond with a maturity of 100 years, and in 2020 Austria issued a euro-denominated century bond. Such ultra-long bonds reduce refinancing risk for issuers but increase the exposure of bondholders to duration risk. Consequently, demand for such bonds waned as interest rates began to rise in 2022.
In recent years, the maturity of government bonds has averaged around 13 years in AEs and 12 years in EMEs.7 However, when government and central bank balance sheets are combined, the average maturity falls because central bank liabilities are mostly bank reserves that take the form of overnight deposits. Where central banks conducted large-scale purchases of government bonds, they replaced long-term government bonds with debt indexed to the rate on reserves held by banks. At the peak of asset purchases in 2021, this effectively turned 30–50% of public debt into overnight debt in some of the largest AEs (BIS (2022)). The share has since fallen sharply as central banks have unwound these purchases.
NBFIs boost private sector bond markets
While government issuance drove growth, the private sector fuelled the broader development of bond markets. This was reflected in the growing diversity of private sector issuers with market access: banks, various NBFIs including securitisation vehicles, and NFCs.8
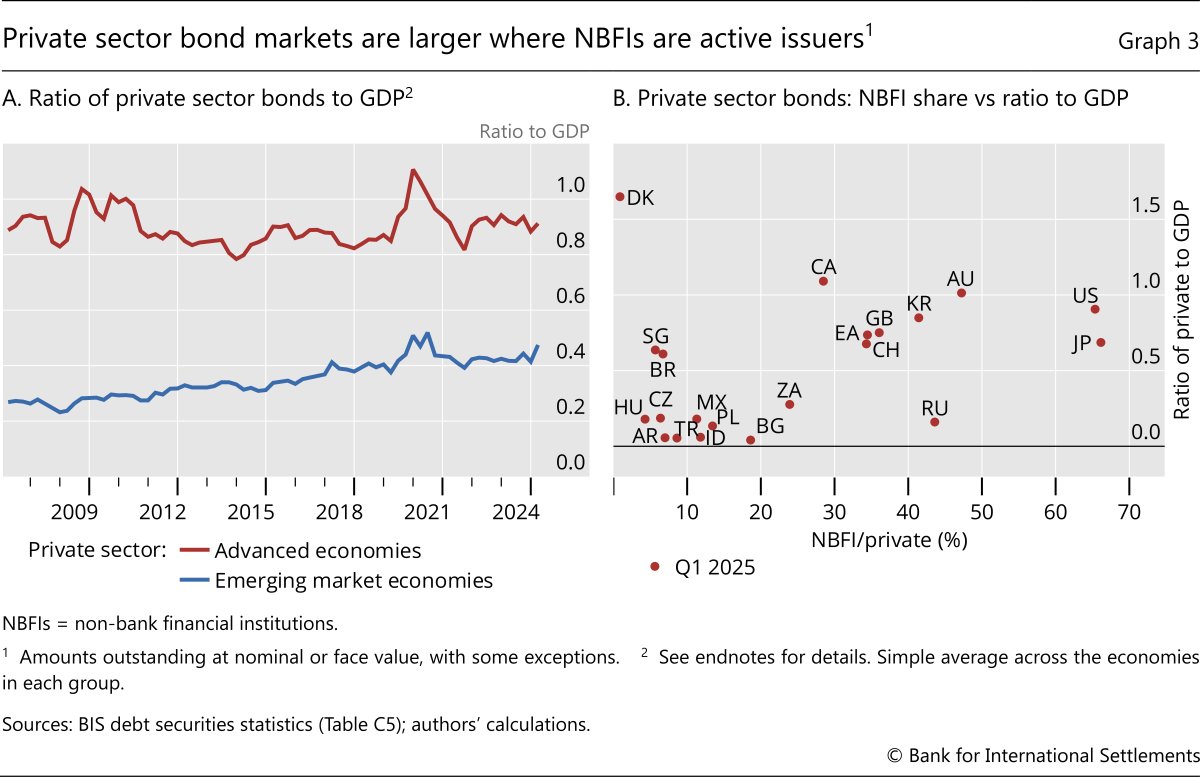
Since the mid-2010s, the ratio of private sector bonds to GDP has remained roughly constant. This was more evident in AEs, notwithstanding a temporary blip during the Covid-19 pandemic (Graph 3.A). In EMEs, outstanding bonds issued by the private sector grew steadily during the 2010s, but their ratio to GDP has since levelled off. At end-March 2025, the ratio in the typical EME was half as large as in AEs: 0.47 compared with 0.91 (Graph 3.A).
The market for private sector bonds tends to be larger in economies where NBFIs are active issuers. Graph 3.B shows this relationship in a positive correlation between the share of NBFIs in private sector bonds (x-axis) and the ratio of private sector bonds to GDP (y-axis). In turn, the share of NBFIs is boosted by securitisation. The United States stands out with the largest mortgage-backed securities (MBS) market in the world. This takes the share of NBFIs in US private sector issuance above 60% (Graph 4.A). Australia, Canada and the United Kingdom also have substantial MBS markets, raising the outstanding amount of bonds issued by the private sector in those countries.
In many European AEs, banks account for the greatest share of private sector issuance, surpassing NBFIs and NFCs. Banks' share is boosted by the prevalence of covered bonds. Like MBS, covered bonds are secured by residential or commercial mortgages or other loans, but unlike MBS, the loans remain on the issuer's balance sheet. This explains the exceptionally large share of bank issuance in economies like Austria, Denmark and Germany (Graphs 4.A and 4.B).
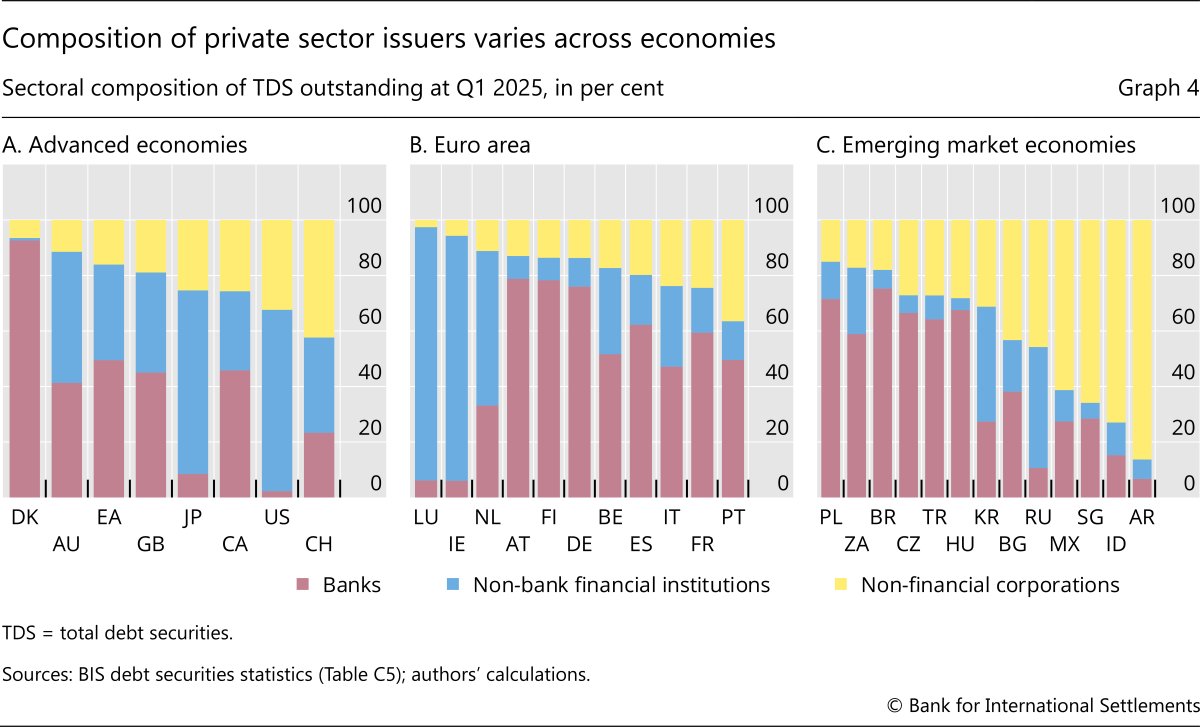
In contrast to NFCs in AEs, NFCs in EMEs are often the largest issuers or rank second only to banks (Graph 4.C). Securitisation and covered bond markets are growing but remain small, as housing finance remains relatively underdeveloped. Among EMEs, Korea has the most developed securitisation market and, accordingly, also the largest amount of private sector bonds outstanding (Graph 3.B).
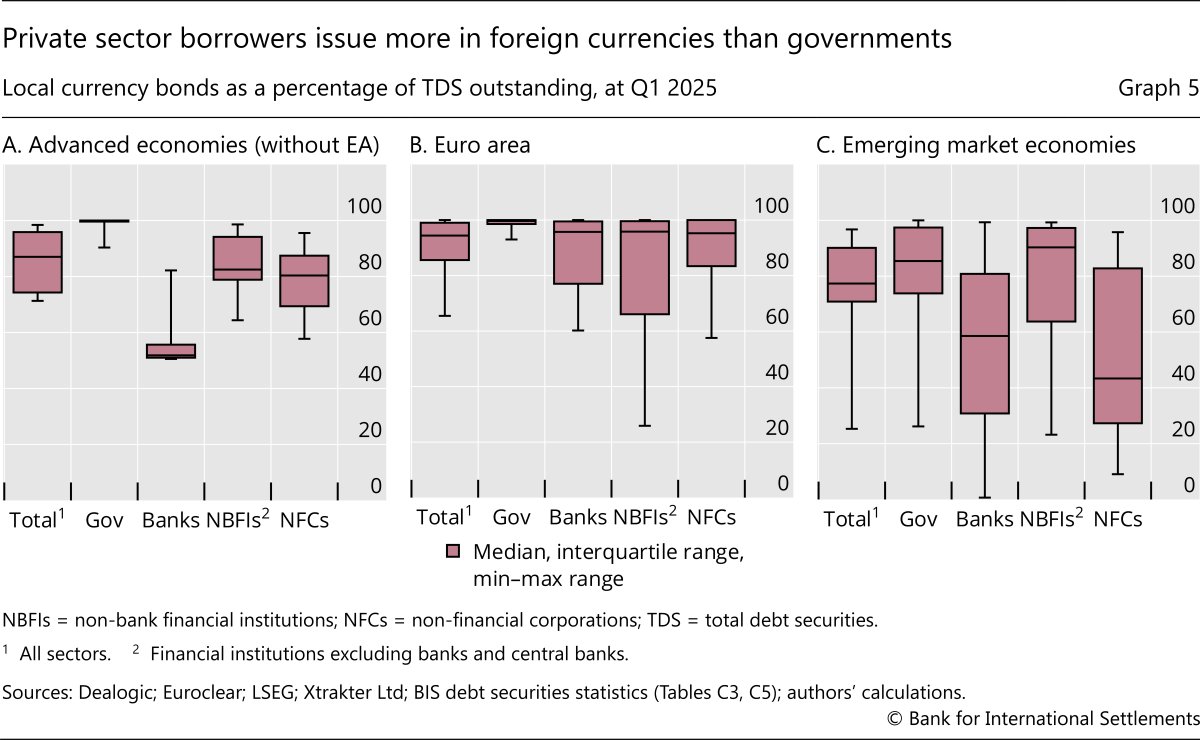
Currency choice across sectors
Turning to the currency dimension, around 93% of all bonds globally are denominated in the borrower's domestic currency (Graph 5). However, this share ranges from less than 60% in countries with a history of macroeconomic instability, such as Argentina and Türkiye, to nearly 100% in the United States and other countries with global reserve currencies. Across sectors within a country, the domestic currency share is highest for governments and typically lowest for banks and NFCs. Among borrowers who issue bonds denominated in a currency other than their own, the US dollar remains the predominant choice.
EME governments overcoming "original sin"
Government bonds are typically issued in the domestic market in local currency (CGFS (2007); IMF and World Bank (2021)). Most AE governments overwhelmingly issue bonds in their own currency. This is also the case for the largest EMEs, notably China and India (Bogdanova et al (2021)). Governments in other major EMEs often issue in a mix of domestic and foreign currencies. Developing countries issue bonds predominantly in foreign currencies, usually US dollars, because their domestic market is too shallow.
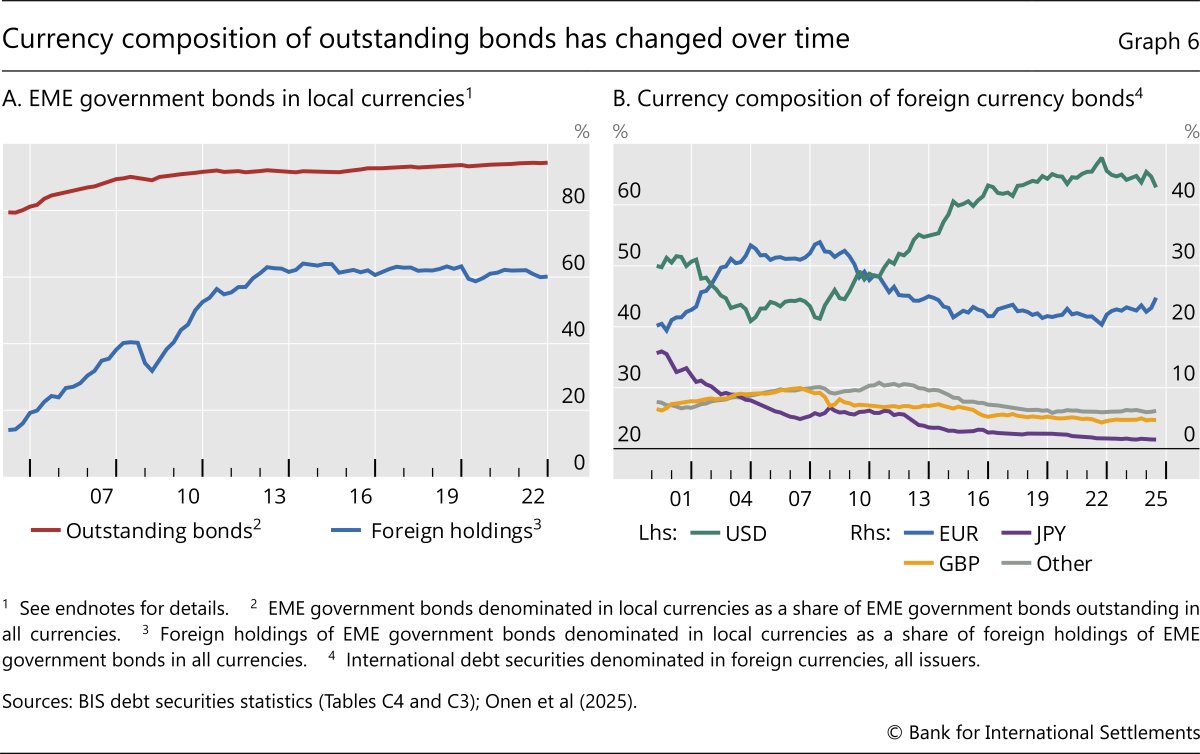
The ability of governments in major EMEs to tap bond markets in their own currency is a noteworthy development. Prior to the 2000s, most suffered from "original sin" – the inability to borrow (abroad) in their own currency (Eichengreen and Hausmann (1999)). Initiatives to deepen domestic markets by expanding the institutional investor base, coupled with the post-GFC rise of global portfolio investors and search for yield, helped to boost the local currency share of outstanding EME government bonds (Graph 6.A, red line).9 At the same time, the share of local currency bonds in foreign holdings of EME bonds rose from less than 30% to more than 50% (blue line). That said, even major EMEs have seen setbacks in foreign participation in recent years, in part due to currency weakness (Onen et al (2025)).
US dollar remains the predominant choice for foreign currency bonds
Foreign currency issuance is more common among private sector borrowers (Graph 5). Indeed, in contrast to EME governments, foreign currency borrowing by NFCs in EMEs has increased since the GFC. The BIS global liquidity indicators capture this trend.10 The second phase of global liquidity following the GFC saw a general shift towards bond financing, led by foreign currency issuance by NFCs (Graph 1.C) (Hardy and von Peter (2023)).
Foreign currency issuance is not exclusive to NFCs in EMEs; NFCs in some AEs also issue large amounts. For example, over 40% of bonds issued by NFCs in Canada are in foreign currency, as are the majority of those issued by NFCs in Denmark. In some countries, banks also issue large amounts of foreign currency debt (Graph 5). For instance, over 90% of the bonds issued by banks in Türkiye and about 50% of those issued by banks in Indonesia are denominated in a foreign currency.
Foreign currency issuance is often, but not always, hedged. NFCs might borrow in foreign currency to hedge their international sales, while banks might have foreign currency loans.11 Some borrow in foreign currency to lower funding costs, for example tapping the deep US dollar market for corporate debt, and then use derivatives to hedge the currency risk. Others leave their borrowing unhedged.12
Further reading
- I: Residence vs Nationality McGuire, P, G von Peter and S Zhu (2024a): "International finance through the lens of BIS statistics: residence vs nationality", BIS Quarterly Review, March, pp 73–88.
- II: The Role of Currencies --- (2024b): "International finance through the lens of BIS statistics: the global reach of currencies", BIS Quarterly Review, June, pp 1–16.
- Enhancing the BIS government bond statistics
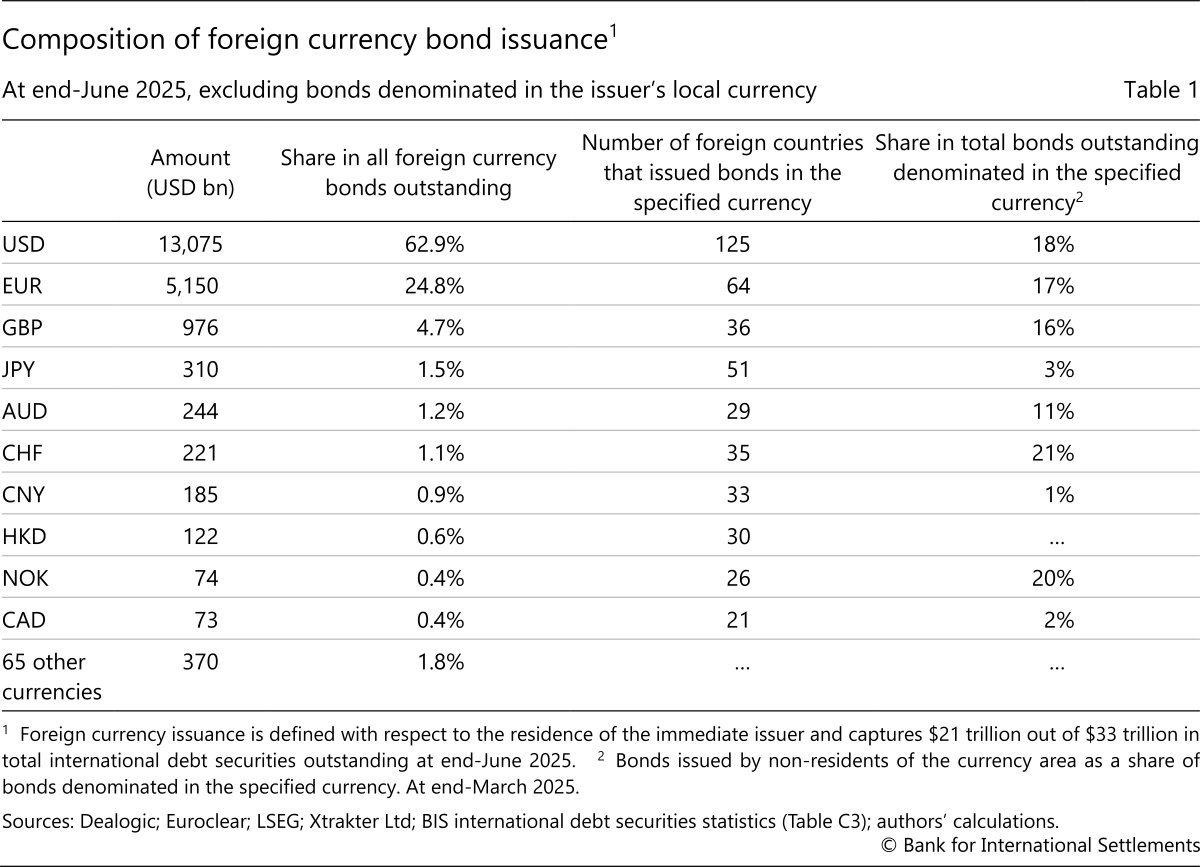
The vast majority of foreign currency bonds are denominated in US dollars: 63% as of June 2025 (Graph 6.B and Table 1). The dollar's share has increased by 20 percentage points since end-2007, mainly at the expense of the euro (whose share fell from 32% to 25%), pound sterling (from 9% to 5%) and yen (from 5% to 1%).13 Borrowers in some 125 economies issue international bonds in dollars, about twice the number doing so in euro or yen (Table 1). The choice of currency is influenced by trade and financial integration: issuers with close ties to Europe raise substantial amounts in euro, whereas borrowers elsewhere, notably in Asia and Latin America, issue mostly in dollars.
Despite the dollar's rising share, borrowers have tapped markets in a wider range of currencies. At the time of the GFC, foreign currency issuance was limited to around 50 currencies; by 2025, there were international bonds outstanding in 75 currencies, including many EME currencies. In 2020 the Chinese renminbi (CNY) overtook the Hong Kong dollar as the most borrowed EME currency internationally. Even so, the outstanding amount of CNY bonds issued by residents outside China remains very small, accounting for only 1% of all foreign currency bonds.
Relative to total bond issuance, including issuance by residents in domestic currency, the Norwegian kroner (NOK) and Swiss franc (CHF) are the most internationalised currencies. In 2025, about 20% of outstanding NOK bonds were issued by borrowers from outside Norway, and 21% of CHF bonds by borrowers outside Switzerland (Table 1). Government debt in Norway and Switzerland is low, and both are among the world's largest international creditors. This makes it attractive for foreigners to issue bonds in NOK and CHF, since investors often prefer to lend in their own currency (Maggiori et al (2020)). In contrast, non-resident issuers' share of the Japanese yen market was relatively low at 3%, crowded out by a large amount of government borrowing.
Conclusions
The shift in debt financing from loans to bonds has broadened the diversity of funding sources and instruments available to borrowers and enabled them to better manage currency and maturity mismatches. EME governments, in particular, are less reliant on foreign currency funding than they once were. Private sector borrowers continue to raise large amounts through foreign currency bonds, predominantly in US dollars, but often hedged by foreign sales or financial derivatives.
Notwithstanding the benefits associated with the development of bond markets, the shift to bonds has also brought new challenges. One is the vulnerabilities associated with currency or duration mismatches on investors' balance sheets. The flipside of the bond-enabled reduction in mismatches on borrowers' balance sheets is the transfer of risks to creditors. Mark-to-market losses from currency depreciation or interest rate increases can lead to selling or ex post hedging, which further pushes down asset prices. As a result, even EMEs without foreign currency debt remain vulnerable to fluctuations in global financial conditions (Bertaut et al (2025)).
A related challenge is monitoring the hedging activities of issuers and investors active in bond markets. Information about hedging by NBFIs and NFCs is less complete than for banks, raising concerns about the systemic risks posed by currency mismatches at these entities. Moreover, even when investors hedge their holdings, they often use derivatives that have a shorter maturity than the assets being hedged. The resulting rollover risk exposes investors that hedge to stress in dollar funding markets (McGuire et al (2021)).
References
Aldasoro, I, B Hardy and N Tarashev (2021): "Corporate debt post-GFC through the pandemic", BIS Quarterly Review, June, pp 1–14.
Atkin, T and J Harris (2023): "Foreign currency exposure and hedging in Australia", Reserve Bank of Australia Bulletin, March, pp 86–95.
Bank for International Settlements (BIS) (2022): "Old challenges, new shocks", Annual Economic Report 2022, chapter I, pp 1–39.
----- (2025): "Financial conditions in a changing global financial system", Annual Economic Report 2025, chapter II, pp 47–76.
Bank for International Settlements, European Central Bank and International Monetary Fund (BIS, ECB and IMF) (2015): Handbook on securities statistics.
Bertaut, C, V Bruno and H S Shin (2025): "Original sin redux: the role of duration risk", BIS Working Paper, no 1109, March.
Bogdanova, B, T Chan, K Micic and G von Peter (2021): "Enhancing the BIS government bond statistics", BIS Quarterly Review, June, pp 15–24.
Committee on the Global Financial System (CGFS) (2007): "Financial stability and local currency bond markets", CGFS Papers, no 28, June.
Eichengreen, B and R Hausmann (1999): "Exchange rates and financial fragility", in New challenges for monetary policy, proceedings of the Federal Reserve Bank of Kansas City Jackson Hole Economic Policy Symposium, August, pp 329–68.
Eichengreen B, R Hausmann and U Panizza (2023): "Yet it endures: the persistence of original sin", Open Economies Review, vol 34, pp 1–42.
Eren, E, S Malamud and H Zhou (2023): "Signaling with debt currency choice", BIS Working Papers, no 1067, January.
Gopinath, G and J Stein (2021): "Banking, trade, and the making of a dominant currency", Quarterly Journal of Economics, vol 136, no 2, pp 783–830.
Gruić, B and P Wooldridge (2012): "Enhancements to the BIS debt securities statistics", BIS Quarterly Review, December, pp 63–76.
Hardy, B and F Saffie (2024): "From carry trades to trade credit: financial intermediation by non-financial corporations", Journal of International Economics, vol 152, November, 103988.
Hardy, B and G von Peter (2023): "Global liquidity: a new phase?", BIS Quarterly Review, December, pp 21–31.
IMF and World Bank (2021): "Guidance note for developing government local currency bond markets", IMF Analytical Notes, no 2021/001.
Maggiori, M, B Neiman and J Schreger (2020): "International currencies and capital allocation", Journal of Political Economy, vol 128, no 6, pp 2019–66.
McGuire, P, G von Peter and S Zhu (2024a): "International finance through the lens of BIS statistics: residence vs nationality", BIS Quarterly Review, March, pp 73–88.
----- (2024b): "International finance through the lens of BIS statistics: the global reach of currencies", BIS Quarterly Review, June, pp 1–16.
Onen, M, H S Shin and G von Peter (2025): "Overcoming original sin: shedding new light on uneven progress", Economic Policy, vol 40, no 122, pp 575–620.
Endnotes
The country groupings used in this feature divide economies around the world into two groups: advanced economies (AEs) and emerging market economies (EMEs). The BIS Annual Economic Report (AER) lists some 60 jurisdictions as either advanced AEs or EMEs. The BIS international banking and financial statistics extend this categorisation to all economies that appear in published data as counterparties. The set of AEs includes those listed in the BIS AER, plus the overseas and dependent territories of these AEs. The emerging market and developing economy (EMDE) group comprises all economies not classified as AEs, including the EMEs listed in the BIS AER. The names of jurisdictions with ISO codes are provided under the abbreviations on pages iv–vii.
DDS = domestic debt securities; IDS = international debt securities; NBFIs = non-bank financial institutions; TDS = total debt securities.
Graph 1.A: For countries that do not report either TDS or DDS, data are estimated by the BIS as IDS.
Graph 1.B: The panel compares the shares at Q1 2025 with those at end-2009 or the earliest available: for AR 2018, BR 2013, ID 2018, MY 2013, TH 2011, TR 2014 and ZA 2023.
Graph 1.C: Non-banks comprise government, NBFIs, non-financial corporations, households and international organisations. Euro- and yen-denominated credit has been converted to US dollars using the end-of-period exchange rates.
Graph 2.A: The weighted average is calculated as the sum of bonds outstanding as a ratio of the TDS reporting countries' combined GDP, starting with the earliest available data: for AR 2021, BR 2018, CA 2015, CZ 2020, DK 2020, EE 2008, HU 2020, ID 2018, IE 2009, KR 2018, LT 2012, LU 2008, LV 2011, MX 2018, PH 2015 and ZA 2023.
Graph 2.B: The aggregate sector share is the TDS issued by the respective sector, as a percentage of the TDS of all sectors combined, starting with the earliest available data: for AR 2021, BR 2018, CA 2015, CZ 2020, DK 2020, EE 2008, HU 2020, ID 2018, IE 2009, KR 2018, LT 2012, LU 2008, LV 2011, MX 2018, PH 2015 and ZA 2023. Excludes 11 countries with incomplete data: CN, CL, CO, IL, IS, MY, NO, PE, PH, TH and TW.
Graph 2.C: Constant sample of countries with a common start date.
Graph 3.A: Starting with earliest available data: for AR 2021, BR 2018, CA 2015, CZ 2020, DK 2020, HU 2020, ID 2018, KR 2018, MX 2018 and PH 2015.
Graph 6.A: The red line is based on a balanced panel of 25 major EMEs; the blue line is based on an unbalanced panel of 24 major EMEs (see Onen et al (2025)).
Footnotes
1 The views expressed in this publication are those of the authors and not necessarily those of the BIS or its member central banks. This is the sixth article in a series showcasing the BIS international banking and financial statistics. We thank Iñaki Aldasoro, Stefan Avdjiev, Bilyana Bogdanova, Mauro Bucci, Gaston Gelos, Bryan Hardy, Carlos Mallo, Benoît Mojon, Ismail Mustafi, Swapan Pradhan, Dan Rees, Andreas Schrimpf, Jimmy Shek, Hyun Song Shin and Frank Smets for helpful comments and inputs.
2 In this article, "EMEs" refers to a selection of major economies from among the larger group of emerging market and developing economies (EMDEs), as detailed in the Endnotes.
3 IDS are distinguished from DDS based on three criteria: registration domain (identified by the ISIN number), listing place and governing law. If any one of these criteria differs from the residence of the issuer, the BIS defines the security as international (Gruić and Wooldridge (2012)).
4 Households and non-profit institutions serving households are grouped separately, but usually they do not issue bonds. For the purpose of analysis, in this article central banks are considered alongside the general government and excluded from private sector aggregates.
5 Total government debt includes loans, currency and deposits and thus exceeds debt securities outstanding. Between 2009 and end-March 2025, outstanding government debt at nominal value increased from 74% of global GDP to 93%, according to the BIS credit statistics.
6 Countries with spikes in central bank debt securities include Switzerland (peaking at 19% of GDP in 2011), Thailand (25% in 2012), Singapore (48% in 2024) and Czechia (more than 100% in 2021).
7 On a residual maturity basis, it averaged eight years for AE governments and seven years for EME governments.
8 Private sector refers to non-government issuers. In the BIS debt securities statistics, state-owned corporations are included in their respective sector of activity: banks, NBFIs or NFCs.
9 Progress has been uneven and slow since the mid-2010s. Smaller EMEs and developing countries continue to rely on foreign currency bonds (and bank loans) to borrow abroad (Eichengreen et al (2023)).
10 The BIS uses the term "global liquidity" to refer to the ease of financing in global financial markets. The BIS global liquidity indicators track total credit to non-bank borrowers, covering both bank loans and IDS denominated in the three major reserve currencies (US dollars, euros and Japanese yen) to non-residents, ie borrowers outside the respective currency areas.
11 In many countries regulations restrict the size of banks' open foreign currency positions, which suggests that this borrowing is largely hedged. For example, in Australia, around 90% of foreign currency borrowing by banks in offshore debt securities markets is hedged with financial derivatives into Australian dollars (Atkin and Harris (2023)).
12 They might engage in carry trades by borrowing foreign currency to accumulate cash or fund credit to suppliers in local currency (Bruno and Shin (2020); Hardy and Saffie (2024)). Some may even borrow unhedged to signal their creditworthiness and growth potential (Eren et al (2023)).
13 Explanations for the dollar's dominance in foreign currency issuance include its role in trade invoicing and the pricing of safe assets (Gopinath and Stein (2021)), investor preferences (Maggiori et al (2020)) and its use as a vehicle currency in foreign exchange transactions (McGuire et al (2024b)).
14 However, bonds issued by an Irish subsidiary registered in the Cayman Islands are not included in Ireland's TDS. They would be included in the TDS for the Cayman Islands; since the Cayman Islands does not report TDS, this gap can be covered with the IDS available for the Cayman Islands.
15 For some countries, national data are available for DDS or TDS but not for both; hence, DDS and TDS are not published for all countries. The BIS does not calculate the missing series, because it cannot control for potential double-counting, eg reported DDS may include securities the BIS classifies as IDS. Differences in valuations also complicate comparisons.
16 In addition to G20 members, this includes Chinese Taipei, Cyprus, Lebanon, Malta and Pakistan.