Enhancing the BIS government bond statistics
This statistical feature presents a new data set on long-term debt securities issued by central and general governments in domestic and foreign currencies. It combines national aggregates with data on international issuance and BIS estimates, for improved coverage across all markets of issue. The annual series cover 54 countries, including 28 advanced economies and 26 emerging market economies (EMEs) from the early 2000s in most cases. These series reveal that the issuance of government bonds accelerated over the past decade and surged with the onset of the pandemic in 2020. With major EMEs increasingly tapping bond markets in their domestic currency, the foreign currency share in EME government bonds has continued to decline. 1
JEL classification: G15, H63.
The sharp rise in government debt issuance during the pandemic has focused renewed attention on comprehensive debt statistics. Governments borrow by issuing debt securities in both domestic and international markets. Published national aggregates cover mainly the larger domestic market. The BIS international debt securities statistics (IDS), compiled using security-by-security information from commercial sources, provide complementary information on international issuance.2 A combination of different sources is necessary to complete the picture.
This statistical feature introduces a new data set that focuses on government bonds. The data set provides broad country coverage and a consistent currency breakdown across domestic and international markets. These enhancements improve on other BIS debt securities statistics that cover additional issuer sectors and provide complementary information on maturity, currency and debt instruments. The new data set includes 54 countries, 28 advanced economies and 26 EMEs, and extends back to the early 2000s for most countries. It comprises long-term debt securities – with original maturities longer than one year – issued in all markets by the central and general government, where the latter includes central, state and local government and social security funds. The outstanding amounts are broken down by currency of denomination: domestic and foreign. The statistics will be updated and extended as revisions and new data become available.
Key takeaways
- The BIS is publishing a new data set on bonds issued by central and general governments, in domestic and foreign currencies.
- The issuance of government bonds has accelerated over the past decade, driving amounts outstanding to 72% of GDP at end-2020, with emerging market economy (EME) governments accounting for a quarter of the total.
- The foreign currency share of government bonds issued by EMEs has continued to decline as major EMEs have been tapping bond markets in their domestic currencies.
The new data set is useful for analyses of government debt that require comprehensive information on bonds outstanding and need to distinguish between borrowing in domestic and foreign currencies. It reveals, for instance, that government bond issuance has accelerated over the past decade, driving amounts outstanding to $58 trillion (72% of GDP) at end-2020, with EMEs accounting for a quarter of this total. In parallel, the foreign currency share in EME government bonds has trended downwards as major EMEs have tapped bond markets in their domestic currencies. A related use of the new data set, the subject of ongoing work, is to assess how changes in foreign investors' holdings of government bonds (collected from national sources) compare with the total amounts outstanding. But the new statistics are not sufficient by themselves for analysing debt sustainability, as they exclude loans and short-term instruments.3
The first section of this feature compares the sources, scope and coverage of the new series with those of other BIS statistics on debt securities. The second section discusses trends in the evolution of government bonds outstanding and the attendant foreign currency share. The table at the end – Table C4 in the BIS statistics – reports a snapshot of the data set at end-2020.4
Data characteristics
The new statistics provide harmonised series on government bonds issued in domestic and foreign currency in all markets, building on existing BIS statistics (Table 1). The starting point is the data behind Table C2, which reports the aggregate value of central government bonds issued in domestic markets, split by currency.5 Table C3 provides broader coverage across issuer sectors and markets, but lacks a currency breakdown for all but the international bonds captured in the IDS. Additional data became available through the G20-endorsed Data Gaps Initiative and submissions from central banks.6 The new Table C4 draws on all these sources to provide a consistent currency breakdown across all markets, without distinguishing between domestic and international issuance. Furthermore, it differentiates between central and general government.7
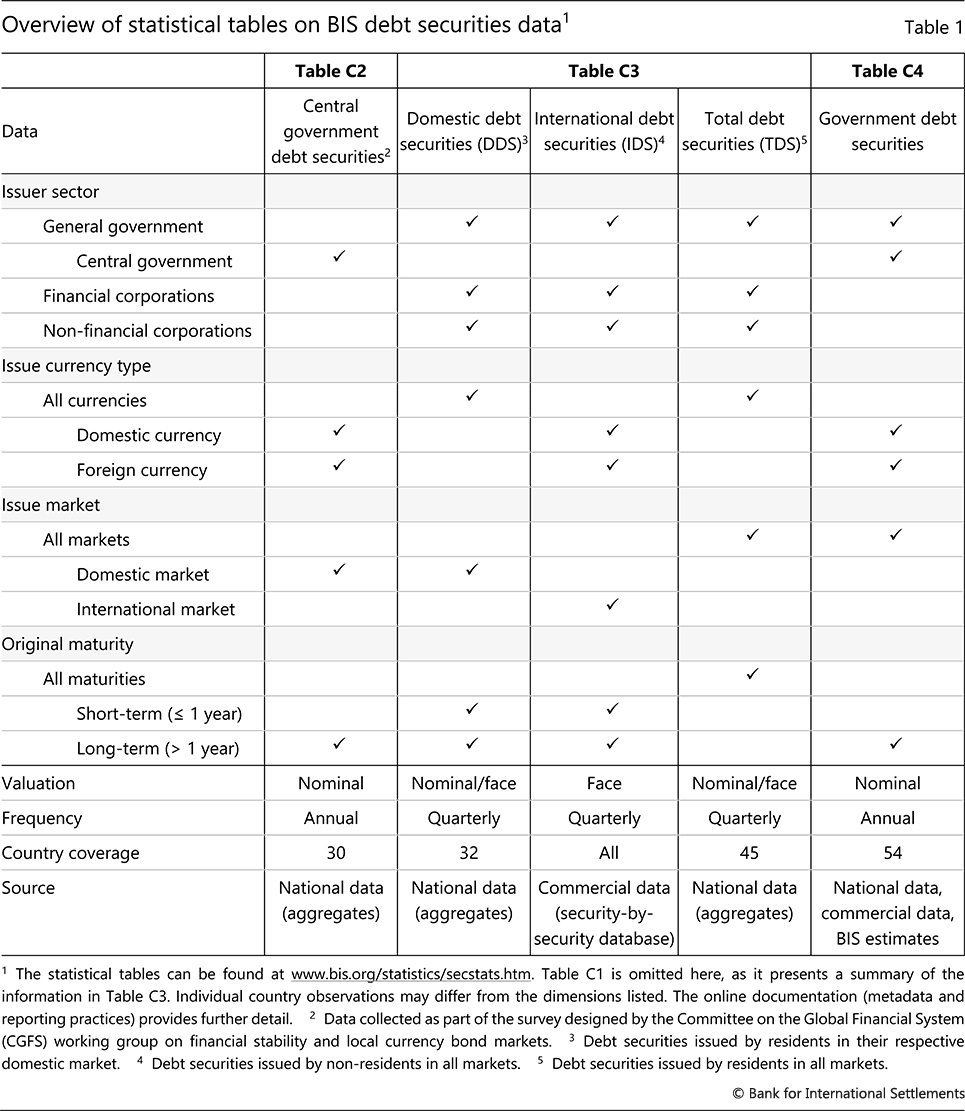
The main data source is the national aggregates that central banks report to the BIS, augmented by estimates to extend the scope and country coverage. In producing Table C4, the BIS splices reported series to match the target characteristics of the new table.8 When no matching series is reported, the BIS approximates the target using other national data or IDS. For instance, for countries reporting only a domestic market aggregate, the missing part is inferred from international bonds in the IDS.9 It is for this reason that the new statistics include estimates alongside official statistics.
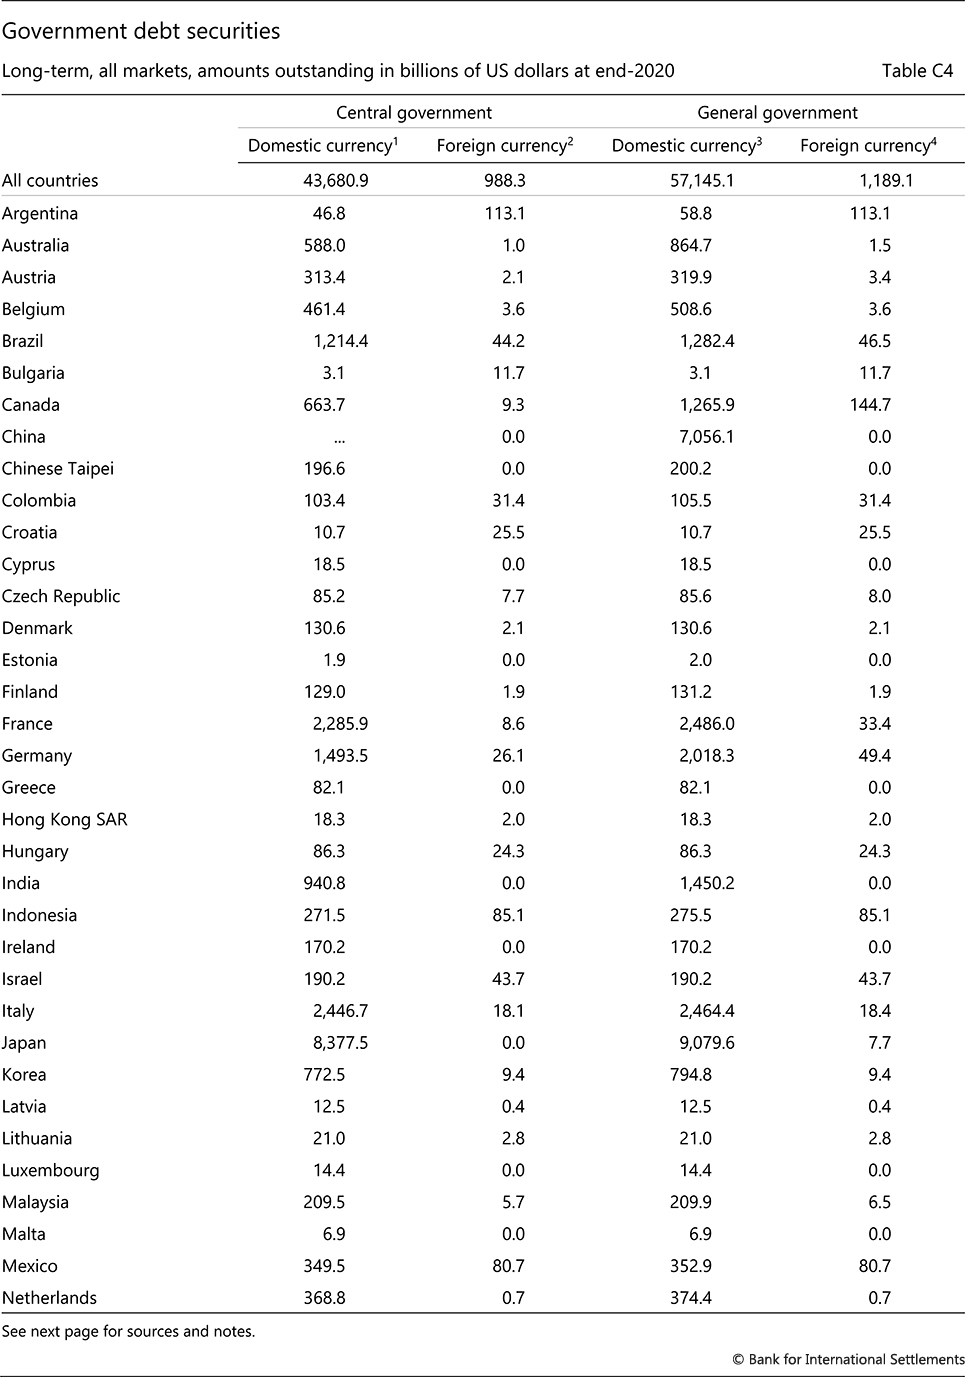
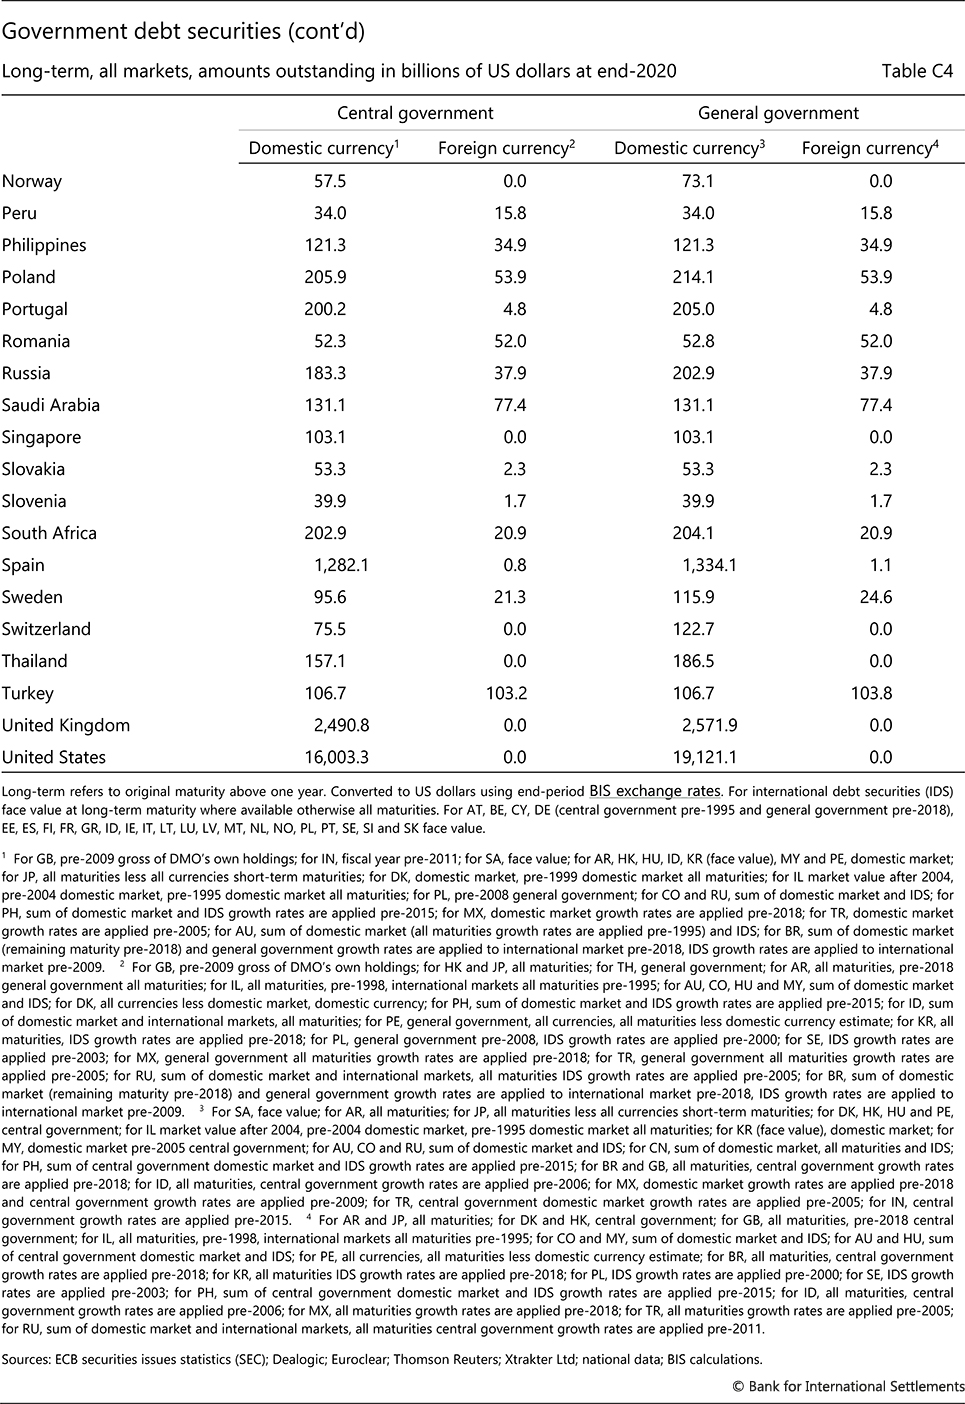
Table C4 extends the country coverage of earlier BIS tables (Table 1). The latest cross section covers 54 countries totalling $58 trillion in government bonds. The amounts outstanding are nominal values reported in US dollars, using end-of-period BIS exchange rates. Nominal values represent issuers' repayment obligation (face value plus accrued interest) vis-à-vis bond holders.10 By comparison, Table C3 covers 45 countries on total debt securities, for general government only. Table C2 covers 30 economies accounting for $25 trillion in central government bonds at end-2019, notably leaving out China, Japan and several large euro area sovereigns.
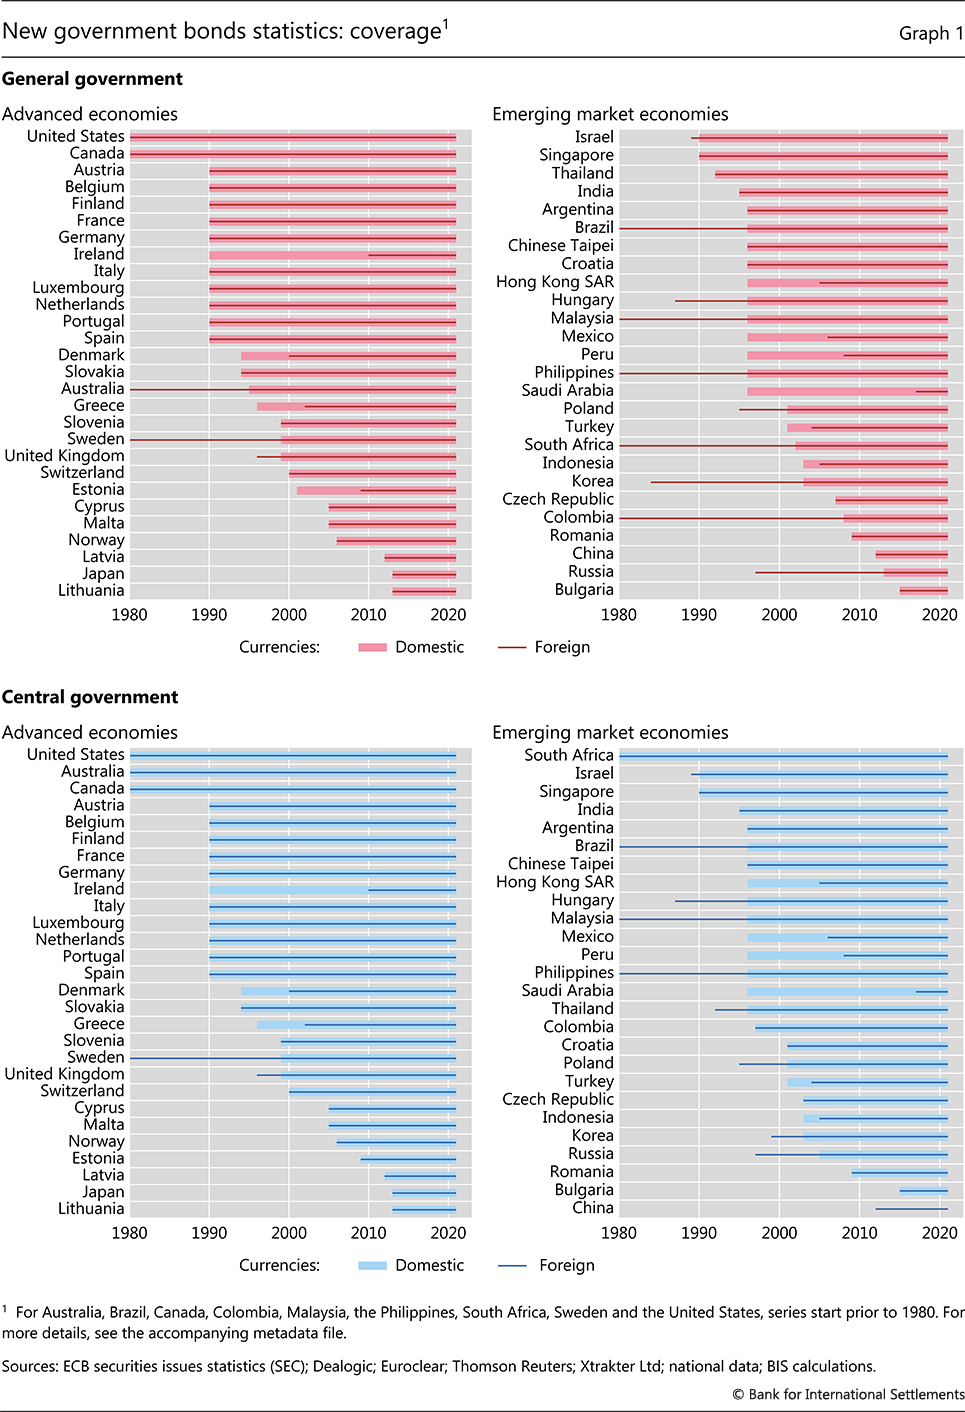
As coverage improves over time, users of the new statistics need to take account of compositional effects when forming aggregates. Graph 1 marks the periods over which the new series are available for individual countries. The top panels refer to general government bonds, the bottom panels to central government bonds. For most countries, the new series start before the Great Financial Crisis of 2007–09, often dating back to the early 2000s. However, recent additions also include major issuers. For example, Japan's series (BIS estimates) start in 2012 (left-hand panels). China has reported yuan-denominated bonds issued by the general government since 2011 (thick line, top right-hand panel) but not by the central government in particular (bottom right-hand panel).
Observations and trends
Central governments of advanced economies account for the bulk of long-term government bonds (Graph 2). Overall, AE governments account for $44 trillion of the amounts outstanding at end-2020, three times the EME total of $14 trillion (left-hand panel). In both country groups, the central government issued the lion's share of the bonds outstanding: 87% among the countries that report data on both levels of government. That said, state and local governments contribute substantially to the outstanding amounts in some countries, notably in Australia, Canada, Germany, India, Norway, Switzerland and the United States.11
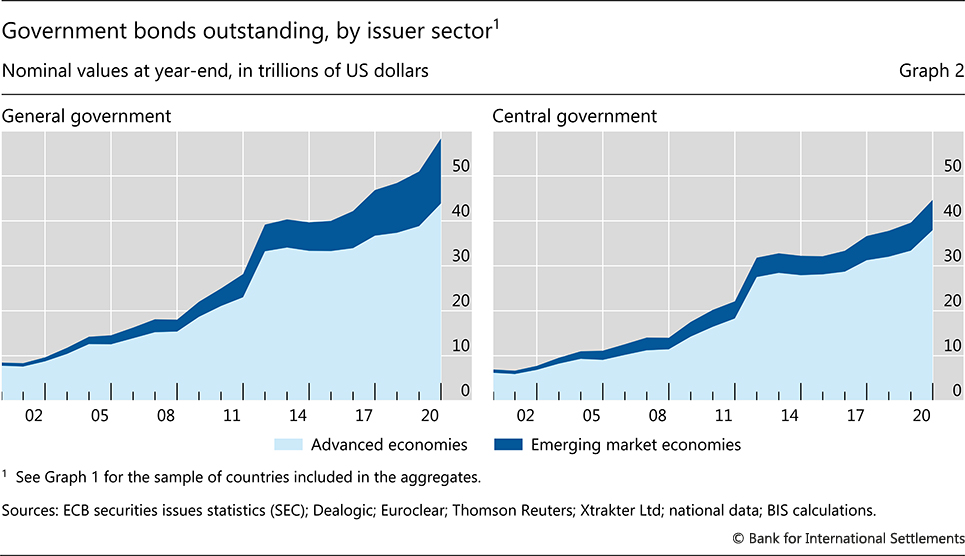
Graph 2 overstates the rise in government borrowing, as new countries have been incorporated into the total over time. For instance, Japan's inclusion in 2012 contributed $8 trillion (or 25%) to the advanced economy aggregate in that year. Similarly, China's inclusion added $1.2 trillion to general government bonds in 2011, accounting for 23% of the EME aggregate.
Yet government borrowing in bond markets has indeed been growing rapidly, as is revealed if the cross section of countries is held fixed over time. For the set of countries with data since 2012, general government bonds outstanding have increased by $19 trillion (or 49%) since that year. Similarly, holding the 2007 sample fixed shows a 129% rise in borrowing, representing an annualised growth rate of 7%.
Government bond issuance has in fact outpaced GDP over the past decade (Graph 3). For all countries combined (without holding cross sections fixed), the ratio of long-term debt securities to GDP nearly doubled in aggregate, from 38% in 2000 to 64% in 2019. In 2020 alone, the ratio jumped by 9 percentage points as GDP plummeted and governments around the world provided fiscal support to cushion the impact of the pandemic. Advanced economies saw their government-bonds-to-GDP ratio breach 90%, up from 39% in 2000. Starting from a lower base, EMEs' combined ratio doubled after 2012, to reach 45% in 2020 (centre panel).
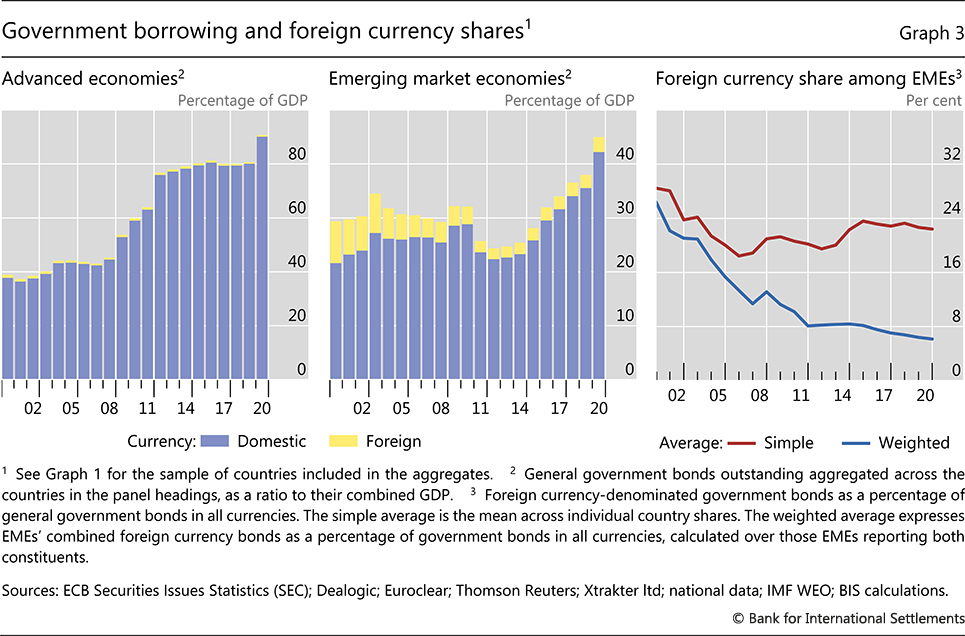
The bulk of government bonds has been issued in domestic currency over the past two decades. On the back of deep domestic bond markets, the foreign currency share of AEs' total government debt has been below 3% since the early 2000s. While the corresponding EME share stood at 26% in 2000, it has been trending down since, although at a slower pace in the most recent decade (Graph 3, right-hand panel).
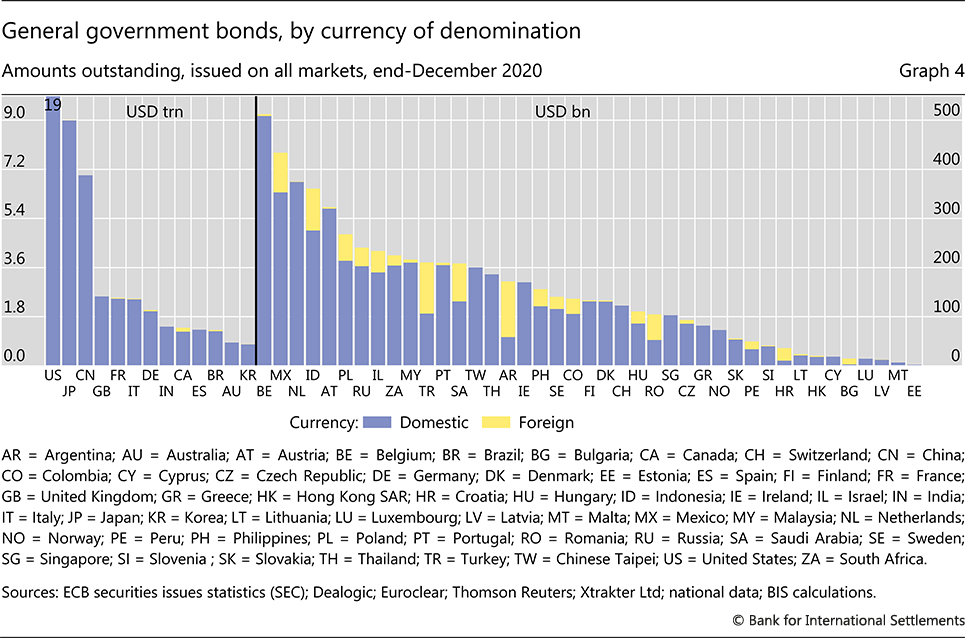
While EMEs have generally reduced their reliance on foreign currency debt issuance, there are some exceptions. The general trend stems from several major EMEs, including Brazil, Korea and Mexico, increasingly tapping bond markets in their domestic currency, and from China and India stepping up their issuance, which has been exclusively in domestic currency. The weighted average foreign currency share has extended its decline as a result (Graph 3, blue line). At the same time, greater reliance on hard currency bonds by other EMEs has resulted in a rise in the simple average (red line). Yet only five EMEs in the new data set saw a significant rise in their foreign currency share.12 Notably, Turkey's share steadily increased over the past decade, from 18% in 2010 to 49% by 2020.
At end-2020, the foreign currency share of government debt varied considerably across countries (Graph 4). Japan, Switzerland, the United Kingdom and the United States, all traditional reserve currency issuers, denominate all government debt in their own currency – as do China and India. At the other extreme among AEs are Canada and Sweden, whose foreign currency bonds make up 10% and 18% of their respective totals. Among EMEs, Argentina stands out with a foreign currency share of around 70%. Bulgaria and Croatia, with their domestic currencies being pegged to the euro, also meet the bulk of their long-term financing needs in foreign currency.
1 The authors thank Hyun Song Shin and Bruno Tissot for their encouragement and support for this project. We are grateful to the national central banks that participated in the consultation process. We also thank Claudio Borio, Stijn Claessens, José María Serena,Marjorie Santos, Jimmy Shek, Hyun Song Shin, Nikola Tarashev, Bruno Tissot and Phil Wooldridge for helpful comments. The views expressed in this article are those of the authors and do not necessarily reflect those of the Bank for International Settlements.
2 The IDS include international debt securities statistics issued outside the domestic market of the country where the borrower resides (see Box A in the Highlights in this issue).
3 In recent years, most governments have issued the bulk of debt securities in the long-term segment.
4 Table C4 is published along with historical data on the BIS website on debt securities statistics: www.bis.org/statistics/secstats.htm.
5 Table C2 also provides information on the types and average maturities of central government bonds.
6 As part of the Data Gaps Initiative (DGI), the BIS, with the assistance of the Working Group on Securities Databases, monitors the regular collection and consistency of debt securities data. The new Table C4 draws on selected DGI series, and breakdowns reported in this collection.
7 General government includes social security funds but excludes public corporations. All classifications follow the Handbook on Securities Statistics (HSS) and are thus consistent with the 2008 System of National Accounts (SNA) and the Balance of Payments Manual 6.
8 The target characteristics are as follows. Issuer sector: general government and central government; issue currency type: domestic and foreign currency; issue market: all markets (domestic and international); maturity: long-term maturities (original maturity above one year); valuation: nominal value (face value plus accrued interest).
9 An accompanying metadata table documents the data sources and indicates where estimates deviate from the target definition. In addition to the example above, common substitutions are as follows. If long-term maturity is not available, all maturities is used. Face value is used when nominal value is not available. The central government subsector replaces the general government sector where admissible.
10 The HSS recommends that debt securities issues should be recorded at both market and nominal value as both provide useful information.
11 Another reason for the difference between the amounts outstanding in the left- and right-hand panels of Graph 2 is missing series on central government bonds for China (Graph 1).
12 The count only includes countries for which the estimated linear trend in the foreign currency share is statistically significant over their respective reporting horizons: Argentina, Bulgaria, Indonesia, Saudi Arabia and Turkey.