II. Financial conditions in a changing global financial system

- Chapter II: Data behind the graphs
- Press release: Trade tensions and uncertainty cloud global economy: BIS
Key takeaways
- Since the Great Financial Crisis, the focus of financial intermediation has shifted from lending to the private sector towards financing governments. In addition, the footprint of internationally active asset managers in sovereign bond markets has grown, facilitated by FX swaps.
- Global financial markets have become more connected, which has made it easier for financial conditions to spread across borders, including to major advanced economies.
- While monetary policy retains traction on domestic financial conditions, central banks need to be attuned to changes in financial conditions in other economies and calibrate their policy actions accordingly to fulfil their mandates.
Introduction
The Great Financial Crisis (GFC) was a watershed event that set in motion two related structural changes in the global financial system which define the state of the system today. First, the focus of financial intermediation has shifted from lending to private sector borrowers to claims on the government, especially in the form of sovereign bonds. Second, non-bank financial institutions (NBFIs) have assumed a greater role. While the GFC was primarily a banking crisis in which regulated banks were the main characters, portfolio managers investing in sovereign bonds have taken centre stage in the post-GFC financial system.
The global reach of internationally active portfolio managers makes the currency dimension an integral part of their investment decisions. Many NBFIs, such as pension funds and life insurance companies, have obligations in domestic currency but hold a globally diversified asset portfolio in several currencies. Currency risk hedging is therefore a key theme, and the system has evolved to allow such hedging. In this process, the banking system has played a pivotal role by facilitating the market for foreign exchange (FX) swaps. This has made money fungible across currencies, allowing investors to gain international exposure while hedging currency risk.
This chapter explores how the reshaping of the financial system in recent years has affected the dynamics of financial conditions. One key finding is that post-GFC structural changes have led to stronger cross-country transmission of financial conditions. Furthermore, this transmission has become increasingly multi-directional. Contrary to conventional wisdom, the United States is not the only major source of international transmission of financial conditions. Instead, US financial conditions are increasingly affected by developments in other advanced economies (AEs). Yet the analysis also suggests that while external factors have a significant effect on financial conditions, domestic monetary policy still retains traction.
These findings have important implications for central banks. The increasing influence of external financial factors makes it more challenging to align domestic financial conditions with the intended monetary policy stance. To fulfil their mandates, central banks need to stay attuned to developments in the global financial system and calibrate their policy actions accordingly. The increased connectedness of global financial markets also underscores the critical role of central bank cooperation.
Structural changes in the global financial system
The GFC originated in the regulated banking sector, which had engaged in headlong expansion through the rapid growth of claims on private sector borrowers. These came mainly in the form of household mortgages and were primarily held directly on the balance sheets of regulated banks and broker-dealers. However, some were warehoused in special purpose vehicles that provided additional balance sheet capacity.1
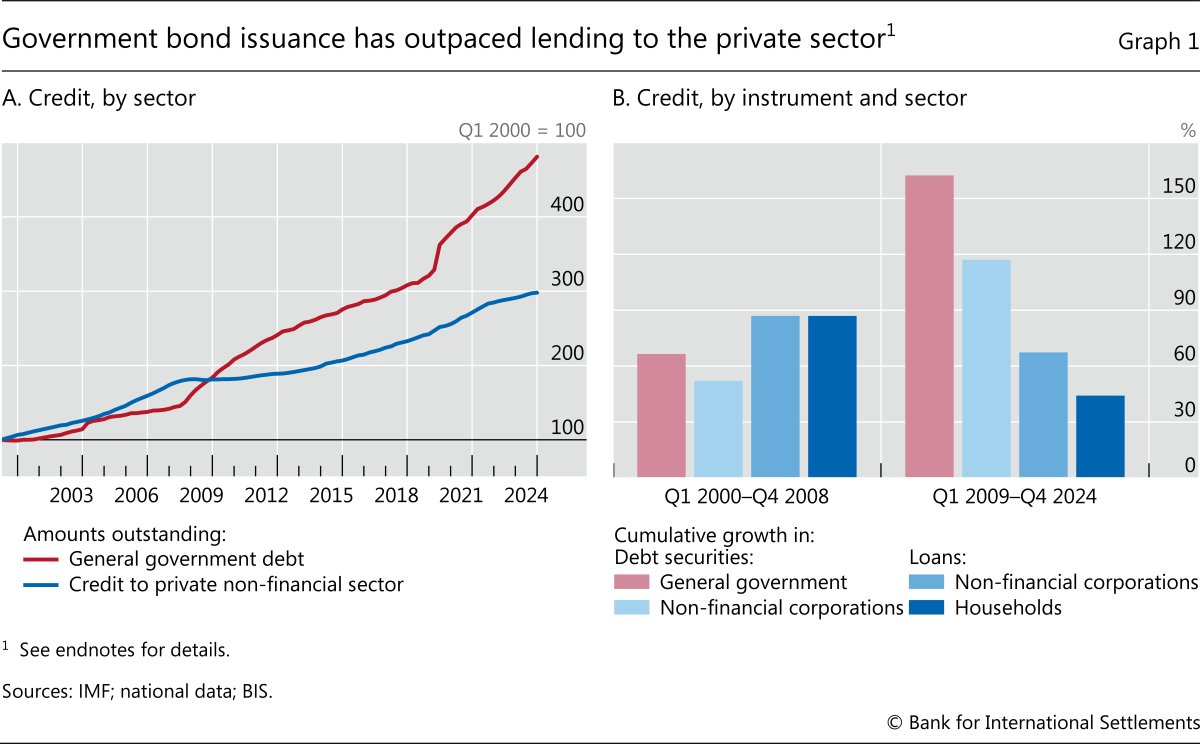
Since then, two related structural changes have shaped the global financial system. The first is the shift in financial intermediation from lending to the private sector towards financing governments. Claims on the government replaced credit to the private sector as the main driver of overall credit growth (Graph 1.A). The stock of sovereign bonds started to expand significantly in the wake of large and persistent fiscal deficits since the GFC, with an additional upward boost as a result of the Covid-era fiscal expansions. As a result, sovereign bond markets grew at a considerably faster pace than loans and non-financial corporate bond markets (Graph 1.B).
This shift has been accompanied by an increasingly central role of certain NBFIs in core bond markets. These include collective investment vehicles (mutual funds, exchange-traded funds (ETFs)), long-term institutional investors such as pension funds, insurance corporations and sovereign wealth funds, as well as hedge funds.2 As a consequence, NBFIs' footprint in the global financial system has grown considerably.3 Between 2009 and 2023, their total assets surged from 167% to 224% of global GDP (Graph 2.A). The growth in banks' total assets during the same period was more modest (from 164% to 177% of global GDP).
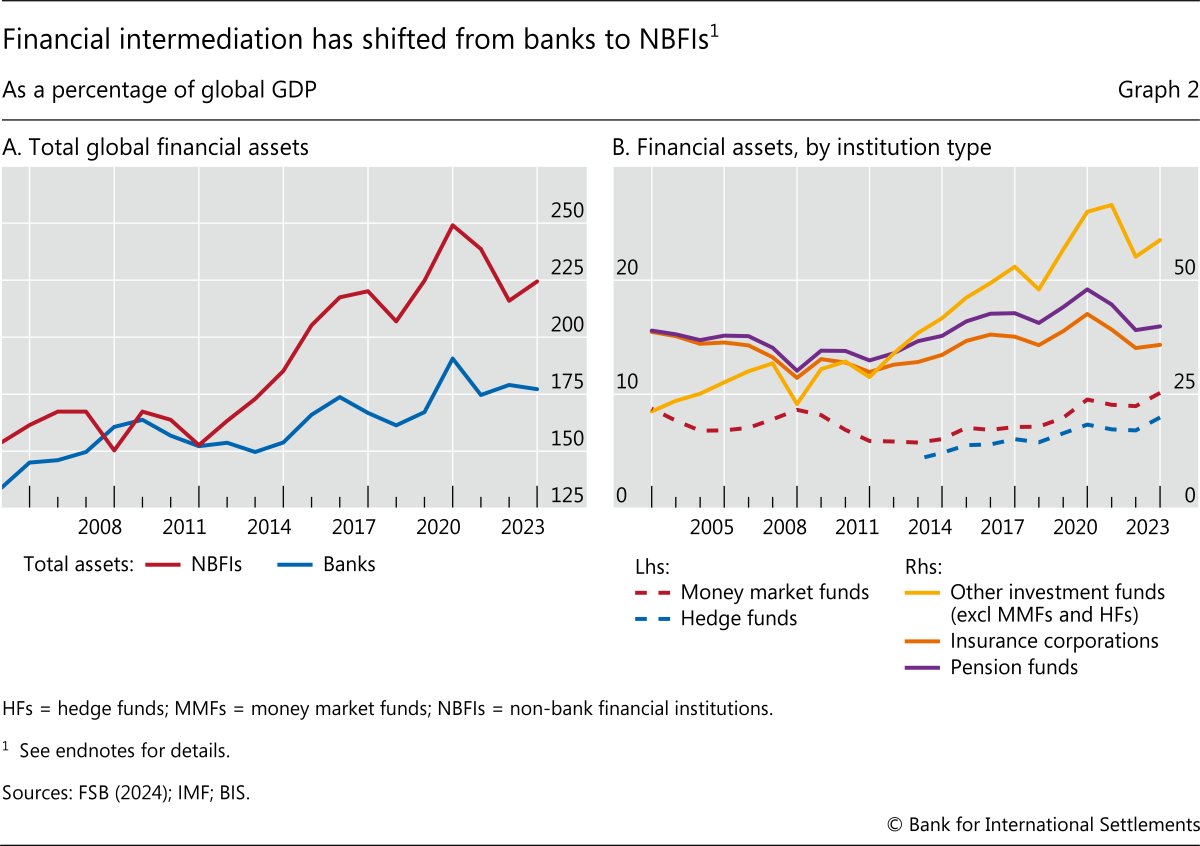
To be sure, the NBFI universe is vast and varied, covering a diverse set of players with a wide range of business models and subject to very different regulatory regimes, if regulated at all. While most NBFIs expanded post-GFC, the growth of investment funds and hedge funds has been particularly striking (Graph 2.B). Private credit is another important NBFI-related area that has grown rapidly. Private credit funds' assets under management have surged from $0.2 billion in the early 2000s to over $2.5 trillion in 2024.4
These structural changes have also been reflected in the pattern of cross-border credit flows. Before the GFC, international capital flows were mostly intermediated by banks. As a result, financial conditions were transmitted across borders mainly through the activities of internationally active banks. For this reason, the risk-taking channel, as reflected in fluctuations of global banks' leverage, was a key factor behind the co-movements in financial conditions across economies.5
After the GFC, the focus of international financial intermediation shifted from the activities of global banks engaged in cross-border lending to the activities of international portfolio investors in global bond markets.6 This "second phase of global liquidity" had several key drivers. On the borrowing side, it was largely driven by expansive fiscal policies in major jurisdictions and the surge in the supply of sovereign bonds. On the lending side, internationally active NBFIs' growth and need for diversification induced them to hold portfolios in a variety of currencies.7
Internationally active asset managers' greater role in government bond markets has been facilitated by institutional developments in capital markets, such as the increasing role of custodians, trading venues and hedging markets. Foremost among these changes has been the growth of collateralised short-term borrowing markets.
Global banks have been the pivotal players in the above areas, facilitating the expansion of internationally active NBFIs via several on- and off-balance sheet channels. Banks' on-balance sheet lending to NBFIs has grown considerably.8 Nevertheless, their off-balance sheet links with NBFIs, notably through FX swaps, are much more important (next section).
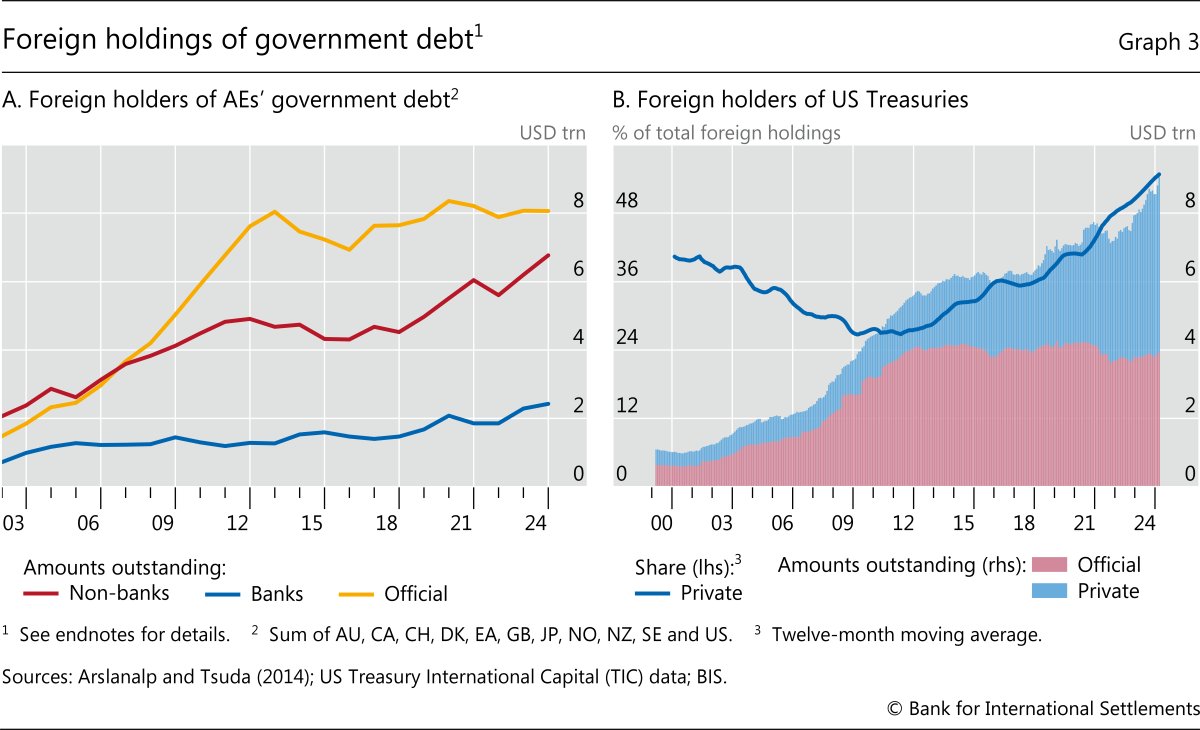
As a result of the above developments, NBFIs expanded their position as sovereigns' main foreign private creditors (Graph 3.A). More broadly, foreign private sector lenders have grown in importance relative to foreign official holders. In the US Treasuries market, the largest bond market in the world, foreign private sector lenders (mainly NBFIs) have increased their holdings of Treasuries rapidly over the past decade. During that time, their accumulation of Treasuries has considerably outpaced that of foreign official holders (Graph 3.B). As a result, they currently account for more than half of all foreign holdings of Treasuries.
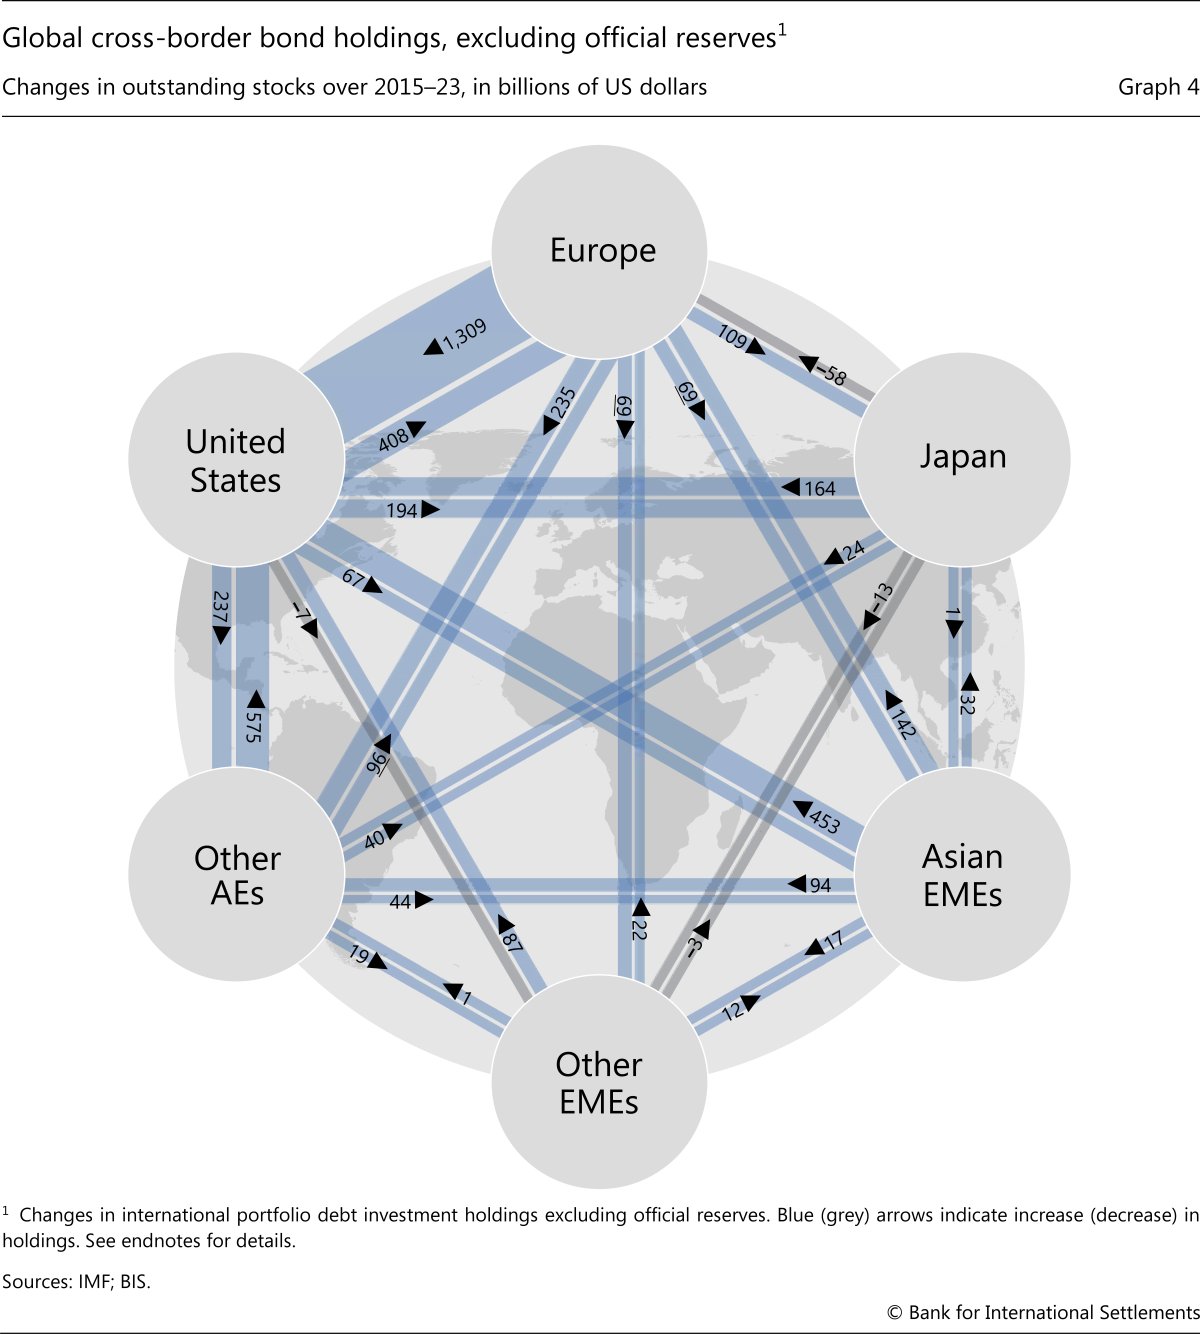
Taking a more global perspective yields a clearer picture of NBFIs' greater role in the geography of global bond markets. Graph 4 showcases the changes in private investors' cross-border bond holdings across major regions of the world between 2015 and 2023.9 Blue arrows represent increased, and grey ones decreased, holdings. The numbers do not include official reserve holdings. The largest increase in US bond holdings – of around $1.3 trillion – is accounted for by European investors. The second largest increase (of $575 billion) is due to investors from "other advanced economies". In both cases, there were also substantial bond flows in the opposite direction, from the United States to Europe and other advanced economies.
The pattern in Graph 4 strikingly illustrates why portfolio decisions should be viewed through the lens of gross rather than net positions.10 Changes in bilateral portfolio (gross) positions are only loosely related to current account imbalances and associated net capital flow positions. Indeed, many of the largest post-2015 increases in cross-border bond holdings were reported by private investors from AEs that did not run large current account surpluses during that period. This is not surprising considering that the largest internationally active NBFIs are based in AEs and naturally tend to direct their investments towards the large bond markets of other AEs. The increases in the holdings of investors located in emerging market economies (EMEs), even those running large current account surpluses, were much smaller than those of AEs. Thus, the focus on net measures like current account imbalances misses the role of large gross portfolio positions between AEs, which are key to the international transmission of financial conditions.
The FX swap market as linchpin
The global nature of internationally active NBFIs' portfolios means that currency denomination is an integral dimension of their investment decisions. For example, pension funds and life insurance companies have obligations to their beneficiaries or policyholders (and evaluate their returns) in domestic currency. Nevertheless, they hold a globally diversified asset portfolio in several currencies. Currency hedging is therefore a key theme, and the system has evolved to facilitate such hedging. In this process, the banking system has played a crucial role. Banks, as key intermediaries in over-the-counter FX derivatives markets, enable the market for FX swaps, allowing investors to hedge currency risk.
FX swaps make money fungible across currencies. An FX swap is essentially a collateralised borrowing operation. For example, a euro area pension fund borrows US dollars to invest in dollar bonds by pledging euros as collateral, with a promise to unwind the transaction at a pre-agreed exchange rate. More formally, an FX swap is an arrangement in which two parties exchange currencies at the spot rate today (spot leg) and agree to unwind that transaction (exchanging the full principal amount) at a pre-agreed exchange rate at some pre-agreed time (forward leg). Despite the full exchange of principal at the end of the contract, accounting convention does not count FX swaps as debt, but as off-balance sheet obligations (Box A).11 Currency swaps operate similarly, but typically have a longer maturity and also trade income streams from interest payments in each currency.
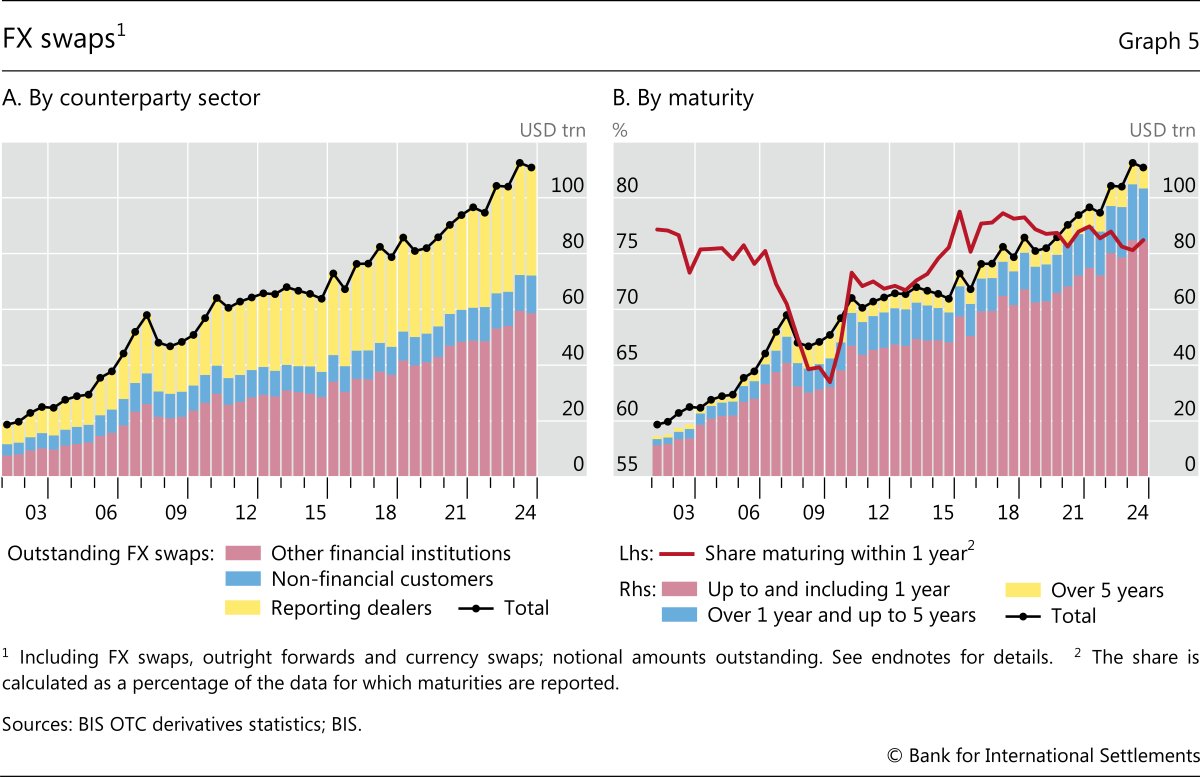
The FX swap market is large. Outstanding FX swaps (including forwards and currency swaps) reached $111 trillion at end-2024, with FX swaps and forwards accounting for roughly two thirds of that amount.12 The largest and fastest growing segment has been contracts with "other" (ie non-dealer) financial institutions (OFIs), primarily NBFIs (Graph 5.A, red bars). This segment has nearly tripled in size since 2009. Roughly 90% of FX swaps have the dollar on one side, underlining the currency's linchpin role in the global financial system. Over three quarters of all outstanding FX swap contracts have a maturity of less than one year (Graph 5.B).13
FX swaps have enabled internationally active NBFIs (eg asset managers, hedge funds, pension funds) to increase their cross-currency bond investments by making the universe of bonds across the world more accessible on a hedged basis. FX swaps have thus been a crucial factor fostering the globalisation of sovereign bond markets. Given US capital markets' centrality in the global financial system, FX swaps have particularly facilitated greater access to US dollar-denominated bonds, especially Treasuries.
Data on FX swaps can enhance tracking and understanding of cross-currency portfolio flows. Since accounting rules leave FX swaps off balance sheet and do not treat them as debt, most data sets do not comprehensively capture NBFIs' cross-currency investment. BIS data on the outstanding notional values of FX swaps, broken down by currency and counterparty sector (with NBFI positions captured in the OFI segment) fill an important gap by capturing the currency exchange behind such investments. Data sources on the underlying cross-border portfolio investment (eg the IMF's Portfolio Investment Positions (PIP) and the US Treasury International Capital (TIC) System) cannot speak to the funding currency of the investors (and thus the degree of cross-currency investment in which they engage). They often do not cover a sufficiently long time span of NBFIs' bilateral exposures and cannot see through to the ultimate investor for flows re-routed via financial centres. NBFIs' FX swaps by currency proxy for the home currency of the investor and thus provide complementary information on the underlying portfolio flows through the lens of the accompanying hedging activity. In addition, they capture the large gross off-balance sheet positions from FX swaps that are not recorded in such cross-border investment due to their accounting treatment. These data therefore deepen our understanding of how bilateral NBFIs' portfolio flows can trigger cross-border spillovers and shape global financial conditions.
Indeed, the fluctuations in FX swap volumes reflect non-US investors' appetite for dollar bonds and hence mirror the fluctuations in portfolio flows into the United States. Graph 6.A provides evidence that portfolio flows into US debt securities from major AEs co-move with the volume of FX swaps used by NBFIs. FX hedging is critically important to many NBFIs that have less discretion to have exchange rate exposures in their portfolios, such as pension funds and insurance companies. For NBFIs with more latitude, hedging currency risk is still prudent from a risk management perspective.
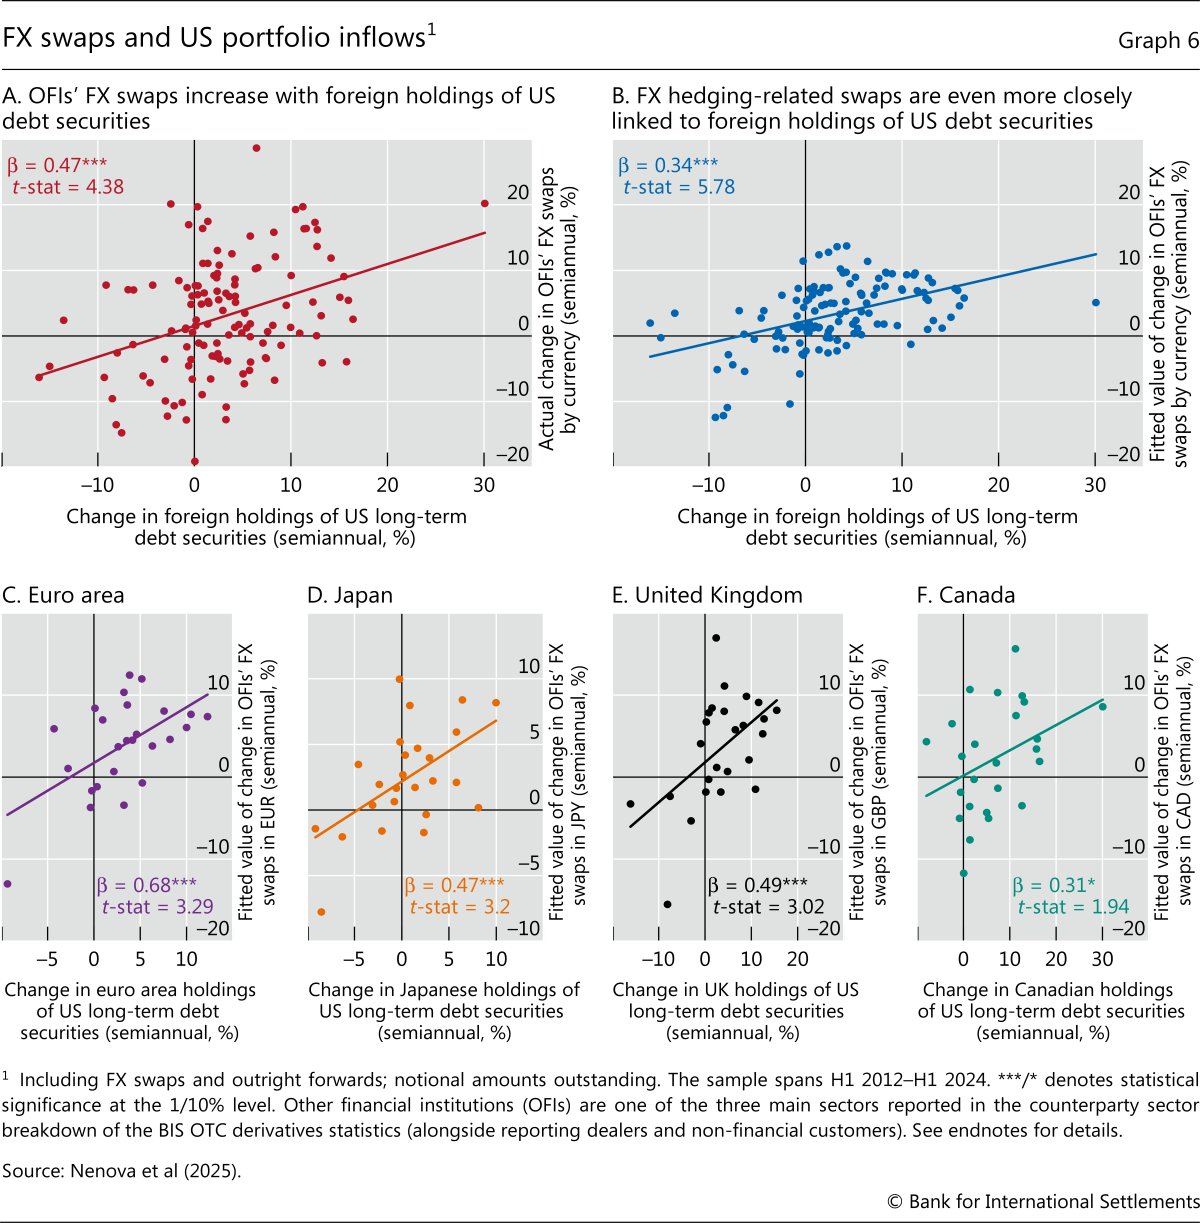
Digging deeper, further evidence that FX swaps enable portfolio flows across economies comes from the stronger relationship between FX swap growth and portfolio flows once the cost of hedging is taken into account. As FX swaps tend to be short-term contracts, the key input in the cost of hedging is the short-term interest rate in the destination currency (in relation to the short-term rate in the investor currency).14 In addition, since investors predominantly use short-term FX swaps to hedge longer-term portfolio investments, hedged investment becomes less attractive when the short-term interest rate increases or the long-term bond yield falls, ie when the yield curve in the destination currency flattens (see Box A for more details on the hedging cost components). Taking account of these hedging costs provides even clearer evidence of the close empirical relationship between portfolio investment and hedging-related changes in FX derivatives (Graph 6.B). More directly, this relationship also holds separately for investors from four other (non-US) major currency-issuing jurisdictions with FX swaps in those currencies (Graphs 6.C–F). This link between FX hedging and bond flows highlights an important channel through which financial conditions can transmit across countries, and to AEs in particular (Box A).
Implications for financial conditions
The structural changes outlined in the previous section have important implications for central banks' pursuit of their macroeconomic and financial stability mandates. Maintaining macroeconomic stability hinges on the pass-through of monetary policy actions to financial conditions, which in turn affect the availability and cost of financing for real economic activity.15 Market-based finance ties financial conditions more closely to market prices of all kinds, which tend to be more volatile than bank lending rates. This potentially makes them more sensitive to shocks, including those originating abroad.
The sovereign yield curve is a key channel of monetary policy transmission, as it underpins all rates on riskier assets in an economy. Central banks influence it by steering reference overnight rates and by shaping expectations on the evolution of short-term rates, as well as by directly affecting yields through balance sheet policies. But risk premia also shape broader financial conditions, such as the rates and prices firms and households face in their saving and borrowing decisions. These, in turn, are driven by swings in risk attitudes, as well as the risk-bearing capacity of NBFIs, especially in the case of market-based financing.16
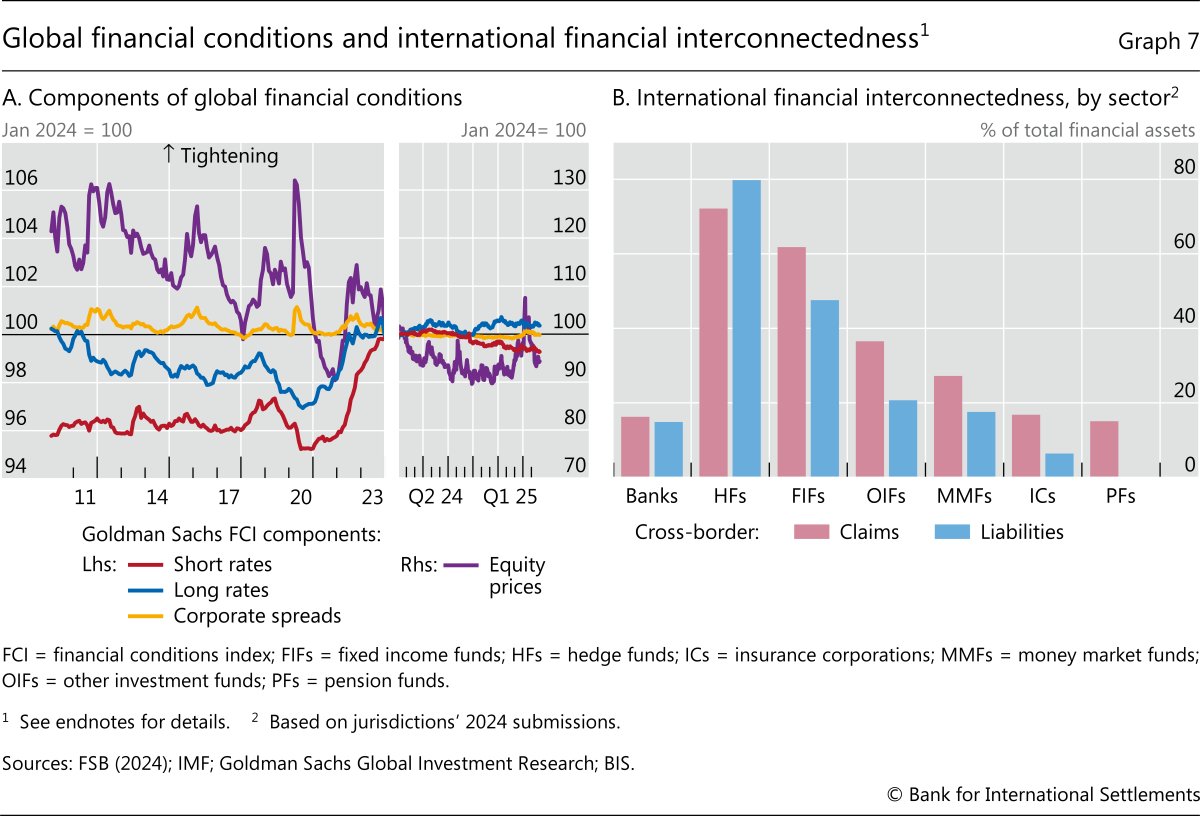
When the monetary policy stance is tightened, risk premia typically rise. This is because financial market participants moderate their risk-taking, not least due to the anticipation of a slowdown in real economic activity. Yet risk appetite may remain elevated even amid a policy tightening in certain circumstances. For example, this may occur when other factors support greater risk-taking in certain financial market segments – such as frothy equity valuations due to excessive optimism over the prospects of certain businesses. If so, different "ingredients" of aggregate measures of financial conditions would drag in opposite directions. Both the post-GFC and post-Covid periods are examples of such a configuration, which is also visible in the divergent behaviour of various elements of broader financial conditions in recent years (Graph 7.A). Looking more closely at the latest readings, in the first half of 2024 short- and long-term government bond yields increased, tightening overall financial conditions. Nevertheless, credit spreads stayed compressed and equity prices surged, pushing financial conditions in the opposite (easing) direction. Subsequently, as central banks started to lower policy rates, the short-term rate component of financial conditions eased, while long-term rates increased on the back of higher termpremia.17
When the underlying components diverge, aggregate indices of financial conditions will be subject to forces pulling in opposite directions and hence may be difficult to interpret. For this reason, it is illuminating to organise the data in a way that highlights the key determinants of financial conditions. In this spirit, the BIS has developed a factor model of financial conditions, where market variables are gathered so as to distil two main factors: one capturing the dynamics of the level of interest rates and safe yields and the second capturing riskier market segments. Indeed, measuring financial conditions using a broad range of data reveals a relatively simple two-factor structure (Box B). The first (the "level factor") broadly reflects the level of various interest rates, while the second (the "risk factor") is more connected to risk perceptions and risk appetite, depending broadly on the dynamics of spreads and equities. Hence, swings in risk attitudes and risk perceptions have a bearing on overall financial conditions. And, in turn, financial conditions are more susceptible to those swings in an environment where market financing becomes more prominent.
Internationally active asset managers are a key conduit for transmitting financial conditions across countries.18 Indeed, they tend to be much more internationally interconnected than traditional financial intermediaries (Graph 7.B). Hedge funds and other investment funds are both highly internationally interconnected NBFIs, and their portfolios tend to adjust most rapidly to swings in risk attitudes and perceptions.19 When risk appetite is high, cross-border positions of global investors are likely to build up quickly. But they can unravel suddenly, leading to fire sales and sharp drops in asset prices in different markets. In both phases, significant cross-border flows by asset managers may boost cross-country co-movements in financial markets.
One implication is that NBFIs' greater role in global portfolio flows may have contributed to more correlated financial conditions across countries. As a first indication, the cross-country co-movement of key asset returns, measured by the share of variance explained by the first principal component of the individual country returns, has increased in recent years (Graph 8.A). This is especially the case for government bond yields and corporate spreads. Hence, the co-movements of composite measures of financial conditions have also generally risen over the past five years. The most recent manifestation of this phenomenon occurred in May 2025, when long-dated government bond yields spiked synchronously in several major AEs.
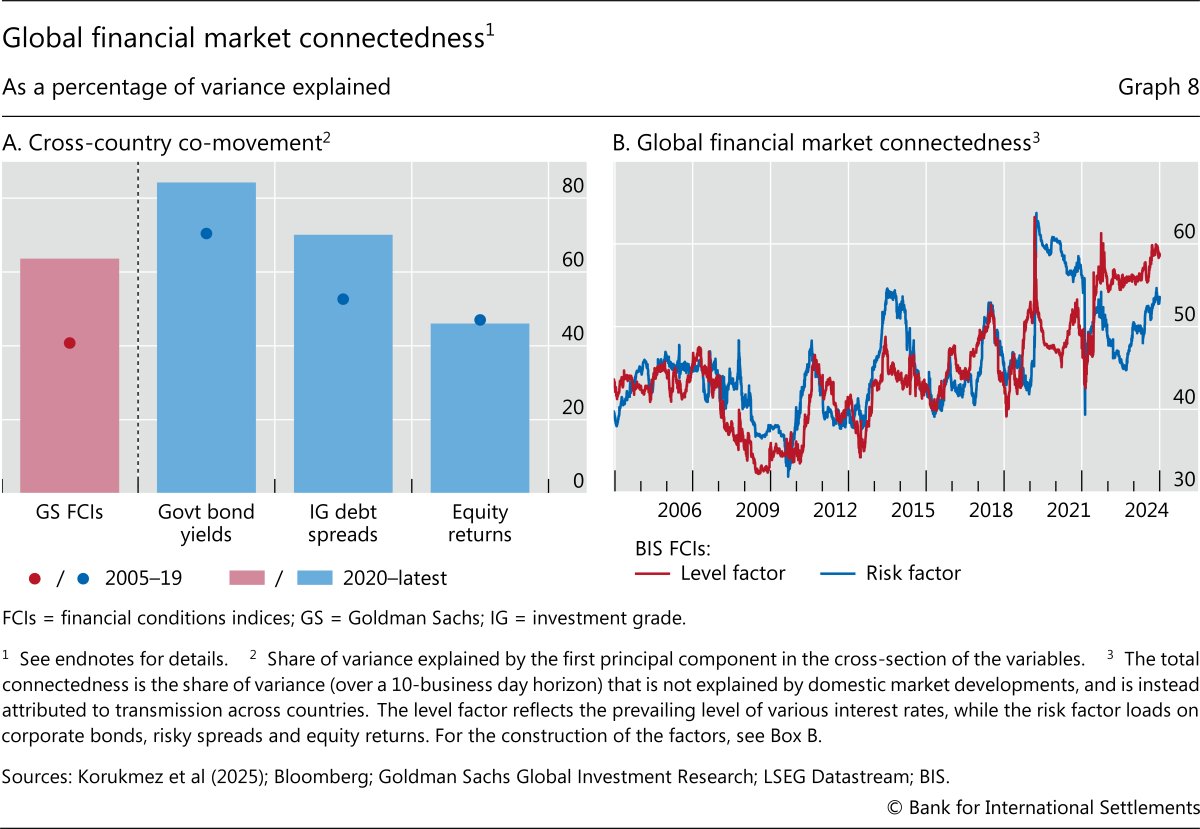
Increasing global co-movement of financial conditions is also captured by time-varying measures of global financial market connectedness. These measures aim to capture not only contemporaneous co-movements, but also the international transmission of financial conditions over a given time horizon. More specifically, we consider the share of variance that is explained, over a 10-day horizon, by market fluctuations transmitting across countries, as opposed to purely domestic ones.20 Graph 8.B shows such measures for the level and risk factors of FCIs (as described in Box B). These connectedness measures vary substantially over time, spiking during times of financial stress, but have been growing since the GFC. For example, at the beginning of the pandemic over 60% of the variability of the FCI risk factors (blue line) could have been explained by the overall connectedness across markets; that share was below 50% at the height of the GFC. The connectedness in the FCI level factor (red line) tends to be somewhat lower, even though it has recently increased in the wake of the synchronised monetary easing and tightening triggered by the pandemic and the ensuing inflation surge.
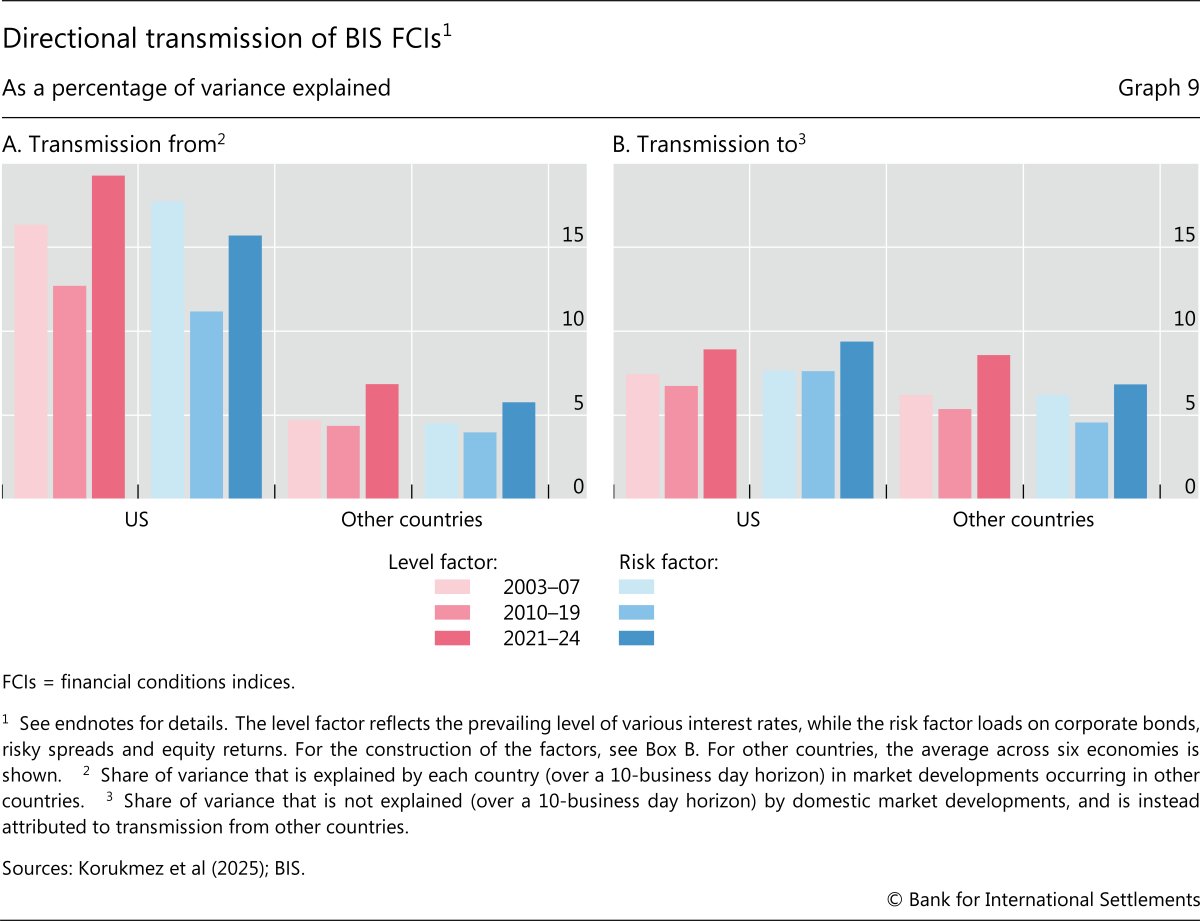
The directional transmission of financial conditions across jurisdictions has also evolved over time. Consistent with a large literature documenting powerful global transmission of US financial shocks,21 the United States tends to transmit its financial conditions to other countries more than the other way around (Graph 9). But in aggregate, other countries role as sources of transmission of financial conditions has been growing for both the level and risk factors. This is true not only in terms of the United States becoming more susceptible to developments in other countries, but also of the mutual connectedness across other countries.
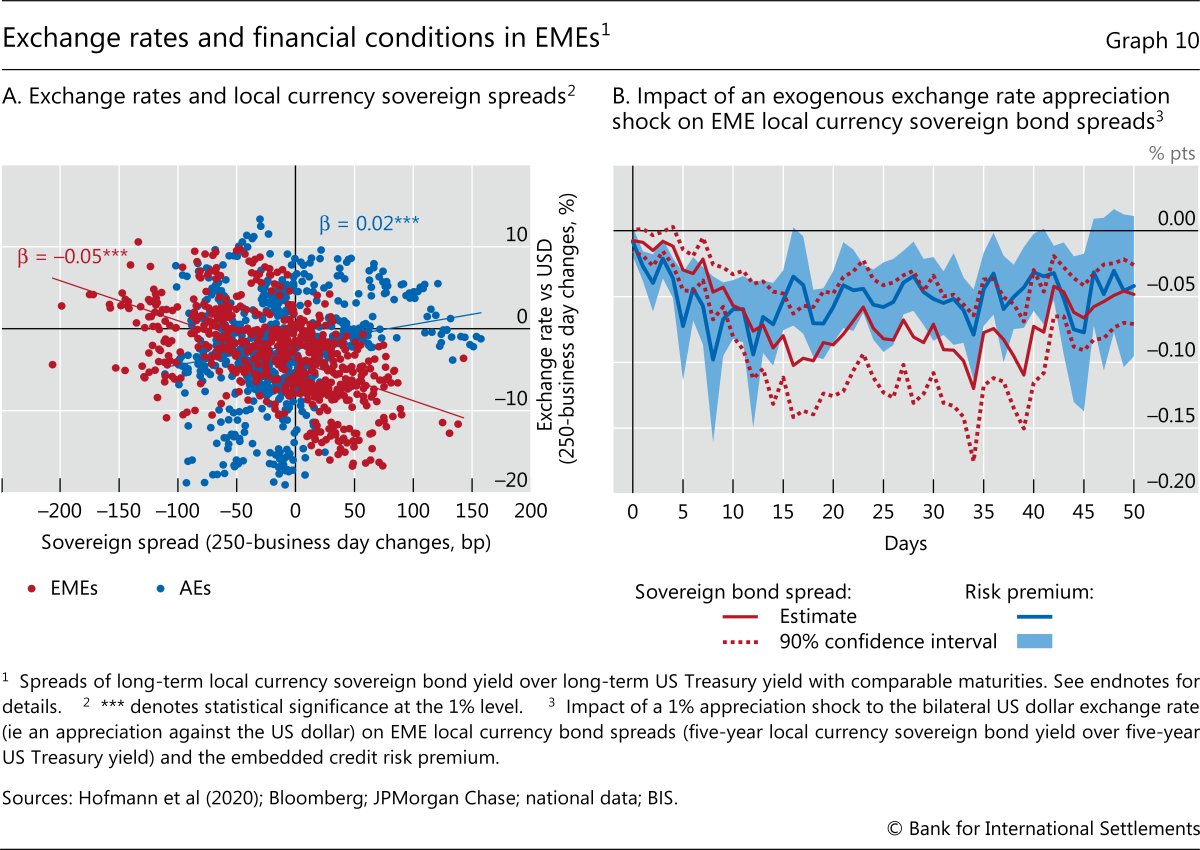
The exchange rate plays an important role in the global propagation of financial conditions, in particular for EMEs. Traditionally, EME sovereigns were able to borrow from abroad only in foreign currency, mainly with dollar-denominated bonds.22 In this situation, any change in foreign financial conditions or the exchange rate was directly transmitted to domestic financial conditions. The deepening of local currency sovereign bond markets has gradually enabled many EME sovereigns to borrow from abroad in local currency. But foreigners' investments in these markets are typically unhedged due to thin hedging markets and carry trade motives. The currency exposure has thus migrated from the borrowers' balance sheets to those of investors who fund themselves and evaluate gains and losses in a different currency. Hence, exchange rate changes, especially vis-à-vis the US dollar, affect the balance sheet valuations of foreign lenders and potentially their supply of credit to EMEs. This gives rise to a broader financial channel of the exchange rate that also influences EME local currency bond markets.23
These effects are reflected in the links between exchange rate movements and financial conditions in EMEs. Consistent with the financial channel of the exchange rate, there is a highly significant systematic negative correlation between changes in the value of an EME's domestic currency against the US dollar and changes in the EME's local currency sovereign bond spreads over US Treasury yields (Graph 10.A, red dots). This pattern is absent in AE spreads (blue dots). There is also formal empirical evidence that exchange rate appreciation of EME currencies is associated with a significant drop in local currency bond spreads (Graph 10.B, red line). This drop turns out to be driven by lower credit risk premia embedded in sovereign bond spreads (blue line), consistent with the idea that risk perceptions play a key role in the international transmission of financial conditions.
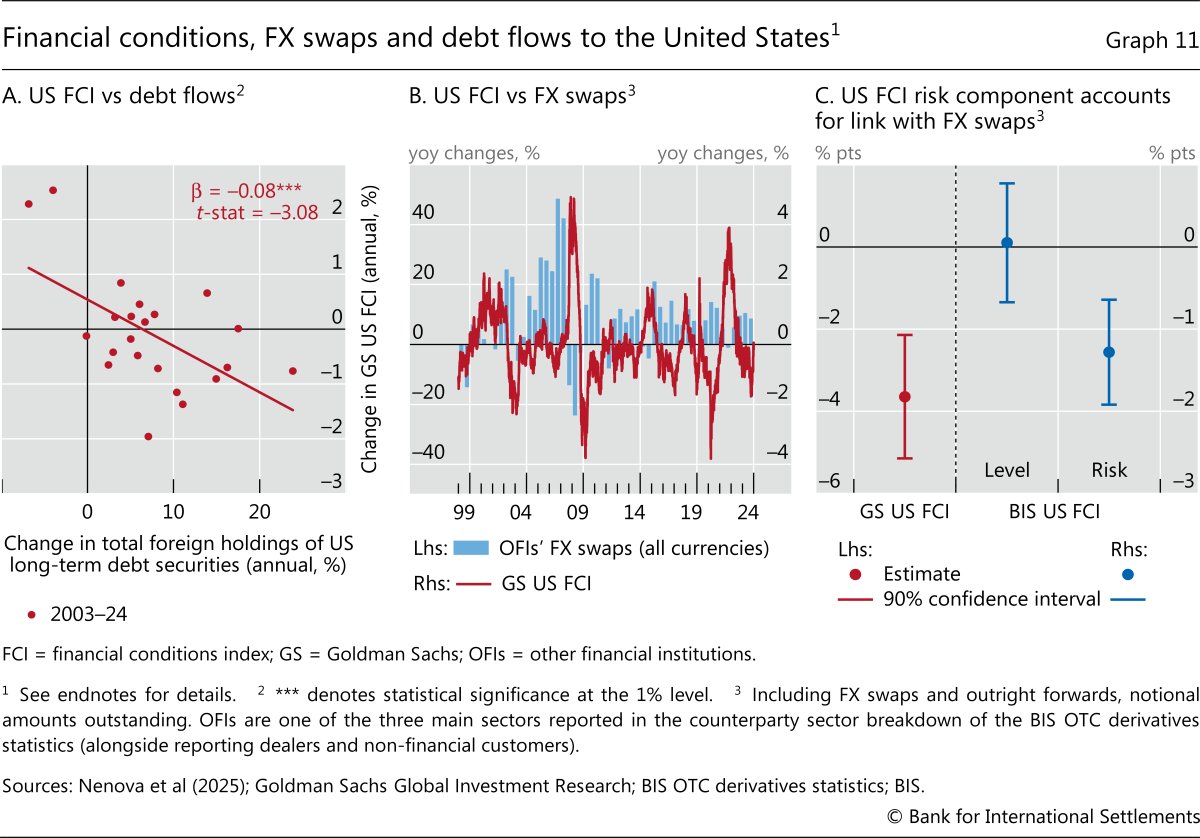
For foreign portfolio flows to AEs, hedging of currency risk is more common as carry trade motives are typically less strong and currency hedging markets are better developed for large AE currencies. Here, NBFIs' activity in FX derivatives markets offers a lens through which to evaluate the link between foreign portfolio flows and financial conditions. Indeed, there is a significant negative correlation between portfolio bond flows into the United States on the one side, and US financial conditions as measured by the Goldman Sachs index on the other (Graph 11.A). One interpretation of this link is that international spillovers affect even US financial conditions via the international portfolio flows coming from other AEs.
FX swap volumes are closely related to these portfolio flows from AEs to the United States, because they enable the FX hedging of cross-border portfolio exposures (as discussed in the previous section and Box A). Graph 11.B highlights the close link between US financial conditions and OFIs' FX swap activity. These patterns suggest that NBFIs' hedged portfolio investment in international bond markets goes hand in hand with looser financial conditions. Indeed, the regression results, reported in detail in Box A, confirm that the negative co-movement of FX swaps with the US FCI is significant even after taking into account other key drivers of NBFIs' FX hedging demand (regression coefficient on the left-hand scale of Graph 11.C). Yet international transmission via FX-hedged cross-border portfolio investments seems to reflect only changes to the risk factor. This suggests that shifts in global investors' portfolio allocation are mainly related to swings in risk appetite and perceptions.
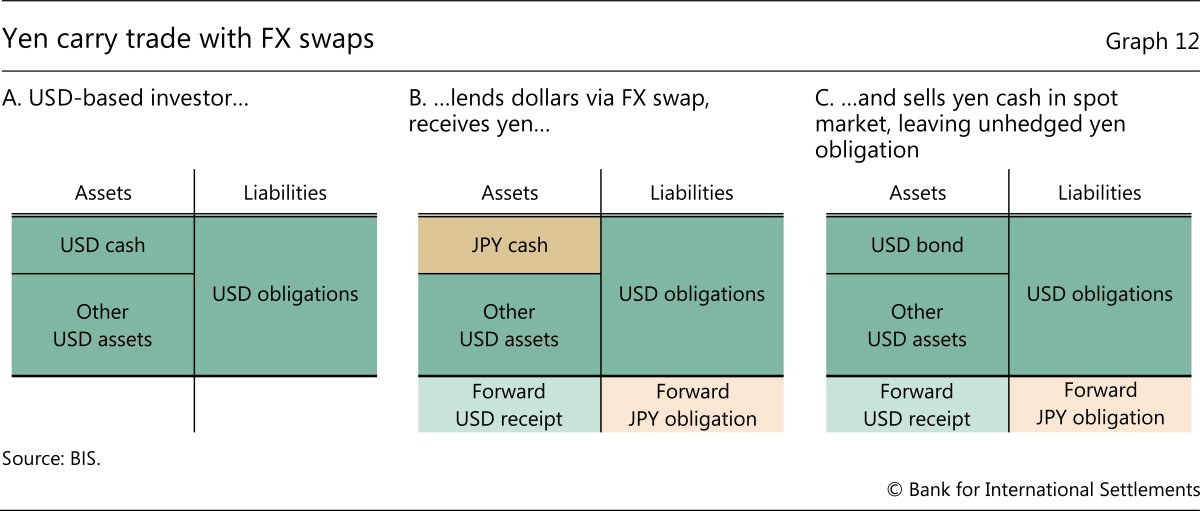
While portfolio flows between AEs tend to be accompanied by hedging of currency risk, large interest rate differentials can nevertheless set in motion unhedged flows motivated by carry trades. When risk appetite recedes, the unwinding of such trades can strengthen the transmission of financial conditions. These trades are often constructed synthetically, using derivatives like FX swaps and outright forwards. Consider a dollar-based investor (Graph 12.A). This investor provides dollars in an FX swap transaction and receives yen, agreeing to repay the yen at a future date (Graph 12.B). However, instead of using the proceeds to obtain safe yen-denominated assets in anticipation of the yen repayment, the yen proceeds of the swap could be sold in the spot market for dollars. These dollar sums could then be further invested in a higher-yielding asset, such as a US dollar-denominated bond (Graph 12.C). This could also extend to investing in local currency EME sovereign bonds. This sequence of transactions leaves the investor with an unhedged short yen obligation – a carry trade. It is also common to obtain this carry trade position with a forward contract, which is then rolled over using FX swaps, or via other instruments like options.24
The impact of the recent yen carry trade episode on financial conditions in the United States is a notable illustration of the transmission of domestic financial shocks across major AEs.25 Despite the post-Covid tightening of US monetary policy, financial conditions in the country had remained fairly loose. This was in part due to the transmission of easier financial conditions from Japan to the United States (Graph 13.A). In August 2024, a partial but sudden unwinding of yen carry trades triggered further spillovers of external financial conditions into the United States – this time in the opposite (ie tightening) direction. The transmission of financial conditions from Japan to the United States appears to have in part been channelled by leveraged trades of speculative investors like hedge funds that used yen funding and their subsequent (partial) unwinding.26
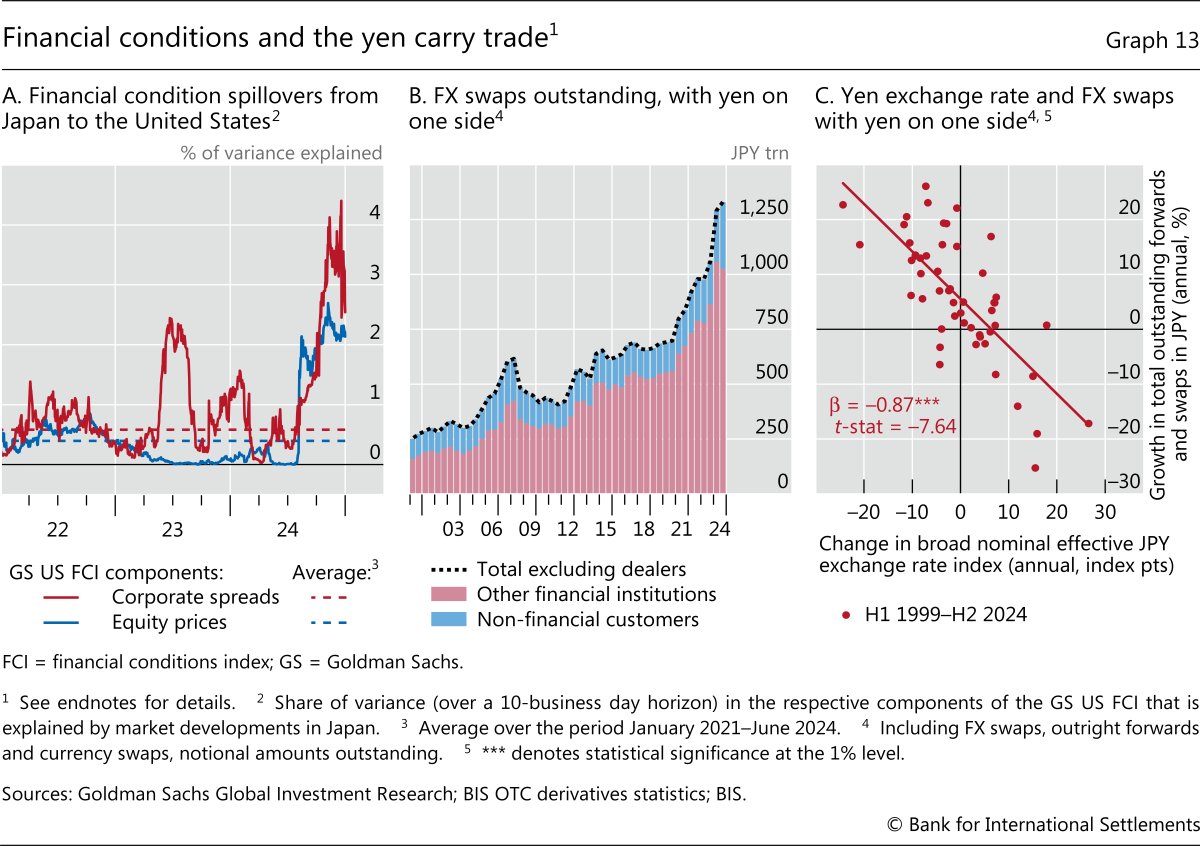
The dynamics of FX swaps in yen provide a useful, albeit rough, indication of the relative size of those yen-funded trades.27 They rose sharply during the 2023–24 period when the above indicators (of the transmission of financial conditions from Japan to the United States) spiked (Graph 13.B). In the end, the August 2024 turbulence was short-lived and had limited effects. Nevertheless, the episode illustrates the importance of vigilance in the rising carry trade totals that are vulnerable to rapid reversals.
Besides carry trades, the proceeds from yen borrowing have been deployed to fund a wide array of positions. This has included a broad range of risky asset positions (eg AE equities), in which investors have taken advantage of cheap yen funding while hedging the FX risk. Indeed, FX swaps in yen tend to expand when the broad yen index falls, as financial institutions seek to hedge their yen-funded investments in other currencies (Graph 13.C).
The analysis above underscores the highly connected nature of global financial markets and highlights how domestic financial conditions can be significantly shaped by foreign developments.28 This raises the question whether monetary policy's influence on domestic financial conditions has become more limited.
Empirical evidence for relatively small AEs and EMEs suggests that foreign factors have a significant effect on their financial conditions, yet domestic monetary policy retains firm traction (Graph 14).29 The analysis considers the effects of unexpected changes in short-term policy rates, which can be constructed for a broad sample of countries. In both AEs and EMEs, monetary policy exerts a significant influence on domestic short- and long-term government bond yields. As expected, the impact is more pronounced at shorter maturities but remains significant at longer maturities as well. The effects generally exceed the spillover effects from abroad, proxied here by US monetary policy.30 Overall, this suggests that domestic monetary policy retains strong sway over the domestic government bond yield curve.
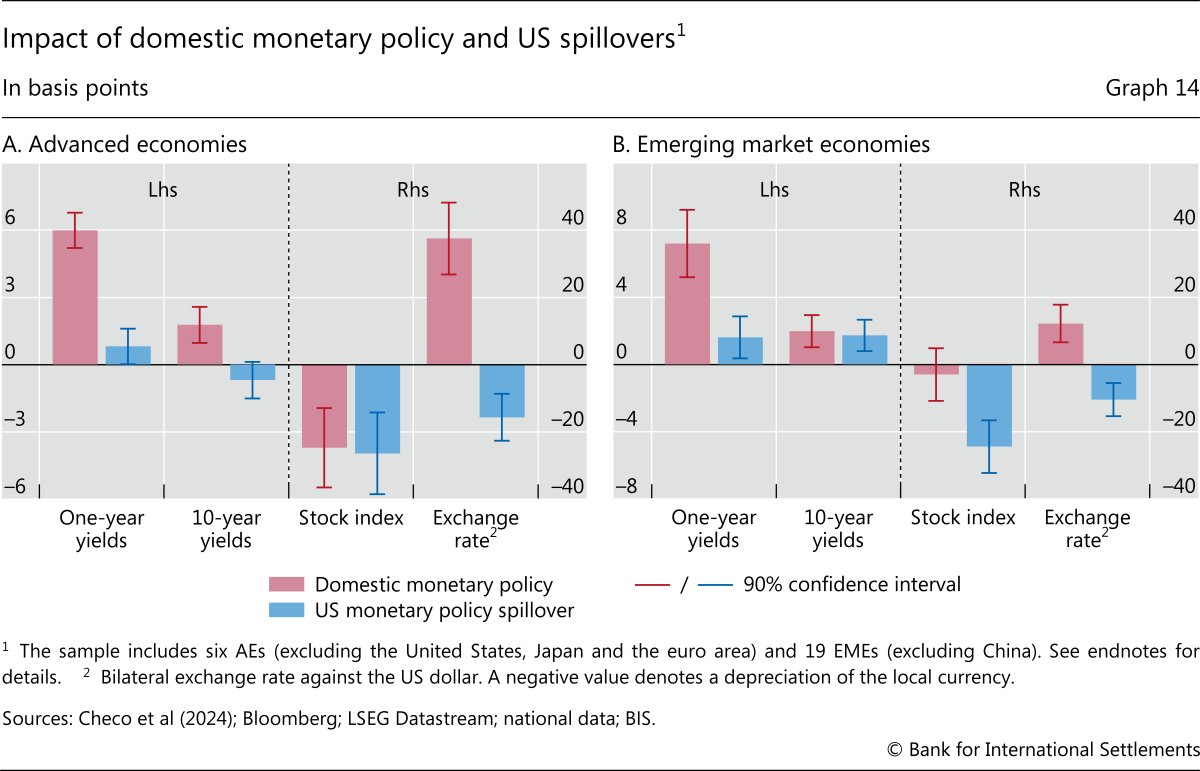
However, the empirical evidence also highlights some limitations regarding the transmission of monetary policy to risky asset classes, especially in the case of EMEs. For example, stock prices tend to be more heavily affected by global financial conditions (represented here by US monetary policy shocks) than domestic monetary policy. Furthermore, exchange rates tend to be equally influenced by domestic monetary policy and global financial shocks. More generally, global spillovers tend to affect financial conditions more rapidly than domestic monetary policy, complicating timely policy responses.31
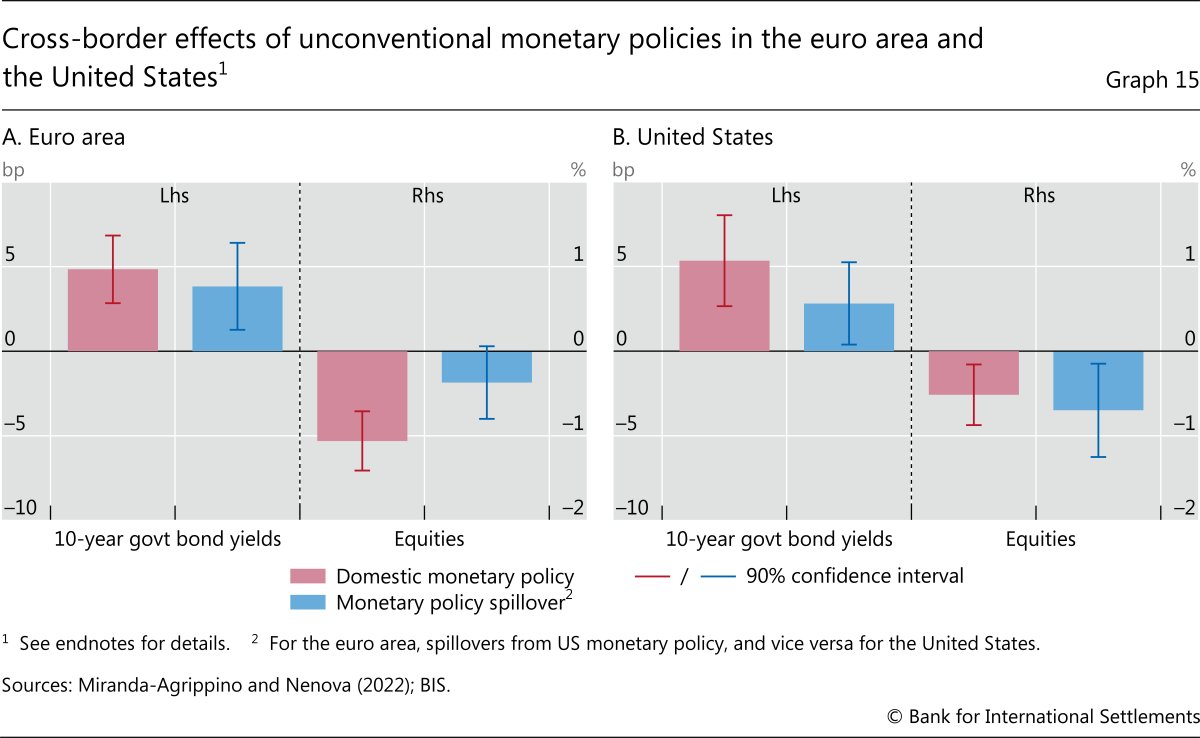
As highlighted above, the cross-border transmission of financial conditions is not limited to small open economies but can also affect major AEs. At the same time, evidence for major AEs also suggests that monetary policy retains good traction relative to the spillovers. In particular, examining the effects of unconventional monetary policy measures in the United States and the euro area (Graph 15) shows that these policies have significant domestic effects on both government bond yields and stock prices. However, the cross-border spillovers – both from the United States to the euro area and vice versa – are in some cases comparable with the effects of domestic transmission. The growing role of internationally active NBFIs has probably played an important role in shaping these patterns.32
Conclusions
The global financial system has undergone profound structural changes since the GFC, with internationally active portfolio managers investing in sovereign bonds playing a much more central role. These changes have been facilitated by the expansion of FX swap markets that enable asset managers to invest globally while hedging currency risk.
As a result, financial shocks – especially those stemming from changes in risk capacity – can now transmit more strongly across borders, at times moving domestic financial conditions away from the intended monetary policy stance. This chapter has shown how developments in financial conditions can be viewed through the lens of two factors: one related to the level of risk-free rates, and the other to risk attitudes and perceptions. Cross-border spillovers in the risk factor, especially those occurring at times of swings in risk preferences, raise the chances of a disconnect between broader financial conditions and the desired monetary policy stance. While these issues have long been examined and discussed in the context of EMEs, they have become increasingly relevant for AEs as well.
Despite the challenges, the analysis presented here suggests that monetary policy remains an effective tool for steering domestic financial conditions. While global shocks can significantly influence domestic conditions, they do not inherently inhibit central banks' ability to steer financial conditions. In fact, empirical evidence indicates that central banks generally retain strong traction on domestic financial conditions, especially over the domestic yield curve.
However, the findings presented in this chapter highlight how the conduct of monetary policy has become more complex. Central banks must be attuned to the dynamics of global financial conditions, including the potential impact of their own policy decisions. This underscores the importance of continually enhancing analytical frameworks and deepening the understanding of the cross-border challenges embedded in a more market-based financial system. In particular, gaining clearer insights into the significance and nature of global spillovers is essential for a more precise and effective calibration of monetary policy. Central banks should also continue to make effective use of their broader policy toolkit to navigate the complexities posed by increasingly globalised financial conditions. If appropriately deployed, these tools can help to ease possible trade-offs posed by shifts in global financial conditions and enhance monetary policy autonomy.33
The challenges associated with tighter financial connectedness also underscore the critical role of central bank cooperation. Regular information-sharing and exchange of views is essential to improve understanding and assessment of global macroeconomic and financial developments. Such exchanges also help central banks to anticipate better the international ramifications of their decisions and calibrate their policies accordingly to minimise unintended consequences. Moreover, central bank cooperation is vital for strengthening the monitoring and oversight of global financial markets given the growing influence of internationally active NBFIs.
Finally, the growing connectedness of global financial markets and the increasing role of NBFIs pose significant new challenges for financial stability. Enhancing regulatory standards to keep pace with the evolving structure of global financial markets is critical to ensure the resilience of the financial system.
Endnotes
1 The nomenclature "Great" Financial Crisis rather than the alternative "Global" Financial Crisis highlights the fact that the crisis in the regulated banking sector was far from a global phenomenon, even though the unwinding of the excesses did have global repercussions. See Adrian and Shin (2010) and Shin (2013).
2 See IMF (2011, 2014) and Eren and Wooldridge (2021).
3 See IMF (2023) and FSB (2024).
4 See Avalos et al (2025).
5 See Shin (2013).
6 See Shin (2013) and Avdjiev et al (2020).
7 See Shin (2023).
8 Banks have lending links with many different types of NBFIs. These include reverse repos and derivatives with central counterparties, hedge funds and broker-dealers, loans to or debt securities holdings issued by insurance companies and pension funds, other investment funds and finance companies, or even equity investment in funds or special purpose vehicles. See Aldasoro et al (2020) and García Luna and Hardy (2019).
9 In order to present a more comprehensive overview of the global portfolio debt flows, Graph 4 is based on the cross-border bond holdings of all (NBFI and other) investors other than official reserve holders. The respective IMF PIP data on the cross-border bond holdings of NBFIs, which are available for a smaller set of countries, suggest that NBFIs accounted for roughly two thirds of all cross-border bond holdings (excluding official reserves) as of end-2023.
10 See Avdjiev et al (2016).
11 See Shin (2025).
12 This far exceeds the global stock of cross-border bank credit ($40 trillion) and international bonds ($29 trillion).
13 See BIS (2022). In the 2022 BIS Triennial Central Bank Survey of Foreign Exchange and Over-the-counter Derivatives Markets, 92% of the turnover in FX swap and forwards contracts have a maturity of three months or less, and 62% of one week or less.
14 See Shin et al (2025).
15 See Dudley (2017) and Caballero et al (2024) for a detailed discussion.
16 See Aramonte et al (2023).
17 Note that the partial disconnect between movements in the short and the long end of the curve experienced over the past few years can be ascribed to multiple factors. These include uncertainty about the path of monetary policy and the terminal rates amid the inflation wave, as well as the lingering effects on term premia of large central banks' balance sheets. For a discussion, see BIS (2024).
18 See Adrian et al (2024), Chari (2023), Carney (2019), Avdjiev et al (2020), Bertaut et al (2021), Converse et al (2023), Arslanalp et al (2020), Raddatz et al (2017), Avdjiev et al (2025), Eren and Wooldridge (2022) and Zhou (2025).
19 See Coppola (2025) and Zhou (2025).
20 This corresponds to the "global connectedness" measure introduced by Diebold and Yilmaz (2012).
21 See eg Obstfeld (2015), Hofmann and Takáts (2015), Albagli et al (2019) and Kearns et al (2023).
22 Eichengreen and Hausmann (1999) refer to this pattern as "original sin" because it largely reflected EMEs' inherent inability to borrow from abroad in their domestic currency.
23 See eg Avdjiev et al (2019), Hofmann et al (2020, 2022) and Gelos et al (2024).
24 See Aquilina et al (2024) and McGuire and von Peter (2024).
25 A carry trade involves borrowing funds at a low interest rate in one currency (the funding currency) and buying a higher-yielding asset in another (the target currency). In recent years, low interest rates for the Japanese yen relative to other currencies have made it a funding currency of choice. The use of leverage makes these positions sensitive to changes in exchange rates, interest rates and volatility. See McGuire and von Peter (2024).
26 See McGuire and von Peter (2024) and Aquilina et al (2024).
27 Just as FX swaps can be used for hedging, they can be used to construct exposures to particular market movements. For example, a carry trade investor can provide dollars in return for yen in the FX swap market. The yen can then be sold in the spot market and the proceeds used to buy some other asset in a different currency (eg EME government bonds, AE equities). The investor is left with yen obligations via the forward leg of the swap while holding other non-yen assets.
28 See also the evidence in Rey (2015) and Miranda-Agrippino and Rey (2020) about the global financial cycle and the influence of US monetary policy.
29 See Grigoli et al (2025).
30 In contrast, taking a longer-run perspective focused on the cumulative effect of monetary policy announcements, Hofmann et al (2025) document a dominant role of US monetary policy shocks in the secular downward trend in global long-term interest rates.
31 See Arregui et al (2018).
32 NBFIs' balance sheets appear to be more affected by euro area unconventional monetary policy shocks than banks' balance sheets. See Holm-Hadulla et al (2023).
33 See BIS (2019, 2022) and IMF (2020).
Additional notes to graphs
Graph 1: GDP-PPP weighted average across AU, CA, EA, GB, JP and US.
Graph 1.A: Outstanding amounts of credit in local currency rebased to 100 at Q1 2000. General government debt at nominal value; it covers debt securities, loans and currency and deposits. Private non-financial sector includes non-financial corporations, households and non-profit institutions serving households.
Graph 1.B: Debt securities at market value.
Graph 2: For the global GDP, world GDP from IMF World Economic Outlook.
Graph 2.A: The sample covers AR, AU, BR, CA, CH, CL, CN, EA, GB, HK, ID, IN, JP, KR, KY, MX, RU, SA, SG, TR, US and ZA, subject to data availability. For RU, data up until 2020. NBFIs refer to non-bank financial institutions, including all financial institutions that are not central banks, banks or public financial institutions. See FSB (2024) for details.
Graph 2.B: The sample covers AR, AU, BE, BR, CA, CH, CL, CN, DE, ES, FR, GB, HK, ID, IE, IN, IT, JP, KR, KY, LU, MX, NL, SA, SG, TR, US and ZA, subject to data availability. Other investment funds (excl MMFs and HFs) also exclude real estate investment trusts and real estate funds and include equity funds, fixed income funds and other funds (mixed funds, referenced investment funds, external debt investment funds, currency funds and asset allocation funds etc). See FSB (2024) for details.
Graph 3.A: Sovereign investor base estimates by Arslanalp and Tsuda (2014); last updated on 2 May 2025. Missing values at the beginning of the sample are estimated using the growth rate of total government debt.
Graph 3.B: "Private" refers to total foreign holdings minus foreign official holdings.
Graph 4: Changes in outstanding stocks of cross-border bond holdings between 2015 and 2023. Data do not include reserve assets. The sample consists of 78 economies, based on availability of reported bilateral assets data in the IMF Portfolio Investment Positions by Counterpart Economy (formerly CPIS). Missing values between mid-2000 and 2023 are filled using linear interpolation. Missing values at the beginning and end of the sample are estimated using the growth rate of the respective reporting country's positions vis-à-vis the rest of the world. The reported changes in outstanding stocks also include valuation effects. Asian EMEs = CN, HK, ID, IN, KR, KZ, MN, MO, MY, PH, PK, PW, SG and TH; Europe = AT, BE, CH, CY, DE, DK, EE, ES, FI, FR, GB, GG, GI, GR, IE, IS, IT, JE, LT, LU, LV, MT, NL, NO, PT, SE, SI and SK; other AEs = AU, AW, BM, CA and NZ; other EMEs = AL, AR, BB, BG, BH, BO, BR, BY, CL, CO, CR, CZ, EG, HN, HU, IL, KW, LB, MU, MX, PA, PL, RO, SA, TR, UA, UY and ZA; United States = KY and US.
Graph 5: The BIS OTC derivatives statistics comprise data reported every six months by dealers in 12 jurisdictions (AU, CA, CH, DE, ES, FR, GB, IT, JP, NL, SE and US) plus data reported every three years by dealers in more than 30 additional jurisdictions. For periods between Triennial Surveys, the outstanding positions of dealers in these additional jurisdictions are estimated by the BIS.
Graph 6: Foreign holdings based on data from the US Treasury International Capital (TIC) System from monthly SLT reports. The BIS OTC derivatives statistics comprise data reported every six months by dealers in 12 jurisdictions (AU, CA, CH, DE, ES, FR, GB, IT, JP, NL, SE and US) plus data reported every three years by dealers in more than 30 additional jurisdictions. For periods between Triennial Surveys, the outstanding positions of dealers in these additional jurisdictions are estimated by the BIS. Other financial institutions (OFIs) consist primarily of non-bank financial institutions, which may be considered as financial end users (eg mutual funds, pension funds, hedge funds, currency funds, money market funds, building societies, leasing companies and insurance companies) although they can also include smaller non-reporting banks or central banks.
Graphs 6.A and 6.B: The sample covers CA, CH, EA, GB and JP and respective currencies.
Graphs 6.B, 6.C, 6.D, 6.E and 6.F: The fitted values on the y-axis are obtained from a panel regression of semiannual changes in OFIs' FX swaps and outright forwards notional amounts outstanding (in Graph 6.B, with five advanced economy currencies (CAD, CHF, EUR, GBP, JPY); in Graph 6.C to 6.F, with respective currencies). The regression includes the following explanatory variables: (i) expected returns of 10-year US government bonds in excess of the short USD interest rate; (ii) the respective currency government bond's expected excess return; (iii) the cost of hedging the respective currency exchange rate risk in the FX swap market in excess of the money market rate differential (ie the CIP deviation); (iv) changes in financial conditions; (v) valuation changes associated with the dollar exchange rate against the respective currency; and (vi) currency fixed effects (in the panel regression, Graph 6.B). See Nenova et al (2025) for further details.
Graph 7.A: GDP-PPP weighted averages of selected components of Goldman Sachs financial conditions indices for AU, BR, CA, CH, CL, CZ, EA, GB, HU, ID, IL, IN, JP, KR, MX, MY, NO, NZ, PH, PL, RO, SE, TH, TR, US and ZA.
Graph 7.B: Based on FSB (2024). Jurisdictions' submissions, based on national sector balance sheet and other data. The total reported linkages of all participating jurisdictions as a percentage of total claims and liabilities of each sector. The sample covers AR, AU, BE, BR, CA, CH, CL, CN, DE, ES, FR, GB, HK, ID, IE, IN, IT, JP, KR, KY, LU, MX, NL, SA, SG, TR, US and ZA.
Graph 8.A: For government bond yields, 10-year sovereign bond yields in local currency. For investment grade debt spreads, the Bloomberg Global-Aggregate Index OAS to Treasury curve. For equity returns, LSEG Datastream total market return indices. The sample covers AT, AU, BE, BR, CA, CH, CL, CZ, DE, ES, FI, FR, GB, HU, ID, IL, IN, IT, JP, KR, MX, MY, NL, NO, NZ, PH, PL, PT, RO, SE, TH, TR, US and ZA; subject to data availability. Latest is 30 May 2025.
Graph 8.B: The methodology follows that proposed by Diebold and Yilmaz (2012): the share of variance is derived from the generalised forecast error variance decomposition (GFEVD) matrix of vector autoregressions (VARs) featuring, respectively, the level and the risk factors for a sample of countries comprising AU, CA, EA, GB, JP, KR and US. The time variation in the GFEVD matrices is obtained by estimating the VARs over 500-business day rolling windows. The years shown refer to the end year of the estimation window.
Graph 9: The methodology follows that proposed by Diebold and Yilmaz (2012): the shares of variance are derived from the GFEVD matrix of VARs featuring, respectively, the level and the risk factors for a sample of countries comprising AU, CA, EA, GB, JP, KR and US, estimated on different subsamples.
Graph 10.A: On the x-axis, the local currency sovereign spread for EMEs is the JPMorgan GBI-EM Broad Diversified index spread over the 10-year US Treasury yield; for AEs, it is the JPMorgan GBI-Global excluding US Index spread over the 10-year US Treasury yield. The y-axis shows weighted average percentage changes in bilateral exchange rates against the US dollar (expressed as USD per unit of local currency), using weights from the JPMorgan GBI-EM Broad Diversified index as of April 2025 for EMEs, and weights from the JPMorgan GBI-Global index as of April 2025 for AEs. EMEs = BR, CL, CN, CO, CZ, DO, HU, ID, IN, MX, MY, PE, PL, RO, RS, TH, TR, UY and ZA; AEs = AU, BE, CA, DE, DK, ES, FR, GB, IT, JP, NL and SE. The data are weekly, with a sample period from January 2013 to May 2025.
Graph 10.B: Exogenous exchange rate shocks are identified as changes in the bilateral exchange rate against the US dollar on days of ECB monetary policy announcements, assuming that these exchange rate changes do not reflect news from either EMEs or the United States. The local currency credit risk premium, following Du and Schreger (2016), is the spread between the local currency government bond yield and the synthetic local currency yield available to a dollar-based investor. This synthetic yield is given by the sum of the US Treasury yield and the cross-currency swap rate, achievable by a dollar-based investor who has access to the local currency bond as well as the cross-currency swap contract of the same maturity. The sample period is from January 2005 to December 2017 and the sample covers BR, CO, HU, ID, IL, KR, MX, MY, PE, PH, PL, TH, TR and ZA.
Graph 11.A: Foreign holdings based on data from the US Treasury International Capital (TIC) System from annual SHL reports showing holdings as of end-June each year.
Graphs 11.B and 11.C: The BIS OTC derivatives statistics comprise data reported every six months by dealers in 12 jurisdictions (AU, CA, CH, DE, ES, FR, GB, IT, JP, NL, SE and US) plus data reported every three years by dealers in more than 30 additional jurisdictions. For periods between Triennial Surveys, the outstanding positions of dealers in these additional jurisdictions are estimated by the BIS. Other financial institutions (OFIs) consist primarily of non-bank financial institutions, which may be considered as financial end users (eg mutual funds, pension funds, hedge funds, currency funds, money market funds, building societies, leasing companies, insurance companies) although they can also include smaller non-reporting banks or central banks.
Graph 11.C: Estimated coefficients on the respective FCI measure (GS US FCI, level and risk factors of the BIS US FCI) from the regression of OFIs' FX swaps and outright forwards that also controls for: (i) the expected returns of 10-year US government bonds in excess of the short USD interest rate; (ii) the respective currency government bond's expected excess return; (iii) the cost of hedging the respective currency exchange rate risk in the FX swap market in excess of the money market rate differential (ie the CIP deviation); (iv) valuation changes associated with the dollar exchange rate against the respective currency; and (v) currency fixed effects. The sample covers CA, CH, EA, GB and JP over H2 1998–H1 2024. Percentage point change with respect to a unit change in the respective FCI measure (percentage point change in GS US FCI and unit change in BIS US FCI factors). See Nenova et al (2025) for further details. For the BIS FCI, the level factor reflects the prevailing level of various interest rates, while the risk factor loads on corporate bonds, risky spreads and equity returns. For details on the construction of factors, see Box B.
Graph 13.A: The methodology follows that proposed by Diebold and Yilmaz (2012). Share of variance is derived from the generalised forecast error variance decomposition (GFEVD) matrix of VAR models estimated on the respective GS US FCI components of AU, BR, CA, EA, GB, JP, KR, MX and US on rolling windows of 250 business days.
Graphs 13.B and 13.C: The BIS OTC derivatives statistics comprise data reported every six months by dealers in 12 jurisdictions (AU, CA, CH, DE, ES, FR, GB, IT, JP, NL, SE and US) plus data reported every three years by dealers in more than 30 additional jurisdictions. For periods between Triennial Surveys, the outstanding positions of dealers in these additional jurisdictions are estimated by the BIS.
Graph 14: Impact of an unexpected one standard deviation increase in the policy rate on asset prices, measured between one business day before and one business day after the monetary policy announcement. Changes in stock prices and exchange rates are measured as the difference in the logarithm of the stock index and the exchange rate, respectively. The impacts are estimated using ordinary least squares regressions and the confidence intervals are constructed based on heteroskedasticity-robust standard errors. Each regression includes country fixed effects. The estimation sample is 2010 to 2024, subject to data availability. AEs = AU, CA, GB, NO, NZ and SE. EMEs = BR, CL, CO, CZ, HU, ID, IL, IN, KR, MX, MY, PE, PH, PL, RO, RU, TH, TR and ZA.
Graph 15: Estimated using local projections with shock identification as in Miranda-Agrippino and Nenova (2022). The estimates for monetary policy spillovers are the peak impact within 10 days after a shock; the domestic monetary policy estimates are measured at the same time horizon as the corresponding monetary policy spillover estimates. The sample period is from January 1999 to June 2019. See Miranda-Agrippino and Nenova (2022) for details.
References
Adrian, T, G Gelos, N Lamersdorf and E Moench (2024): "The asymmetric and persistent effects of Fed policy on global bond yields", BIS Working Papers, no 1195, July.
Adrian, T and H S Shin (2010): "Liquidity and leverage", Journal of Financial Intermediation, vol 19, no 3, pp 418–37.
Ahmed, A, B Hofmann and M Schmitz (2023): "Foreign institutional investors, monetary policy, and reaching for yield", BIS Working Papers, no 1153, December.
Albagli, E, L Ceballos, S Claro and D Romero (2019): "Channels of US monetary policy spillovers to international bond markets", Journal of Financial Economics, vol 134, pp 447–73.
Aldasoro, I, W Huang and E Kemp (2020): "Cross-border links between banks and non-bank financial institutions", BIS Quarterly Review, September, pp 61–74.
Aquilina, M, M Lombardi, A Schrimpf and V Sushko (2024): "The market turbulence and carry trade unwind of August 2024", BIS Bulletin, no 90, August.
Aramonte, S, A Schrimpf and H S Shin (2023): "Margins, debt capacity and systemic risk", BIS Working Papers, no 1121, September.
Arregui, N, S Elekdag, G Gelos, R Lafarguette and D Seneviratne (2018): "Can countries manage their financial conditions amid globalization?," IMF Working Papers, no 2018/15.
Arslanalp, S, D Drakopoulos, R Goel and R Koepke (2020): "Benchmark-driven investments in emerging market bond markets: taking stock", IMF Working Papers, no 2020/192.
Arslanalp, S and T Tsuda (2014): "Tracking global demand for advanced economy sovereign debt", IMF Economic Review, vol 62, no 3, pp 430–64.
Avalos, F, S Doerr and G Pinter (2025): "The global drivers of private credit", BIS Quarterly Review, March, pp 13–30.
Avdjiev, S, V Bruno, C Koch and H S Shin (2019): "The dollar exchange rate as a global risk factor: evidence from investment", IMF Economic Review, vol 67, pp 151–73.
Avdjiev, S, L Gambacorta, L Goldberg and S Schiaffi (2020): "The shifting drivers of global liquidity", Journal of International Economics, vol 125, 103324.
----- (2025): "The risk sensitivity of global liquidity flows: heterogeneity, evolution and drivers", BIS Working Papers, no 1262, April.
Avdjiev, S, R McCauley and H S Shin (2016): "Breaking free of the triple coincidence in international finance", Economic Policy, vol 31, no 87, pp 409–51.
Bertaut, C, B Bressler and S Curcuru (2021): "Globalization and the reach of multinationals implications for portfolio exposures, capital flows, and home bias", Journal of Accounting and Finance, vol 21, no 5, pp 92–104.
Bank for International Settlements (BIS) (2019): "Monetary policy frameworks in EMEs: inflation targeting, the exchange rate and financial stability", Annual Economic Report 2019, June, Chapter II.
----- (2022): Macro-financial stability frameworks and external financial conditions, report submitted to the G20 Finance Ministers and Central Bank Governors.
----- (2024): "Investor optimism prevails over uncertainty", BIS Quarterly Review, December, pp 1–18.
Brave, S and D Kelley (2017): "Introducing the Chicago Fed's new adjusted national financial conditions index", Chicago Fed Letter, no 386.
Caballero, R, T Caravello and A Simsek (2024): "Financial conditions targeting", NBER Working Papers, no 33206.
Carney, M (2019): "The growing challenges for monetary policy in the current international monetary and financial system", speech at the Federal Reserve Bank of Kansas City Jackson Hole symposium, 23 August.
Chari, A (2023): "Global risk, non-bank financial intermediation and emerging market vulnerabilities", Annual Review of Economics, vol 15, pp 549–72.
Checo, A, F Grigoli and D Sandri (2024): "Monetary policy transmission in emerging markets: proverbial concerns, novel evidence", BIS Working Papers, no 1170, March.
Converse, N, E Levy-Yeyati and T Williams (2023): "How ETFs amplify the global financial cycle in emerging markets", Review of Financial Studies, vol 36, no 9, pp 3424–62.
Coppola, A (2025): "In safe hands: the financial and real impact of investor composition over the credit cycle", The Review of Financial Studies, hhaf017.
Diebold, F and K Yilmaz (2012): "Better to give than to receive: predictive measurement of volatility spillovers", International Journal of Forecasting, vol 28, pp 57–66.
Du, W and J Schreger (2016): "Local currency sovereign risk", Journal of Finance, vol 71, no 3, pp 1027–70.
Dudley, W (2017): "The importance of financial conditions in the conduct of monetary policy", speech at the University of South Florida Sarasota-Manatee, March.
Eichengreen, B and R Hausmann (1999): "Exchange rates and financial fragility", NBER Working Papers, no 7418.
Eren, E and P Wooldridge (2021): "Non-bank financial institutions and the functioning of government bond markets", BIS Papers, no 119, November.
----- (2022): "The role of non-bank financial institutions in cross-border spillovers", BIS Papers, no 129, December.
Financial Stability Board (FSB) (2024): Global monitoring report on non-bank financial intermediation 2024.
García Luna, P and B Hardy (2019): "Non-bank counterparties in international banking", BIS Quarterly Review, September, pp 15–33.
Gelos, G, P Patelli and I Shim (2024): "The US dollar and capital flows to EMEs", BIS Quarterly Review, September, pp 51–67.
Goodhart, C and B Hofmann (2003): "FCIs and economic activity: some international evidence", ZEI Working Papers, no B 14-2003.
Grigoli, F, D Sandri and A Schrimpf (2025): "Tug of war: global spillovers and monetary policy autonomy in emerging markets", BIS Working Papers, forthcoming.
Hatzius, J and S Stehn (2018): "The case for a financial conditions index", Goldman Sachs Global Economics Papers.
Hofmann, B, Z Li and S P Y Wu (2025): "Monetary policy and the secular decline in long-term interest rates: A global perspective", BIS Working Papers, no 1252, March.
Hofmann, B, I Shim and H S Shin (2020): "Bond risk premia and the exchange rate", Journal of Money, Credit and Banking, vol 52, S2, pp 497–520.
------ (2022): "Risk capacity, portfolio choice and exchange rates", BIS Working Papers, no 1031, July.
Hofmann, B and E Takáts (2015): "International monetary spillovers", BIS Quarterly Review, September, pp 105–18.
Holm-Hadulla, F, F Mazelis and S Rast (2023): "Bank and non-bank balance sheet responses to monetary policy shocks", Economics Letters, vol 222, 110918.
International Monetary Fund (IMF) (2011): "Overcoming political risks and crisis legacies", Global Financial Stability Report, September, Chapter 1.
------ (2014): "How do changes in the investor base and financial deepening affect emerging market economies?", Global Financial Stability Report, April, Chapter 1.
----- (2017): "Are countries losing control of domestic financial conditions?", Global Financial Stability Report, April, Chapter 3.
----- (2020): "Toward an integrated policy framework", IMF Policy Paper 2020/046.
----- (2023): "Nonbank financial intermediaries: vulnerabilities amid tighter financial conditions", Global Financial Stability Report, April, Chapter 2.
Kearns, J, A Schrimpf and F D Xia (2023): "Explaining monetary spillovers: the matrix reloaded", Journal of Money, Credit and Banking, vol 55, no 6, pp 1535–68.
Korukmez, B, M Lombardi and A Schrimpf (2025): "Exchange rates and financial conditions", BIS Working Papers, forthcoming.
Lombardi, M, C Manea and A Schrimpf (2025): "Financial conditions and the macroeconomy: a two-factor view", BIS Working Papers, no 1272, June.
McGuire, P and G von Peter (2024): "Sizing up carry trades in BIS statistics", BIS Quarterly Review, September, pp 16–18.
Miranda-Agrippino, S and T Nenova (2022): "A tale of two global monetary policies", Journal of International Economics, vol 136, 103606.
Miranda-Agrippino, S and H Rey (2020): "US monetary policy and the global financial cycle", The Review of Economic Studies, vol 87, no 6, pp 2754–76.
Nenova, T, A Schrimpf and H S Shin (2025): "Global portfolio investments and FX derivatives", BIS Working Papers, no 1273, June.
Obstfeld, M (2015): "Trilemmas and trade-offs: living with financial globalisation", BIS Working Papers, no 480, January.
Raddatz, C, S Schmukler and T Williams (2017): "International asset allocations and capital flows: the benchmark effect", Journal of International Economics, vol 108, pp 413–30.
Rey, H (2015): "Dilemma not trilemma: the global financial cycle and monetary policy independence", NBER Working Paper, 21162.
Shin, H S (2013): "The second phase of global liquidity and its impact on emerging economies", keynote address at the Federal Reserve Bank of San Francisco Asia Economic Policy Conference, November.
----- (2023): "The dollar based financial system through the window of the FX swaps market", speech at the Peterson Institute of International Economics conference on "Floating exchange rates at fifty", Washington DC, 24 March.
----- (2025): "Structural changes in the global financial system and the transmission of financial conditions", Fourth Annual Lecture in honour of Charles Goodhart, London School of Economics, 18 May.
Shin, H S, P Wooldridge and D Xia (2025): "US dollar's slide in April 2025: the role of FX hedging", BIS Bulletin, no 105, June.
Zhou, H (2025): "The fickle and the stable: global financial cycle transmission via heterogeneous investors", mimeo.