Global liquidity: a new phase?

Foreign currency credit – a key aspect of global liquidity – has undergone distinct phases. The first phase recorded by the BIS global liquidity indicators (2003–09) featured soaring bank credit amid accommodative financial conditions in the run-up to the Great Financial Crisis (GFC). The second phase (2009–21) saw a shift towards bond markets and more dollar credit, especially to borrowers in emerging market economies (EMEs), on the back of tighter bank regulation and a loose monetary stance. Has the recent global surge in inflation and monetary tightening ushered in a new phase? Recent patterns point to a contraction in foreign currency credit, primarily in dollars, and particularly for EMEs.1
JEL classification: E43, F34, G15.
Foreign currency credit – a key aspect of global liquidity – has grown and changed composition over the past two decades. These dynamics are important as they can reflect imbalances that exacerbate domestic financial cycles, with international spillovers (CGFS (2011)). Starting in 2000, the BIS global liquidity indicators (GLIs) track such dynamics, focusing on non-bank borrowers and credit denominated in dollars, euros and yen, as foreign currencies from the borrower's perspective.2
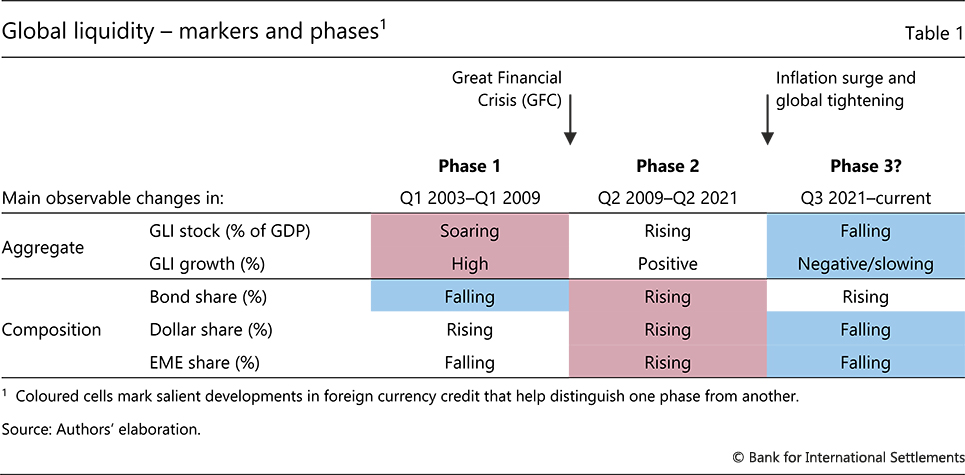
This special feature documents the evolution of the GLIs in terms of two phases and asks whether the recent shift in the macro-financial environment has ushered in a third phase. Several salient changes to trends in the GLIs help differentiate the phases (Table 1, coloured cells).
The first phase was driven by banks in the early 2000s.3 Foreign currency credit expanded rapidly, primarily in the form of dollar- and euro-denominated loans, and mostly to borrowers in advanced economies. The bank-driven expansion ahead of the GFC saw the share of bonds fall (Table 1). Light regulation of banks' leverage and monetary policy behind the curve facilitated this expansion, thus contributing to the credit boom leading up to the Great Financial Crisis (GFC).
Key takeaways
- The evolution of global liquidity over the past 20 years suggests distinct phases, marked by changes in the growth and composition of foreign currency credit following major shifts in the macro-financial environment.
- After a rapid expansion of foreign currency bank credit in the run-up to the Great Financial Crisis, there was a shift towards bond markets and more dollar credit, especially to borrowers in emerging market economies.
- Worldwide monetary tightening has curbed foreign currency credit, notably in dollars and to borrowers in emerging market economies, potentially heralding a new phase of global liquidity.
A second phase began in the aftermath of the GFC and featured a shift to bond market credit.4 Overall, foreign currency credit grew more moderately than in the first phase. The underlying shift to bond credit came as banks retrenched after the GFC and remained constrained by tighter regulation and the drag from the euro area debt crisis. Dollar credit expanded the most, particularly to borrowers in emerging market economies (EMEs).5 The rising shares of bond finance, dollar credit and credit to EMEs became the distinguishing features of this phase. These developments reflected loose monetary policy and stronger incentives for investors to search for yield in EMEs, which had been largely left unscathed by the GFC.
The macro-financial environment has recently undergone another major shift, with implications for global liquidity. The global surge in inflation triggered a rapid and synchronised monetary tightening worldwide, which ended the "low-for-long" regime of phase 2. As US interest rates rose earlier and faster than those of other major currencies, the dollar reached new heights. The general tightening of financial conditions made credit more expensive overall and may have reduced the incentives to search for yield in EMEs.
Did this shift in the macro-financial environment usher in a new phase of global liquidity? The latest data reveal several distinguishing patterns. First, foreign currency credit has contracted significantly as a share of global GDP. Second, this contraction was driven by a decline in dollar credit, matching the relatively tight stance in US monetary policy and driving down the share of the dollar in the total. While yen credit to non-bank borrowers outside Japan grew, as the central bank in the country kept policy rates low and the currency weakened, the small underlying volumes did not have a material impact on global liquidity. And third, EME borrowers faced a particularly steep credit contraction.
This article proceeds as follows. First, it steps through the first two phases in turn, pointing to their distinguishing features and the macro-financial environment that enabled them. It then lays out the recent change in the macro-financial environment and highlights the attendant changes in global liquidity. The final section concludes. A Box explains the BIS global liquidity indicators.
Phase 1: Bank-driven expansion
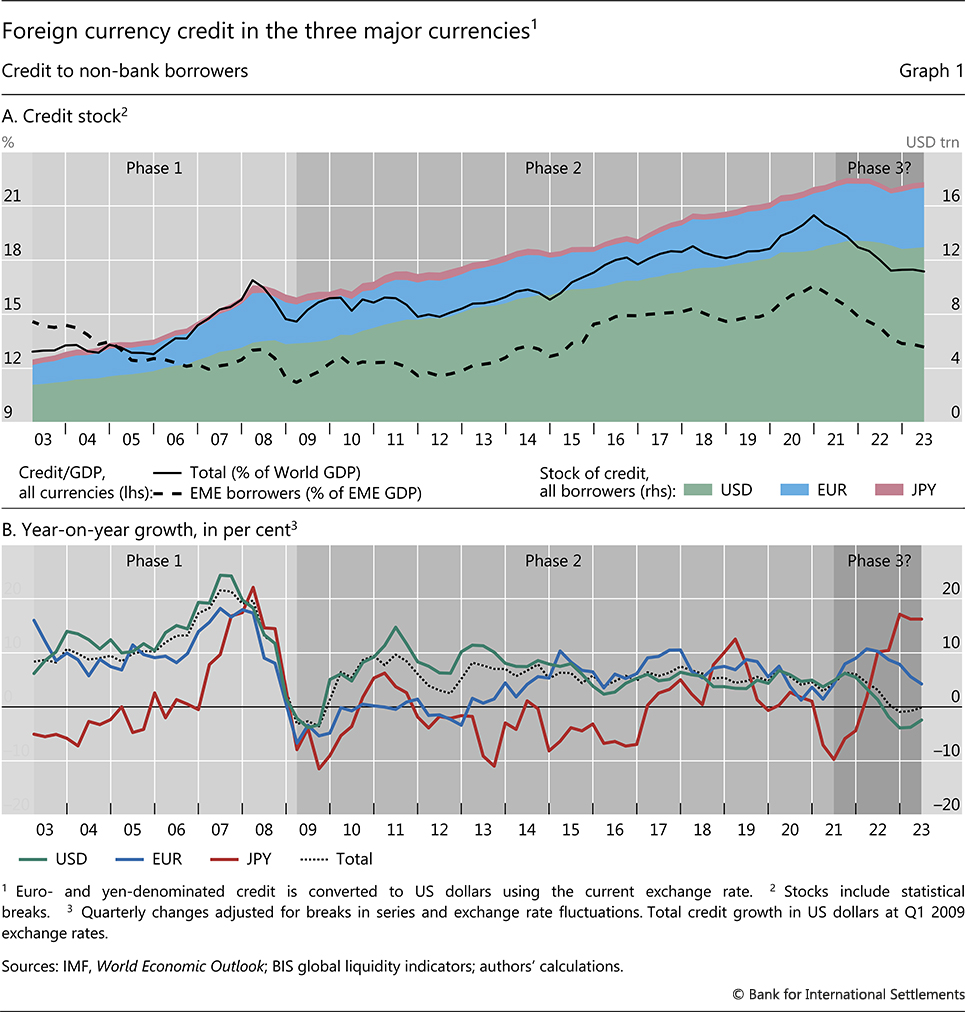
The first phase of global liquidity saw a large expansion in foreign currency credit, starting in the early 2000s and leading up to the GFC. During this period, the combined stock of foreign currency credit in dollars, euros and yen doubled, from $5 trillion in Q1 2003 to $10 trillion in Q1 2008 (Graph 1 .A). As a share of world GDP, it rose from 13% to a peak of 17%.6
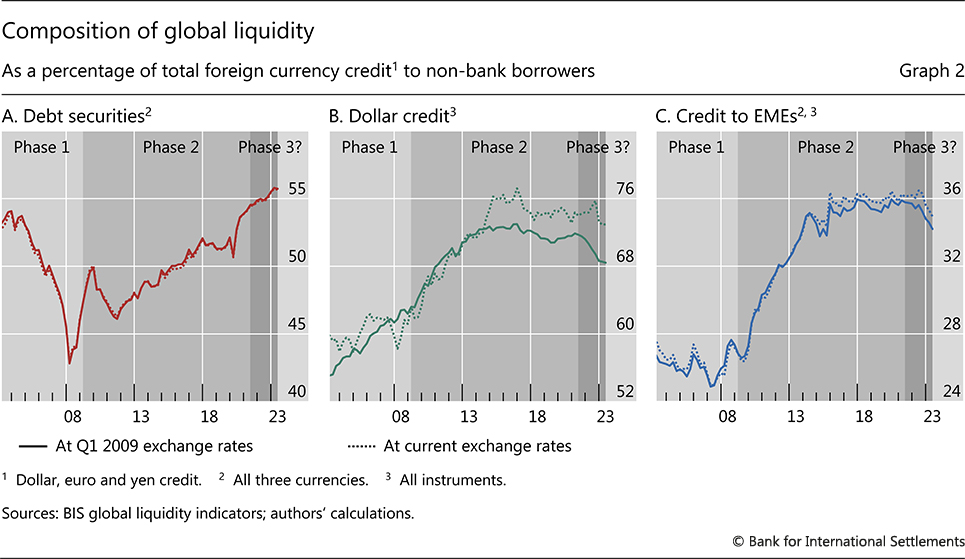
The rapid expansion in banks' international activity drove this dramatic growth and shifted the composition of credit. The share of foreign currency credit in the form of bonds fell by 10 percentage points as bank credit expanded (Graph 2.A).7 Dollar credit grew rapidly even from a large base (Graph 1.A), with a year-on-year growth rate consistently above 10% and peaking at 24% in 2007 (Graph 1.B). During this phase, dollar credit rose as a share of overall credit, reaching 63% by Q1 2009 (Graph 2.B). This expansion came in the context of a broader build-up, centred on the United States and Europe, with European banks fuelling credit- and housing-market booms in advanced economies (Borio and Disyatat (2011), Shin (2011), Borio and McGuire (2004)).8 Euro credit outside the euro area also saw brisk growth, averaging 10% over the phase. Starting from a small base, yen credit outside Japan caught the back end of the rising tide.
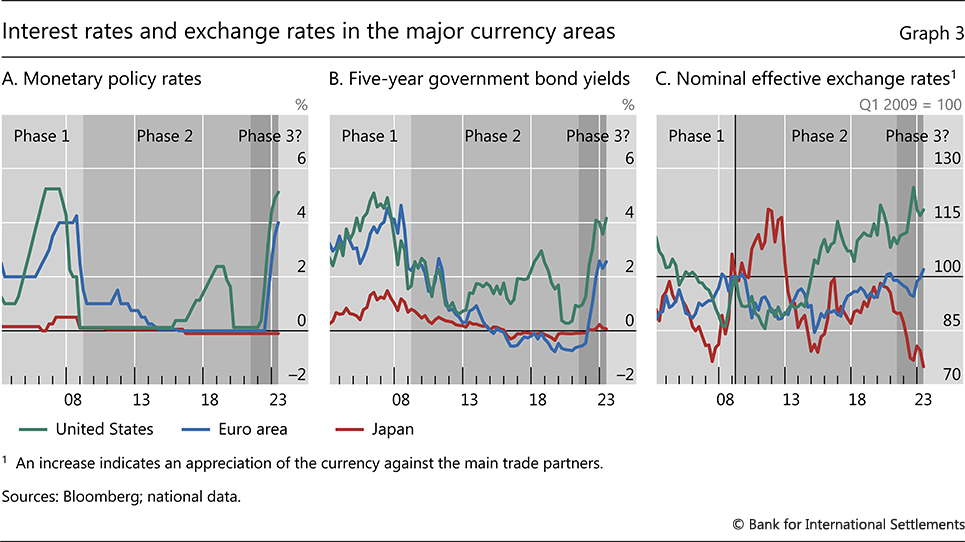
This boom in global liquidity occurred amid a permissive macro-financial and policy environment. Banks faced few regulatory limits on their leverage (Shin (2013), McCauley et al (2021)). This enabled a rapid expansion of bank credit, including to real estate, as lending standards declined. Banks headquartered in Europe led the expansion, pushing the year-on-year growth rate of international bank credit up to a peak of 20% (McCauley et al (2021)). Monetary policy remained behind the curve, with rates largely responding to but failing to stem the expansion of bank credit (Graph 3.A). Rapid foreign currency credit growth can be particularly concerning when it fuels domestic credit growth in the borrowing jurisdiction (Borio et al (2011), CGFS (2011)). It can exacerbate domestic credit cycles and create fertile ground for a crisis, as seen during the GFC.
Phase 2: The rise of bond markets
The end of the GFC ushered in a second phase of global liquidity. Foreign currency credit contracted for one to two years after the GFC, before returning to steady growth (Graph 1). This growth kept pace with GDP through 2012, when credit-to-GDP began to rise again, although more moderately than in phase 1.
The rise of bond markets is a defining feature of this phase (Shin (2013)), along with strong growth in dollar and EME credit. International bank lending collapsed and bond markets expanded in the GFC's wake. The share of foreign currency credit in the form of bonds rose from a trough of 43% in Q1 2008 to 55% by end-Q2 2021 (Graph 2.A). The dollar, already the dominant currency, saw a further rise in its share in global credit markets (CGFS (2020), Maggiori et al (2020)) (Graph 2.B).9 Dollar credit growth remained above that of the euro through end-2014 (Graph 1.B). In contrast to the first phase, credit to EME borrowers took centre stage, with their share in foreign currency credit rising from 26% in Q2 2009 to 36% by end-2015 (Graph 2.C). This share would be larger still if the data included offshore issuance by EME firms issuing bonds via their subsidiaries located in advanced economies (Shin (2013), Aldasoro et al (2021), McCauley et al (2015a), Avdjiev et al (2020b)).
These patterns reflected a new macro-financial and policy environment. Tighter regulation and supervision constrained banks (Ichiue and Lambert (2016)), and many banks adopted more conservative business models. At the same time, the Federal Reserve pushed its policy rate to zero, kept it there and engaged in quantitative easing (QE), thus flattening the yield curve and weakening the US dollar early in phase 2 (Graph 3). The upshot of these developments was a boost in US dollar-denominated bond issuance on the back of low borrowing costs. Euro policy rates also fell but initially lagged behind dollar rates in the first half of this phase (Graph 3.A). Combined with a retrenchment by European banks in the aftermath of the euro area crisis (McCauley et al (2019)), this kept growth in euro credit subdued while dollar credit expanded.10 Compressed yields (Graph 3.B), particularly at longer maturities, drove investors to search for yield by investing dollars in EMEs, especially via bonds (McCauley et al (2015b)).11
A new phase? Dollar tightening
The events of the past few years represent a seismic shift in the macro-financial environment. Monetary easing in response to the Covid-19 pandemic prolonged the accommodative stance. When inflation surged in 2021 against a backdrop of disrupted supply chains and rising geopolitical tensions, central banks embarked on the most rapid and synchronised worldwide tightening in decades, leaving behind the "low-for-long" regime associated with phase 2 (Graph 3.A). US policy rates rose earlier and, in 2022, faster than those in the euro area and Japan.12 Central banks also began to unwind QE, contributing to the rise in long-term bond yields (Graph 3.B).
Does the sharp turn in economic conditions and associated policies herald a new phase of global liquidity? One would expect credit to shrink in response to the tighter monetary stance. One would also expect dollar credit to fall by more, given the relatively fast rise and high levels of dollar-denominated rates as well as a strengthening dollar (Graph 3.C). Furthermore, a relative retreat from EMEs may occur, as rising rates across advanced economies could obviate the need to search for yield in EMEs.
We see growing evidence for these shifts in the data since mid-2021.
Foreign currency credit has begun to contract in aggregate. The overall stock of foreign currency credit stood 2% lower at mid-2023 than at its peak two years earlier (Graph 1.A). The contraction is more evident when credit is scaled by GDP – from 20% at end-Q2 2021 to 17% at end-Q2 2023 (solid line).
While the relative pace of bond credit was a key factor separating the first two phases, it does not seem to mark the transition to a potential third phase. From mid-2021, the growth of credit from bond markets slowed to a standstill but its share kept rising because bank lending declined. Banks of various nationalities drove the decline in lending, with the drop in EME banks' dollar lending being particularly sharp.
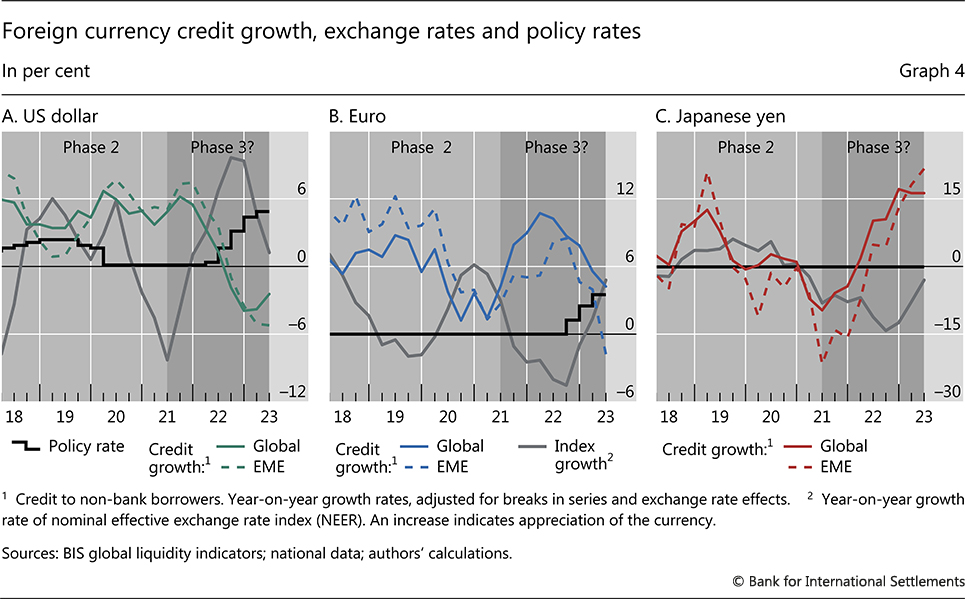
Dollar-denominated credit witnessed a steeper contraction, matching the tighter stance of US monetary policy compared with that of the euro area and Japan. Year-on-year growth in dollar credit fell from 6% in Q3 2021 to negative 4% at end-2022, staying negative for the latest four quarters in the data (Graph1.B).13 By contrast, euro credit growth merely slowed, and yen growth even accelerated over the same period. As a result, the dollar share in foreign currency credit declined from 72% in mid-2021 to 68% by mid-2023 (evaluated at constant exchange rates) (Graph 2.B). The divergence in credit growth across the dollar, euro and yen reflects their respective policy rates and exchange rates, with these variables moving in lockstep (Graph 4).14
Credit to EME borrowers has seen an even steeper decline than overall credit. Euro credit to these borrowers shrank by 2% year on year at end-Q2 2023, even as euro credit overall continued to expand.15 Dollar credit – the predominant foreign funding currency for most EMEs – shrank by 5% year on year by mid-2023 (Graph 4.A). The largest drops – two quarterly declines by more than $100 billion each – occurred in the second half of 2022, when US rates rose sharply and the US dollar reached the highest level since the 1980s. Time and again, dollar strength has been associated with tighter global financial conditions, especially for EMEs (Bruno and Shin (2015), Avdjiev et al (2019), Obstfeld and Zhou (2023)).
Conclusion
The tightening in foreign currency credit since 2021 is a departure from pre-pandemic trends. Whether this marks a new phase of global liquidity would depend on the persistence of the prevailing macro-financial environment. Both dollar and euro policy rates have risen further since the latest data points (Q2 2023), and central banks remain committed to the higher rates in order to tame inflation. Continued geopolitical uncertainty and fragmentation could additionally tighten credit conditions, thus furthering the current trends in global liquidity.
A sustained tightening of credit conditions could expose financial vulnerabilities that had built up during the second phase, particularly for EMEs heavily reliant on foreign currency debt. A key question is whether the contraction in dollar credit, a staple of EME finances, will continue and at what pace. More generally, high interest rates put upward pressure on the cost of credit, typically a harbinger of credit losses that the financial system will need to absorb.
References
Aldasoro, I and T Ehlers (2018): "Global liquidity: changing instrument and currency patterns", BIS Quarterly Review, September.
Aldasoro, I, B Hardy and N Tarashev (2021): "Corporate debt: post-GFC through the pandemic", BIS Quarterly Review, June, pp 1–14.
Avdjiev, S, V Bruno, C Koch and H S Shin (2019): "The dollar exchange rate as a global risk factor: evidence from investment", IMF Economic Review, vol 67, pp 151–73.
Avdjiev, S, L Gambacorta, L Goldberg and S Schiaffi (2020a): "The shifting drivers of global liquidity", Journal of International Economics, vol 125, no 103324.
Avdjiev, S, P McGuire and G von Peter (2020b): "International dimensions of EME corporate debt", BIS Quarterly Review, June, pp 1–13.
Borio, C and P Disyatat (2011): "Global imbalances and the financial crisis: Link or no link?", BIS Working Papers, no 346.
Borio, C and M Drehmann (2009): "Assessing the risk of banking crises – revisited", BIS Quarterly Review, March, pp 29–46.
Borio, C, R McCauley and P McGuire (2011): "Global credit and domestic credit booms", BIS Quarterly Review, September, pp 43–57.
Borio, C, R McCauley and P McGuire (2022): "Dollar debt in FX swaps and forwards: huge, missing and growing", BIS Quarterly Review, December, pp 67–73.
Borio, C and P McGuire (2004): "Twin peaks in equity and housing prices?", BIS Quarterly Review, March, pp 79–93.
Bruno, V and H S Shin (2015): "Cross-border banking and global liquidity", Review of Economic Studies, vol 82, pp 535–64.
Cohen, B, D Domanski, I Fender and H S Shin (2017): "Global liquidity: a selective review", Annual Review of Economics, vol 9, pp 587–612.
Committee on the Global Financial System (2011): "Global liquidity – concept, measurement and policy implications", CGFS Papers, no 45.
----- (2020): "US dollar funding: an international perspective", CGFS Papers, no 65.
Du, W and J Schreger (2022): "Sovereign risk, currency risk, and corporate balance sheets", Review of Financial Studies, vol 35, no 10, pp 4587–629.
Ichiue, H and F Lambert (2016): "Post-crisis international banking: an analysis with new regulatory survey data", IMF Working Papers, no 2016/088.
Maggiori, M, B Neiman and J Schreger (2020): "International currencies and capital allocation", Journal of Political Economy, vol 128, no 6, pp 2019–66.
McCauley, R, A Benetrix, P McGuire and G von Peter (2019): "Financial deglobalisation in banking?", Journal of International Money and Finance, vol 94, pp 116–31.
McCauley, R, P McGuire and V Sushko (2015a): "Dollar credit to emerging market economies", BIS Quarterly Review, December, pp 27–41.
----- (2015b): "Global dollar credit: links to US monetary policy and leverage", Economic Policy, vol 30, no 82, pp 58–62.
McCauley, R, P McGuire and P Wooldridge (2021): "Seven decades of international banking", BIS Quarterly Review, September, pp 61–75.
Obstfeld, M and H Zhou (2023): "The global dollar cycle", NBER Working Papers, no 31004.
Onen, M, H S Shin and G von Peter (2023): "Overcoming original sin: insights from a new dataset", BIS Working Papers, no 1075.
Shin, H S (2011): "Global banking glut and loan risk premium", Mundell-Fleming Lecture, IMF 12th Jacques Polak Annual Research Conference.
----- (2013): The second phase of global liquidity and its impact on emerging economies", keynote address at the San Francisco Federal Reserve Asia Economic Policy Conference, 4 November.
1 The authors thank Iñaki Aldasoro, Stefan Avdjiev, Claudio Borio, Benjamin Cohen, Gaston Gelos, Patrick McGuire, Benoît Mojon, Andreas Schrimpf, Hyun Song Shin, Vlad Sushko and Nikola Tarashev for helpful comments, and Mert Onen, Swapan-Kumar Pradhan and Jhuvesh Sobrun for excellent research assistance. The views expressed in this article are those of the authors and do not necessarily reflect those of the Bank for International Settlements.
2 In other words, this is dollar, euro and yen credit to non-bank borrowers outside the United States, the euro area and Japan, respectively.
3 The phases of global liquidity do not have exact start and end dates. For convenience, we delineate these phases as follows: Phase 1 from Q1 2003 to Q1 2009, phase 2 from Q2 2009 to Q2 2021 and a potential phase 3 from Q3 2021 onwards.
4 The terms bonds and bond markets in this feature refer to aggregates that comprise all debt securities included in the BIS IDS (Box A).
5 In the GLIs, this aggregate includes all emerging and developing economies (BIS country grouping).
6 As a ratio to GDP, foreign currency credit may be lower than measures of external debt as it does not include local currency credit borrowed from abroad (eg US dollar external debt of US residents) and focuses only on the foreign currency debt of the non-bank sector (ie excluding banks).
7 The bond share fell from 50% at end-2002 to 40% in Q2 2008 for dollar credit, from 57% to 48% for euro credit, and from 68% to 57% for yen credit.
8 The share of dollar credit to EME borrowers fell from 40% in 2000 to 30% in 2007. For overall foreign currency credit, this share dropped from 33% to 25% over that period (Graph 2.C). This trend towards advanced economy borrowers would be even more marked if dollar credit from European banks to US borrowers – a key development during this period – was included.
9 The share of dollars in total foreign currency credit rose from about 63% in Q2 2009 to 73% by Q4 2016 (at fixed exchange rates).
10 Yen rates remained low throughout all phases.
11 This phase also saw the development of local currency EME government bonds as a distinct asset class. If the rising share of local currency bonds held by foreigners were included in our calculations, the increasing trend of international credit to EMEs would be steeper (Du and Schreger (2022), Onen et al (2023)).
12 A number of EMEs raised rates earlier and faster than advanced economies.
13 The other major contraction of year-on-year USD credit growth in the data, immediately following the GFC, similarly reached a low point of –4%, and lasted three quarters.
14 Growth in yen credit exceeded 16% year on year driven by brisk bank lending. This growth is from a much smaller base and does not materially affect global liquidity overall.
15 Growth of yen credit to EMEs (22%) outpaced yen credit growth overall (16%) at end-Q2 2023. One third of the increase in yen credit went to EME borrowers, two thirds of which are in emerging Asia.