Cross-border links between banks and non-bank financial institutions
Take a look at the interactive graph, which shows the concentration of banks' cross-border claims, liabilities and net claims vis-à-vis non-bank financial institutions.
Cross-border links between banks and non-bank financial institutions (NBFIs) gained momentum in recent years. Banks' cross-border claims on NBFIs rose from $4.6 trillion in Q1 2015 to $7.5 trillion in Q1 2020, a faster increase than that of total cross-border claims. Financial centres and large advanced economies play a prominent role, as hosts of the largest and most interconnected NBFIs such as central counterparties, hedge funds and investment funds. The size of banks' cross-border links to NBFIs in emerging market economies has also been on the rise, albeit from a low base. The financial market turmoil triggered by Covid-19 revealed several vulnerabilities associated with cross-border linkages between banks and NBFIs.1
JEL classification: G21, G23, L14.
You think that because you understand "one" that you must therefore understand "two" because one and one make two. But you forget that you must understand "and".
Non-bank financial institutions (NBFIs)2 played an important role in transmitting shocks during the Great Financial Crisis (Gorton (2010), Claessens et al (2012)). Since then, NBFIs' assets under management have grown substantially, at even a faster pace than banks' (FSB (2020)). In tandem, national and international authorities have stepped up their efforts to quantify and understand NBFIs' activities and the attendant vulnerabilities (ESRB (2019)).
Key takeaways
- Cross-border bank claims on non-bank financial institutions (NBFIs), such as investment funds and central counterparties, have grown 63% in the last five years to $7.5 trillion in Q1 2020.
- Financial links between banks and NBFIs are mainly denominated in US dollars and concentrated in financial centres and large advanced economies, but have also grown in emerging market economies.
- Vulnerabilities stemming from these growing interconnections were highlighted during the Covid-19 market turmoil, for example in fickle dollar funding from NBFIs and liquidity pressures from high central counterparty margins.
Statistical data: data behind all graphs
Of particular concern are links between banks and NBFIs, which, to echo the opening quote, are key "conjunctions" in the financial system. Both types of institutions can engage in credit, maturity and liquidity transformation, which could underpin the accumulation of imbalances in normal times and pockets of stress in a downturn. Thus, links between banks and NBFIs are behind particularly powerful transmission mechanisms, as demonstrated most recently by the pandemic-related market turmoil. This episode underscored that central counterparty (CCP) margins can be procyclical and drain banks' liquidity at an inopportune time; that money market funds (MMFs) can be fickle funding providers to banks; and that banks' positions vis-à-vis NBFIs can contribute to their net long currency positions. These lessons had an important cross-border dimension.
This article is a first attempt at a global mapping of the cross-border links between banks and NBFIs, using the BIS international banking statistics (IBS) and focusing mainly on the residence of counterparties.3 We use recent enhancements to these statistics that introduced a more granular breakdown of banks' claims and liabilities vis-à-vis non-banks, in particular NBFIs (Avdjiev et al (2015)). Since analysis of cross-border links between NBFIs and non-banks is currently hampered by lack of data, we focus on the bank-NBFI nexus.
The rest of the article is organised as follows. The first section documents the continuous growth of NBFIs as bank counterparties in recent years. The second presents the network of cross-border links between banks and NBFIs,4 highlighting the systemic nodes through which shocks could propagate and the growing importance of NBFIs in emerging market economies (EMEs). The third section assesses vulnerabilities with a particular focus on how they materialised during the Covid-19 fallout in the first quarter of 2020.
The growing importance of NBFIs as bank counterparties
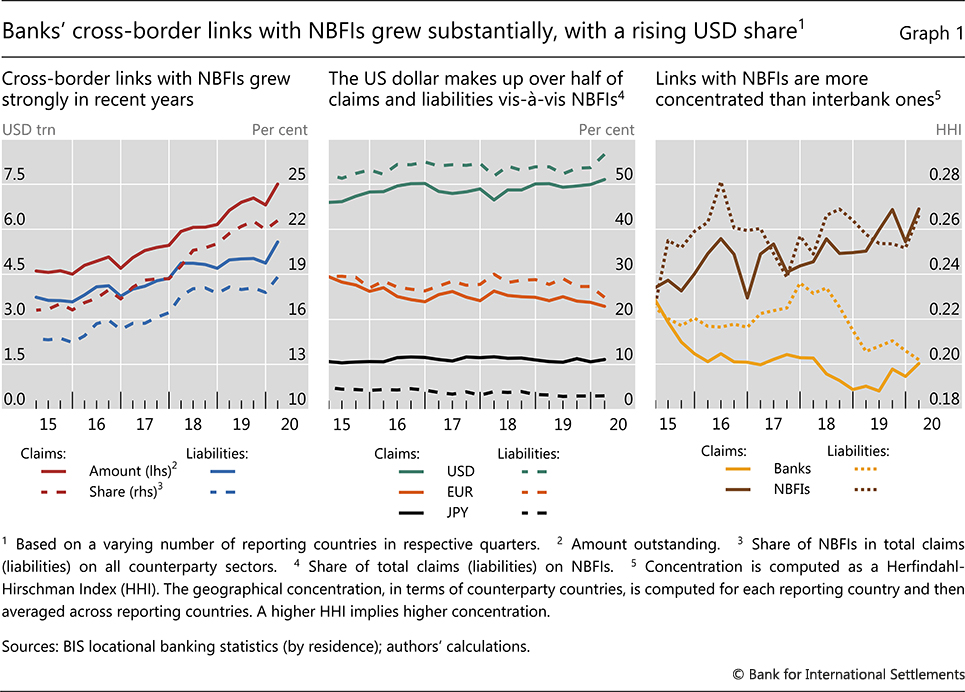
Banks' cross-border claims on, and liabilities to, NBFIs grew strongly in recent years. The outstanding amount of cross-border claims increased from $4.6 trillion in the first quarter of 2015 to $7.5 trillion in the first quarter of 2020, a notable rise of six percentage points when scaled by total cross-border claims (Graph 1, left-hand panel).5 A similar increase is observed for banks' cross-border liabilities to NBFIs, from $3.7 trillion to $5.6 trillion over the same period.6 Box A puts the IBS in perspective by considering the overall size of NBFIs, using data collected under the Financial Stability Board's (FSB) annual global monitoring exercise on non-bank financial intermediation.
The US dollar dominates banks' cross-border positions with NBFIs. More than 50% of both claims and liabilities are denominated in US dollars (Graph 1, centre panel), a slightly higher share than that for interbank positions. The share of both US dollar claims and liabilities grew by 5 percentage points in the five years to Q1 2020, mostly at the expense of euro-denominated positions. This is in line with the growing international role of the US dollar documented in the literature (eg Aldasoro and Ehlers (2018), Maggiori et al (2020), Erik et al (2020)).
Cross-border links between banks and NBFIs exhibit a high degree of geographical concentration (García Luna and Hardy (2019)). Concentration is a feature of cross-border banking more broadly (Aldasoro and Ehlers (2019)), but it is particularly high - and rising - vis-à-vis NBFIs (Graph 1, right-hand panel). It also varies by currency. The top three counterparty countries respectively account for 39%, 74% and 86% of all euro-, dollar- and yen-denominated cross-border claims on NBFIs at end-March 2020.
Box A
The global picture of non-bank financial intermediation from FSB data
Iñaki Aldasoro, Wenqian Huang and Esti Kemp
Non-bank financial intermediation provides additional sources of financing for households and corporates. But it can also contribute to systemic risks through links with the banking system. In the wake of the Great Financial Crisis, G20 leaders requested that the Financial Stability Board (FSB) develop recommendations to strengthen the oversight and regulation of "shadow banking". The framework developed in response includes the monitoring of non-bank financial intermediation. Findings are reported annually to provide a global picture of the size and growth of non-bank financial institutions (NBFIs), as well as their links with other parts of the financial system.
 Compared with the BIS international banking statistics, FSB data have a broader coverage of NBFIs' domestic and cross-border counterparties - including non-banks - but cover fewer jurisdictions and have no counterparty country breakdown.
The growth of NBFI assets exceeded that of bank assets over the past decade, reaching 48% of total financial assets at end-2018, from 42% at end-2008 (Graph A, left-hand panel). As of end-2018, the combined assets of NBFIs - consisting mostly of insurance companies, pension funds and other financial intermediaries (OFIs) - stood at $184 trillion, versus $148 trillion for banks.
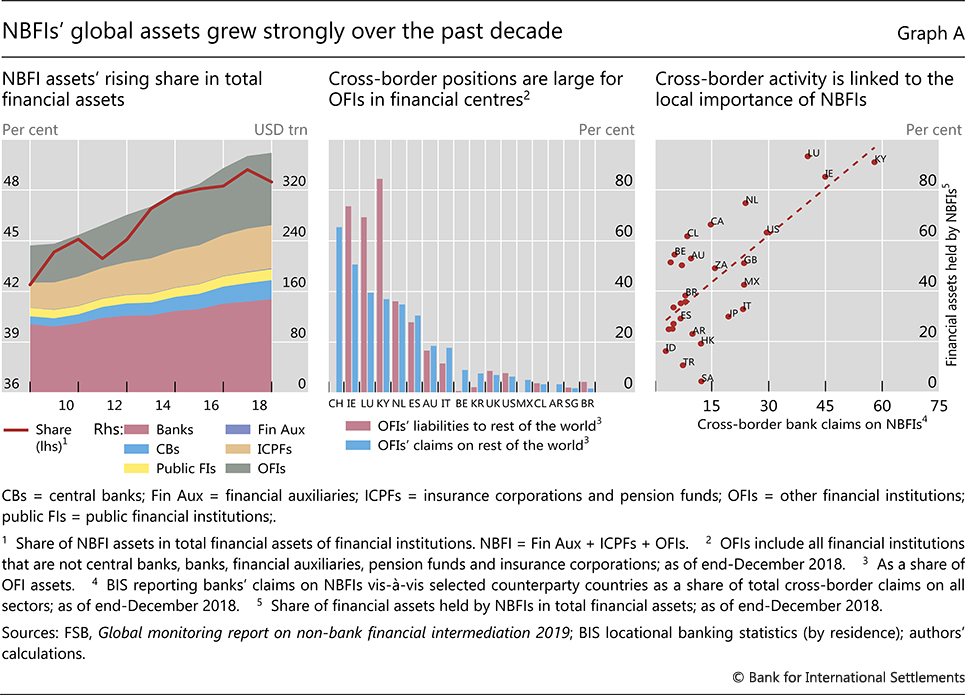
The importance of OFIs' cross-border positions relative to local positions varies across jurisdictions. Although financial centres have larger cross-border links, OFIs in most jurisdictions report cross-border links representing less than 20% of their assets (Graph A, centre panel).
The bigger the role of NBFIs in the financial system of a given jurisdiction, the bigger their share in banks' cross-border claims on that jurisdiction. The right-hand panel of Graph A illustrates this point by measuring the NBFIs' role with the ratio of their financial assets under management to total financial assets within a jurisdiction. Financial centres stand out, with relatively large NBFI sectors that have strong cross-border links with banks (upper right-hand corner).
The views expressed are those of the authors and do not necessarily reflect those of the Bank for International Settlements. FSB (2011). In October 2018, the FSB replaced the term "shadow banking" with "non-bank financial intermediation". The 2019 report covers data up to end-2018 from 29 jurisdictions, which together represent over 80% of global GDP; see FSB (2020). OFIs include central counterparties, finance companies, hedge funds, money market funds and other investment funds.
The network of cross-border links between banks and NBFIs
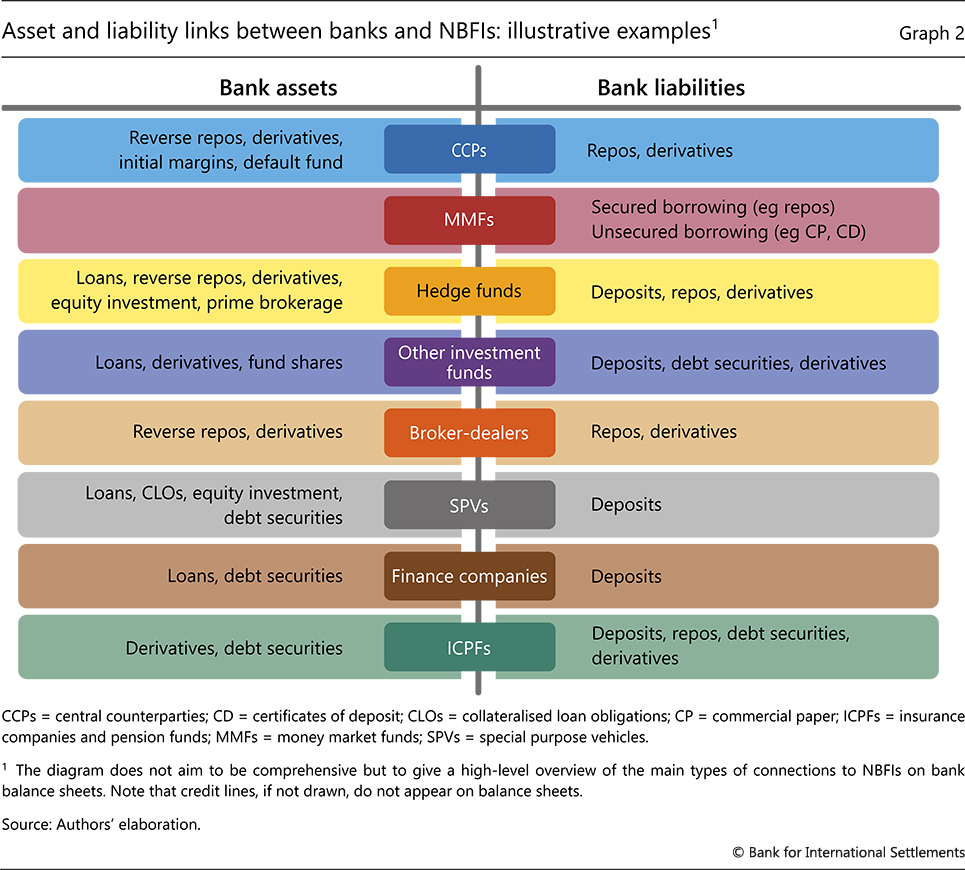
Banks and NBFIs are linked directly and indirectly.7 The IBS capture a subset of these linkages, namely banks' direct claims and liabilities vis-à-vis NBFIs. Graph 2 illustrates how such linkages could enter banks' balance sheets. For instance, if banks invest in collateralised loan obligations (CLOs) or extend loans to finance companies, these would show up on banks' asset side as claims on NBFIs. In turn, banks' liabilities could reflect funding from MMFs (eg via repos or commercial paper) or deposits from NBFIs, among others. Credit lines are off-balance sheet commitments that appear on balance sheets - as loans and the corresponding deposits - only when drawn.
BIS cross-border banking statistics capture the links between banks located in a given jurisdiction and the NBFI sector in another. The left-hand panel of Graph 3 plots the network of banks' cross-border claims on NBFIs as of Q1 2020. The size of the nodes is proportional to the total value of cross-border links. The colour of the links shows the location (legal residence) of the bank that holds the claim, and the width is proportional to the value of the claim. For example, claims of banks located in the United States on NBFIs in the United Kingdom are captured by the green link between the green and purple nodes. In turn, the purple link between these two nodes denotes claims of banks in the United Kingdom on NBFIs located in the United States. The same logic applies to the network of banks' cross-border liabilities (right-hand panel). For example, the green link between the same two nodes denotes the liabilities of banks in the United States to NBFIs in the United Kingdom.
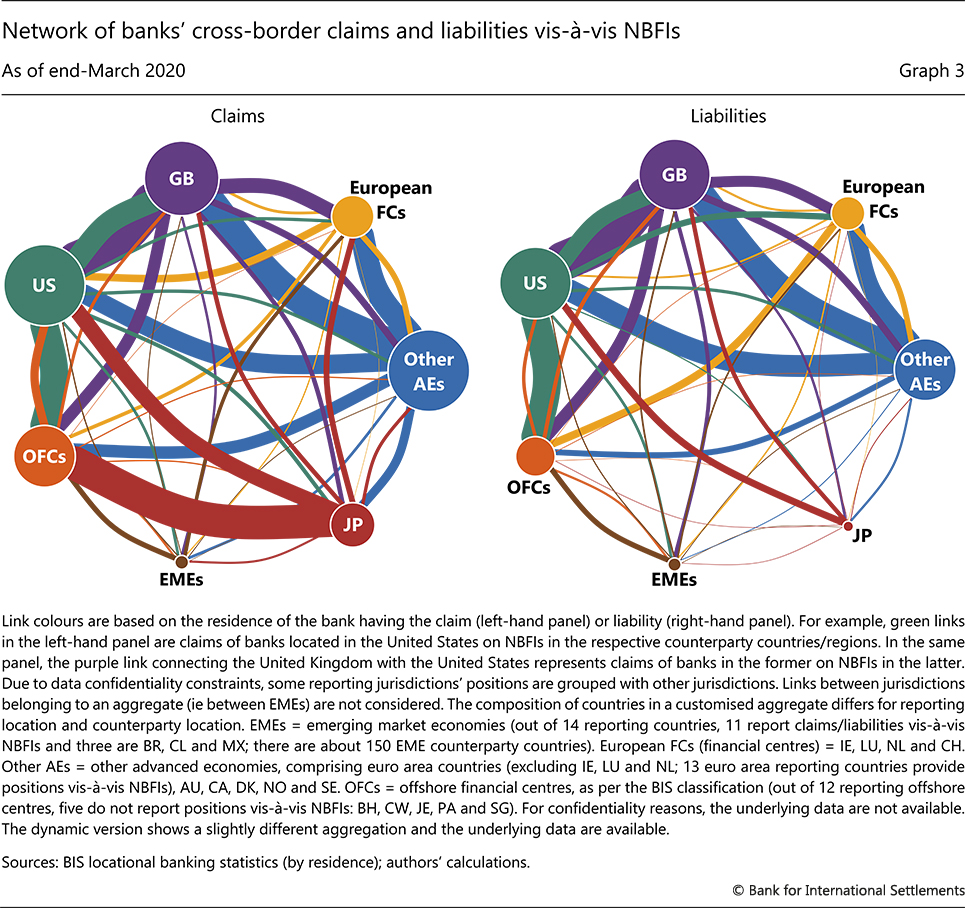
The patterns across claims and liabilities, and across counterparty countries, shed light on the types of NBFIs with which banks have cross-border positions.8 Banks in Japan, for instance, have sizeable claims on NBFIs in offshore financial centres (mainly in the Cayman Islands). This probably reflects banks' holdings of securities, such as CLOs, issued by securitisation vehicles, such as special purpose vehicles (SPVs) (Aramonte and Avalos (2019), SNP Global (2020)).9 The claims of banks in the US on NBFIs in offshore financial centres also probably reflect such activities (DeMarco et al (2020)), as well as prime brokerage business with hedge funds (Fichtner (2014)). It is likely that central clearing contributes to strong links between the United States and the United Kingdom, as both host internationally active CCPs (Benos et al (2019)). Banks in the euro area and in other advanced economies such as Canada and Australia (Graph 3, blue nodes) have substantial claims on NBFIs in European financial centres - ie Ireland, Luxembourg, the Netherlands and Switzerland.10 These may arise from banks' exposures to investment funds and other asset managers, such as hedge funds. European banks have large claims on NBFIs in the United States, reflecting exposure to US finance companies and US SPVs (Abad et al (2017)).
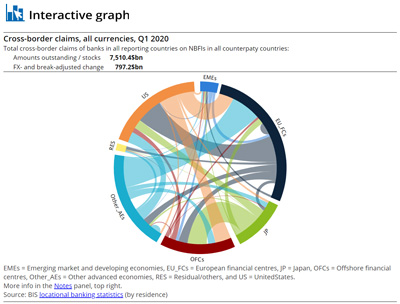
Turning to the network of cross-border liabilities, a similarly prominent role is played by certain financial centres and large advanced economies (Graph 3, right-hand panel). Again, this is likely to reflect the location of large CCPs that clear derivatives (eg the United Kingdom) and of NBFIs that are an important funding source for banks, such as MMFs (eg in the United States and Cayman Islands). That said, there are also some differences relative to the network of cross-border claims. Notably, offshore financial centres play a less prominent role as counterparties (size of links into orange node). Furthermore, the cross-border liabilities to NBFIs of banks in Japan are significantly smaller than their cross-border claims as of end-March 2020 (red node).
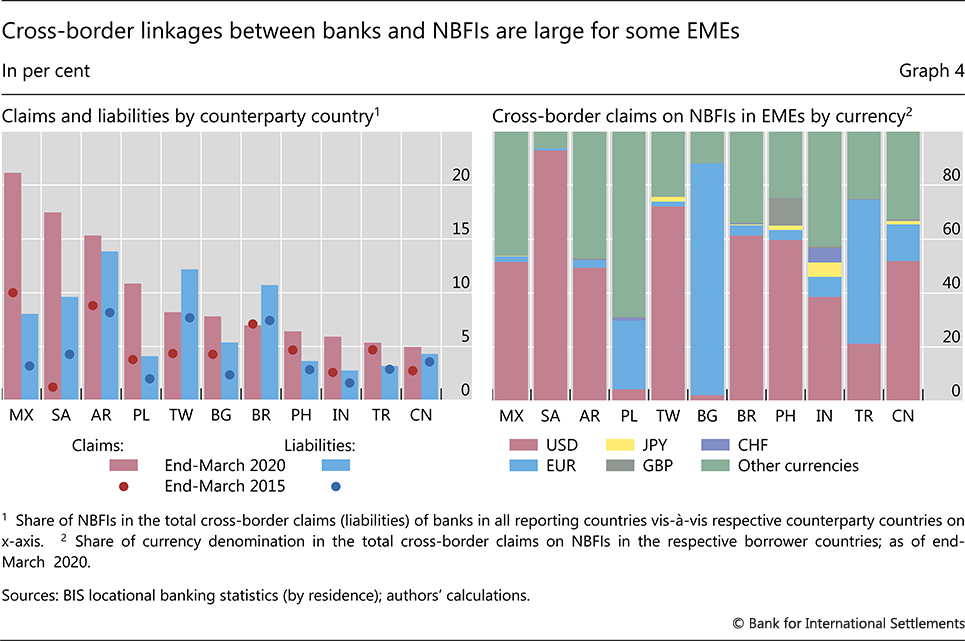
Banks' cross-border claims on and liabilities to NBFIs have also become more important for EMEs. While EMEs play a small role in the overall bank-NBFI cross-border network (Graph 3), the role of NBFIs is non-negligible from EMEs' perspective (Graph 4, left-hand panel). Furthermore, this role grew substantially for some countries in recent years, in terms of both claims (red bars vs dots) and liabilities (blue bars vs dots). As of Q1 2020, over 15% of the total cross-border bank claims on Mexico, Saudi Arabia and Argentina are vis-à-vis NBFIs. The US dollar also looms large for some EMEs: more than 60% of the cross-border claims on NBFIs in Brazil, Chinese Taipei and Saudi Arabia are denominated in US dollars (right-hand panel).
Vulnerabilities and the impact of the Covid-19 shock
Vulnerabilities associated with bank-NBFI links surfaced amid the Covid-19 market turbulence in March. On the one hand, banks' claims on certain NBFIs such as hedge funds increase financial leverage. During the severe financial stress caused by the pandemic's fallout, the unwinding of the leveraged positions exacerbated fire sales and drained market liquidity (Schrimpf et al (2020)). In addition, banks' links with CCPs (the "CCP-bank nexus" in Faruqui et al (2018)) can transform banks' counterparty credit risk into liquidity risk. On the other hand, banks increasingly rely on NBFIs such as MMFs for short-term funding. Such funding can suddenly dry up, causing market disruptions (Eren et al (2020)). More broadly, cross-border links between banks and NBFIs tend to underpin FX positions that generate liquidity and maturity mismatches. The IBS shed light on these vulnerabilities and their evolution during the initial phase of the Covid-19 crisis.
Further reading
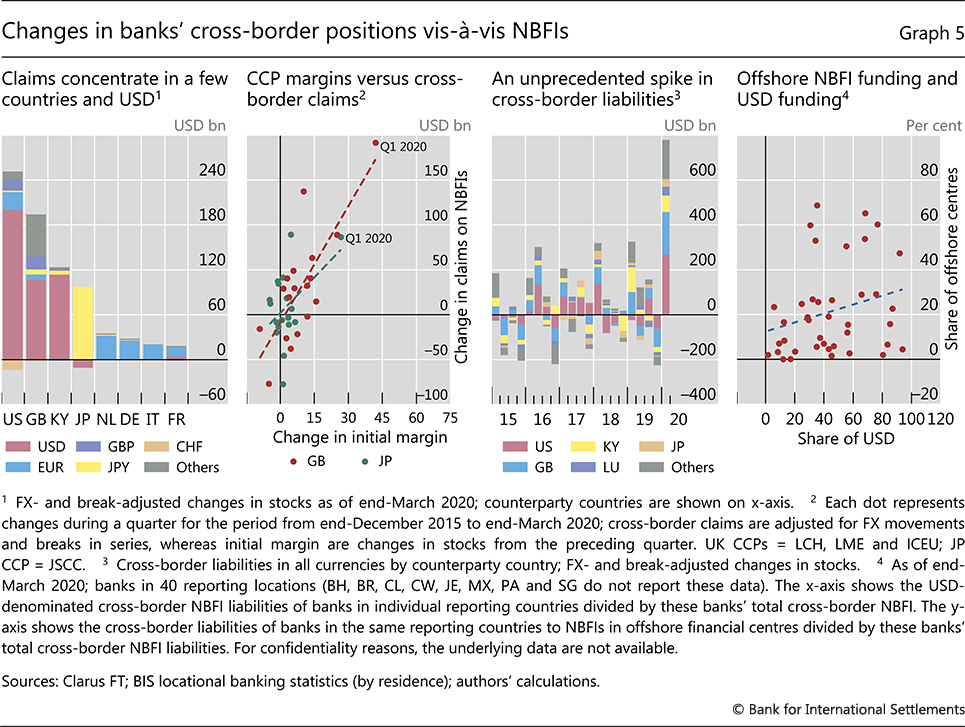
Banks' cross-border claims on NBFIs saw a significant spike in Q1 2020 ($797 billion), in line with that observed for cross-border claims more broadly (BIS (2020)). The large expansion could be the result of NBFIs' drawdown of credit lines from banks (Glancy et al (2020)). NBFIs located in the United States, United Kingdom and Cayman Islands accounted for much of this expansion, most of which was US dollar-denominated (Graph 5, first panel). Banks' claims on NBFIs in Japan, mostly yen-denominated, also saw a significant rise.11
Increases in banks' cross-border claims on NBFIs in the United Kingdom and Japan probably also reflected, in part, gains on banks' centrally cleared derivatives positions with, and initial margin calls by, CCPs located there. Historically, changes in cross-border bank claims on NBFIs in the United Kingdom and Japan have tended to correlate positively with changes in CCPs' initial margins in the same jurisdictions (Graph 5, second panel). The market turbulence in the first quarter of 2020 gave rise to a substantial increase in clearing volume by CCPs, as well as exceptionally large margin calls as CCPs stepped up their protection from counterparty risk (upper right-hand corner). Such a sudden and massive increase of margins generates liquidity strains for clearing member banks (Huang and Takáts (2020)).12
Banks' cross-border liabilities to NBFIs were also heavily affected by the March turmoil. The increase of $779 billion in Q1 2020 was exceptional, three times as large as the typical (average) first quarter increase since 2015 (Graph 5, third panel).13 Just as with changes in claims, NBFIs' drawdown of credit lines from banks plays a role: as the credit lines are drawn, they generate a corresponding increase in deposits at banks. As of end-December 2019, banks in the United States had almost a trillion dollars of committed credit lines to NBFIs (Federal Reserve Board (2020)). Furthermore, to the extent that CCPs intermediate between banks that are on opposite sides of derivatives contracts, gains on such contracts for some banks (ie claims on NBFIs) would go hand in hand with losses for other banks (ie liabilities to NBFIs). This could partly explain the increases in banks' liabilities vis-à-vis NBFIs in the United States and the United Kingdom.
The expansion of banks' liabilities to NBFIs in the first quarter of 2020 masks the underlying vulnerability stemming from some fickle funding sources. An example is the funding to banks provided by US MMFs. Portfolio holding data reported by MMFs reveal that the level of this funding rose from December 2019 to March 2020, in line with the overall direction of banks' liabilities vis-à-vis NBFIs in the United States. However, there was a significant decline from February to March 2020, underscoring that, despite reforms, MMFs can still be an unreliable source of funding (Eren et al (2020)).14
Banks also rely on offshore financial centres for their US dollar funding from NBFIs. The importance of these centres in banks' cross-border liabilities to NBFIs coincides with that of the US dollar (Graph 5, fourth panel). As the NBFIs in offshore financial centres (eg hedge funds, MMFs and other investment funds) tend to have a short investment horizon, they can amplify US dollar funding stress.
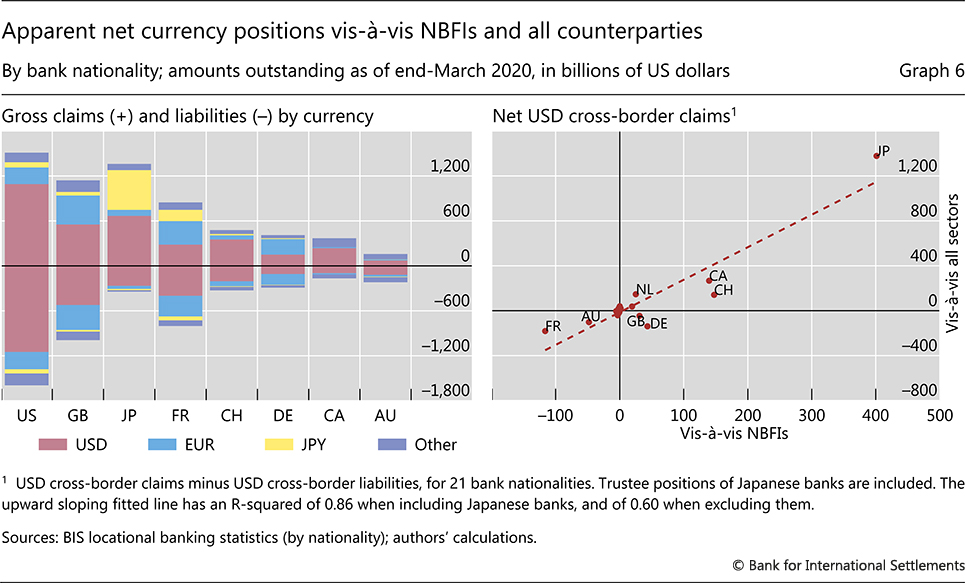
To look further into the role of NBFIs in banks' vulnerability to US dollar funding shortages, we consider statistics aggregated by bank nationality (see Box B for a discussion of this aggregation). In other words, we shift focus away from banks' residence and to their home countries. The data reveal apparent net long positions in US dollars vis-à-vis NBFIs (Graph 6, left-hand panel), which tend to contribute to apparent net long positions vis-à-vis all counterparties (right-hand panel).15 While banks typically hedge such positions via FX swaps - thus reducing or eliminating any currency mismatches - the short maturity of these instruments generates liquidity mismatches, leaving banks vulnerable to US dollar funding shortages. Such shortages took centre stage during the Covid-19 crisis, prompting authorities to swiftly re-establish central bank swap lines to quell the storm (Aldasoro et al (2020)).
Box B
Cross-border links with NBFIs from a bank nationality perspective
The BIS locational banking statistics (LBS) by nationality aggregate cross-border positions based on where reporting banks are headquartered. For example, they identify the claims held by the London offices (branches or subsidiaries) of German banks, ie those headquartered in Germany. By contrast, the LBS by residence - used in most of this article - treat all offices of the banks located in the United Kingdom in the same way, regardless of their nationality.
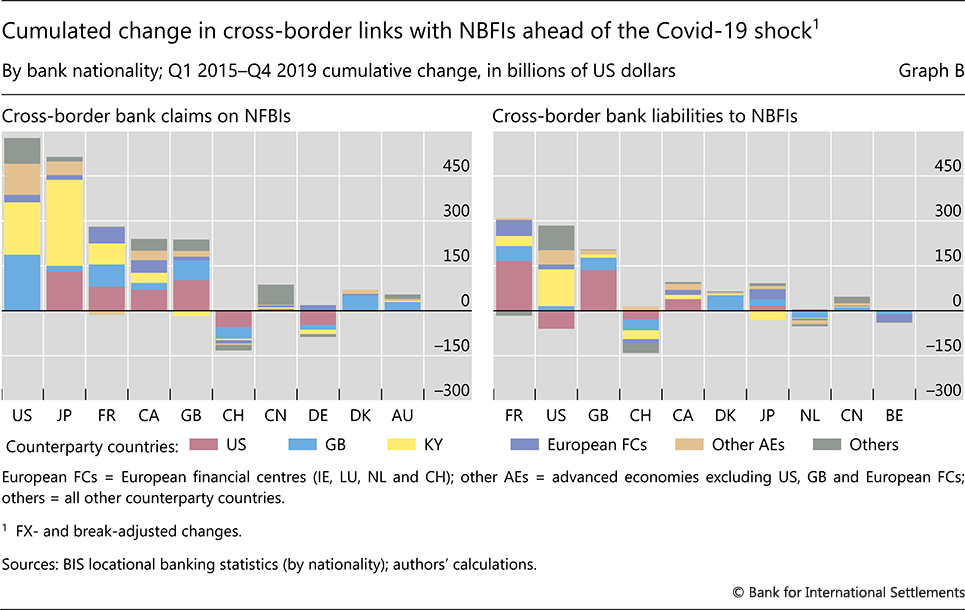
Banks headquartered in a handful of jurisdictions account for the lion's share of the changes in cross-border positions vis-à-vis non-bank financial institutions (NBFIs) between Q1 2015 and the eve of the Covid-19 crisis (end-2019). US banks are behind the largest increase: $576 billion, of which 32% ($185 billion) was vis-à-vis NBFIs in the United Kingdom, with an additional 30% ($175 billion) vis-à-vis those in the Cayman Islands (Graph B, left-hand panel). Japanese banks have also increased their claims on NBFIs in the Cayman Islands, by $287 billion over the same period. On the liability side, French and UK banks accumulated substantial cross-border liabilities with NBFIs in recent years, especially those located in the United States (right-hand panel). Similarly, US banks increased their cross-border liabilities with NBFIs, especially in the Cayman Islands. Banks headquartered in these jurisdictions are also the ones who saw the largest changes in claims and liabilities during the Covid-19 period.
The LBS by nationality allow for a split of cross-border assets and liabilities vis-à-vis NBFIs. An alternative - that does not allow for such split - is the consolidated banking statistics (CBS). They provide a similar nationality view, but from a worldwide consolidated perspective (ie net of intragroup positions). The top nationalities using the CBS are very similar to those using the LBS by nationality; see García Luna and Hardy (2019).
Conclusion
Banks' cross-border links with NBFIs grew substantially in recent years, in tandem with the increase in the size of the NBFI sector around the globe. Such linkages are highly concentrated along multiple dimensions. The market turmoil unleashed by the Covid-19 shock brought to the fore vulnerabilities associated with these links.
While adding to the understanding of the bank-NBFI nexus, our article also points to important data gaps. Enhancing the available data along four dimensions would help give a fuller picture of financial vulnerabilities and the attendant transmission channels. These dimensions are: the domestic exposures between banks and NBFIs, the specific types of NBFIs that banks have as counterparties, the exposures within the NBFI sector, and the financial instruments underpinning all exposures.
The sheer size of NBFIs, as well as their growing interconnectedness with banks, warrants continued monitoring by authorities. The fact that some NBFIs face a substantially different regulatory environment compared with banks - as well as no or limited formal access to central bank liquidity or public sector credit guarantees - only heightens this need.
References
Abad, J, M D'Errico, N Killeen, V Luz, T Peltonen, R Portes and T Urbano (2017): "Mapping interconnectedness between EU banks and shadow banking entities", NBER Working Paper, no 23280.
Aldasoro, I, F Balke, A Barth and E Eren (2019): "Spillovers of funding dry-ups", BIS Working Paper, no 810, September.
Aldasoro, I and T Ehlers (2018): "Global liquidity: changing instrument and currency patterns", BIS Quarterly Review, September, pp 17-27.
--- (2019): "Concentration in cross-border banking", BIS Quarterly Review, June, pp 1-11.
Aldasoro, I, T Ehlers, P McGuire and G von Peter (2020): "Global banks' dollar funding needs and central bank swap lines", BIS Bulletin, no 27, July.
Aramonte, S and F Avalos (2019): "Structured finance then and now: a comparison of CDOs and CLOs", BIS Quarterly Review, September, pp 11-14.
Avdjiev, S, P McGuire and P Wooldridge (2015): "Enhanced data to analyse international banking", BIS Quarterly Review, September pp 53-68.
Bank for International Settlements (2018): Annual Economic Report 2018, June, Chapter III.
--- (2020): "BIS international banking statistics at end-March 2020", statistical release, July.
Benos, E, W Huang, A Menkveld and M Vasios (2019): "The cost of clearing fragmentation", BIS Working Papers, no 826.
Claessens, S, Z Pozsar, L Ratnovski and M Singh (2012): "Shadow banking: economics and policy", IMF Staff Discussion Note 12/12.
DeMarco, L, E Liu and T Schmidt-Eisenlohr (2020): "Who owns US CLO securities? An update by tranche", FEDS Notes, 25 June.
Eren, E, A Schrimpf and V Sushko (2020): "US dollar funding markets during the Covid-19 crisis - the money market fund turmoil", BIS Bulletin, no 14, May.
Erik, B, M Lombardi, D Mihaljek and H S Shin (2020): "The dollar, bank leverage, and real economic activity: an evolving relationship", AEA Papers and Proceedings, vol 110.
European Systemic Risk Board (2019): "EU non-bank financial intermediation risk monitor 2019", NBFI Monitor, no 4.
Faruqui, U, W Huang and E Takáts (2018): "Clearing risks in OTC derivatives markets: the CCP-bank nexus", BIS Quarterly Review, December, pp 73-90.
Federal Reserve Board (2020): Financial Stability Report, May.
Fichtner, J (2014): "Privateers of the Caribbean: The hedge funds-US-UK-offshore nexus", Competition & Change, vol 18, no 1.
Financial Stability Board (2011): Shadow banking: strengthening oversight and regulation, October 2011.
--- (2019): Vulnerabilities associated with leveraged loans and collateralised loan obligations, December.
--- (2020): Global monitoring report on non-bank financial intermediation 2019, January.
García Luna, P and B Hardy (2019): "Non-bank counterparties in international banking", BIS Quarterly Review, September, pp 15-33.
Glancy, D, M Gross and F Ionescu (2020): "How did banks fund C&I drawdowns at the onset of the COVID-19 crisis?", FEDS Notes, 31 July.
Gorton, G (2010): Slapped by the invisible hand: the panic of 2007, Oxford University Press.
Huang, W and E Takáts (2020): "The CCP-bank nexus in the time of Covid-19", BIS Bulletin, no 13, May.
Ivashina, V, D Scharfstein and J Stein (2015): "Dollar funding and the lending behaviour of global banks", The Quarterly Journal of Economics, vol 130, no 3.
Maggiori, M, B Neiman and J Schreger (2020): "International currencies and capital allocation", Journal of Political Economy, vol 128, no 6.
Schrimpf, A, H S Shin and V Sushko (2020): "Leverage and margin spirals in fixed income markets during the Covid-19 crisis", BIS Bulletin, no 2, April.
SNP Global (2020): "Japanese banks warned of COVID-19 impact on overseas CLO investments", SNP Global Market Intelligence, 1 July.
1 The authors thank Claudio Borio, Christian Cabanilla, Stijn Claessens, Ingo Fender, Jenny Hancock, Bryan Hardy, Patrick McGuire, Noel Reynolds, Hyun Song Shin, Takeshi Shirakami, Nikola Tarashev and Philip Wooldridge for valuable comments and suggestions, Swapan-Kumar Pradhan for excellent research assistance, the International Banking and Financial Statistics unit and Massimo Bruschi for the interactive graphs, and Mario Barrantes for his help with the design of Graph 2. The views expressed in this article are those of the authors and do not necessarily reflect those of the Bank for International Settlements or the Financial Stability Board.
2 Non-bank financial institutions, comprise, inter alia, insurance companies and pension funds, finance companies, broker-dealers, special purpose vehicles, money market funds, hedge funds, other investment funds and central counterparties.
3 We use the locational banking statistics, most of which are published on the BIS website.
4 See the accompanying interactive map of cross-border links between banks and NBFIs.
5 The number of countries reporting positions vis-à-vis NBFIs has been continuously growing, from 27 in Q1 2015 to 40 since Q2 2019. The rising importance we document is not an artefact of this increase in the reporting population: we obtain notably similar figures if we consider a constant sample of reporting countries.
6 Data on liabilities may be underestimated. Debt securities issued by banks cannot be allocated to specific counterparties, as banks typically do not know who holds them after primary issuance.
7 Examples of indirect links include those arising from being part of the same conglomerate (including implicit or explicit support from banks to affiliated funds), or from having exposures to the same counterparty (eg overlapping portfolios).
8 While BIS data do not present a breakdown of NBFIs (eg CCP or broker-dealer) or instruments (eg repo or debt security), other publicly available data and research can indicate the types of NBFIs to which banks have exposures.
9 As of end-2018, Japanese banks held CLOs worth $107 billion (FSB (2019)).
10 We define European financial centres as those European jurisdictions with large bank and NBFI activity relative to the size of the economy.
11 In contrast, cross-border claims on the non-financial sector in Japan declined slightly in Q1 2020.
12 This underscores the importance of CCP members understanding how margin calls could evolve in stressed markets and remaining prepared to manage liquidity strains. To achieve that, members could benefit from transparency in CCPs' credit risk management, eg margin methodology and practices.
13 The seasonal pattern of first quarter increases is liable to arise from the year-end contraction in banks' balance sheets occurring mostly via derivatives and repos (BIS (2018)).
14 Previous disruptions to the US dollar funding provided by US MMFs to non-US banks have been highly consequential for banks and their borrowers, as shown in the context of the euro zone crisis of 2011 (Ivashina et al (2015)) or the US MMF reform (Aldasoro et al (2019)).
15 Data for Japanese banks include trustee positions, leading to an overestimation of net US dollar claims.