International dimensions of EME corporate debt
International credit can be fickle and subject to sudden stops during periods of global economic stress. Non-financial corporate borrowers that rely on credit from abroad are vulnerable to reversals in capital flows. Similarly, corporates that borrow in foreign currency may face problems rolling over their debt when the local currency depreciates or global dollar funding conditions tighten. This feature draws on several BIS data sets to examine corporates' external and foreign currency debt for key emerging market economies on the eve of the Covid-19 outbreak.1
JEL classification: F34, F65.
Since the Great Financial Crisis (GFC) of 2007-09, corporate borrowers in many emerging market economies (EMEs) have increasingly turned to external sources of funding, much of it denominated in foreign currencies. Such debt can be susceptible to sudden stops (Calvo (1998), Forbes and Warnock (2012)), which often lead to sharp contractions in economic activity.2
This feature uses several BIS data sets to examine two dimensions of EME corporates' debt at end-2019, on the eve of the Covid-19 outbreak. We first estimate externally funded debt, comprising cross-border credit in the form of bonds held by non-residents and loans from banks abroad, denominated in any currency. Then, drawing on the currency dimension in BIS statistics (one of their key strengths), we estimate foreign currency debt owed by corporates to all creditors, domestic and foreign. The two dimensions overlap, but also differ in ways that can have important implications for borrowers' susceptibility to sudden stops.
We focus on EME non-financial corporates (NFCs) because they stand out in terms of borrowing externally and in foreign currencies.3 In particular, they accounted for much of the post-GFC increase in total dollar credit to all EME non-bank borrowers, which rose from $1.6 trillion in 2009 to $3.8 trillion at end-2019. The economic shutdown in 2020 and associated disruptions in supply chains, falls in sales and drops in commodity prices squeezed many corporates, casting doubt on their ability to service their debts (Eichengreen (2020)).
Key takeaways
- Corporates in many emerging market economies borrowed increasingly from external sources in foreign currencies during the decade prior to the Covid-19 crisis.
- Such debt is susceptible to sudden stops, although foreign currency revenues and other hedges reduce corporates' vulnerability.
- BIS statistics can help track the evolution of externally funded debt and foreign currency debt in a granular way.
While reliance on external and foreign currency debt has in the past heightened vulnerabilities (eg to capital flow reversals or exchange rate depreciations), our measures by themselves paint an incomplete picture. A full assessment of vulnerabilities would incorporate factors such as revenues, assets and intragroup linkages. For example, commodity exporters and other corporates with foreign currency revenues have a natural hedge for dollar debt. Many own substantial foreign currency assets too, as do the countries in which they operate.
These factors should be kept in mind when interpreting our measures for specific countries. For most of the EMEs examined here, the ratio of NFCs' estimated foreign currency debt to GDP was less than 15% at end-2019. Of the few with higher ratios, some are commodity exporters. Across most EMEs, the bulk of NFCs' foreign currency debt is denominated in US dollars. While much of NFCs' debt remains in the form of bank loans, the issuance of international debt securities has gained ground since the GFC, especially if offshore issuance by NFCs' foreign affiliates is taken into account.
In the next section, we present measures of the total debt of NFCs in 16 major EMEs at end-2019, the latest quarter for which comprehensive data are available. The following two sections then present our estimates of externally funded and foreign currency debt, and discuss their limitations. The box explains how we construct these estimates. In the final section, we employ commercial data sources on dollar-denominated international bonds and syndicated loans to gauge how debt stocks have evolved since the global spread of Covid-19.
NFCs' debt in context
The characteristics of NFCs' debt often differ from those of other non-financial borrowers. In many EMEs, government debt increasingly consists of bonds in domestic currency (Cantú, Goel and Schanz (2020, in this issue)), while household debt is mainly domestic loans in domestic currency. In contrast, NFC debt is a combination of bonds and loans, and both in domestic and in foreign currencies.
Since the GFC, the total debt of NFCs in EMEs has grown substantially in absolute terms, and slightly faster than that of other non-financial borrowers (ie governments and households). At end-2019, NFCs resident in the 16 EMEs in Graph 1 combined had outstanding debt of $28.6 trillion, up from $10.5 trillion at end-2009.4 This amounted to 51% of the total debt of non-financial borrowers in these countries at end-2019, slightly higher than the share at end-2009. NFCs' debt made up more than half of non-financials' total debt in Chile, China, Russia, Saudi Arabia and Turkey, and it exceeded 40% in the Czech Republic, Hungary and Korea (left-hand panel).
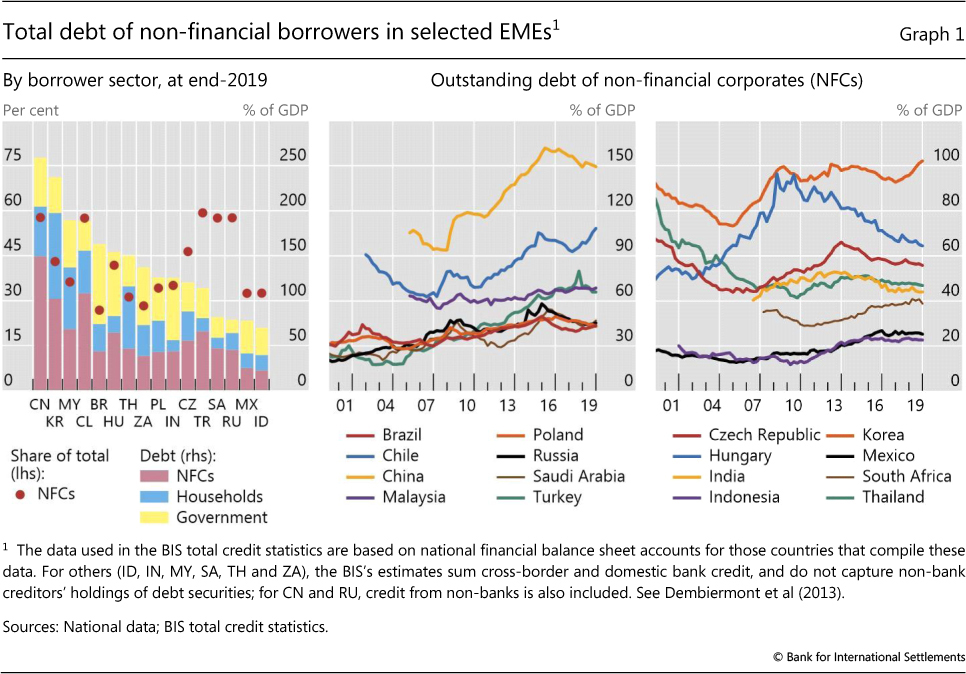
With debt growing faster than nominal GDP, the ratio of resident NFCs' debt to GDP was considerably higher than before the GFC for several EMEs (Graph 1, centre and right-hand panels). This ratio surpassed 100% for China, Korea and Chile at end-2019, and was above 60% for Hungary, Malaysia and Turkey. While the ratios for Brazil, the Czech Republic and Poland have trended downwards in recent years, they remained higher at end-2019 than their pre-GFC levels.
Externally funded debt
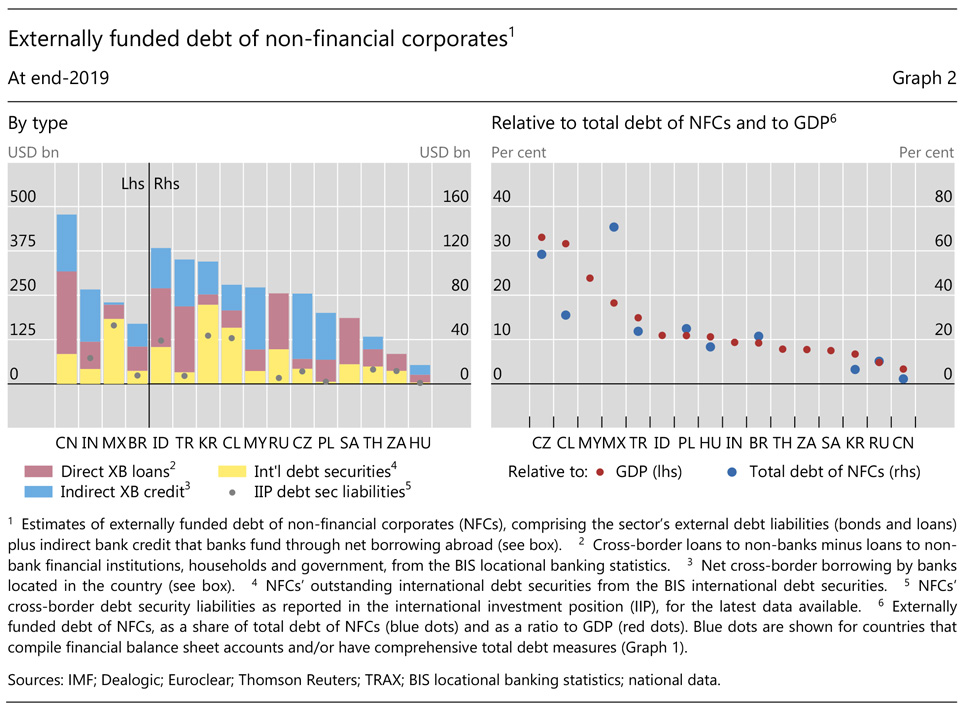
External debt is the stock of debt liabilities held by creditors residing outside the borrower country. It includes all cross-border credit in the form of bonds held by non-residents and loans from banks abroad, denominated in any currency. For a country as a whole, these external debt liabilities are measured on a residency basis as part of the country's international investment position. Here, we focus on the external debt of the NFC sector and go one step further than the standard measure: we add indirect external bank credit to NFCs, ie the part of domestic credit that resident banks fund through net borrowing abroad (see box).5 We call this aggregate NFCs' externally funded debt (EFD).6
EMEs differ in their reliance on loan versus bond funding (Graph 2, left-hand panel). International debt securities (yellow bars) make up more than half of NFCs' externally funded debt in Chile, Korea and Mexico, but less than a tenth in Hungary, Poland and Turkey.7 Those NFCs relying more on loans often obtain them through the indirect channel (blue bars), notably those in emerging Europe and East Asia. Hardy (2019) notes that, in emerging Europe, the local affiliates of foreign banks often borrow within their banking group to fund domestic lending. Also, a large share of trade finance is channelled through local banks.
Across EMEs, the reliance of NFCs on EFD reflects the size and openness of the economies they operate in. In absolute terms, EFD at end-2019 was highest for NFCs in China, followed by India, Mexico and Brazil, all among the largest EMEs (Graph 2, left-hand panel). Scaling by GDP puts these amounts into perspective (right-hand panel). The half-trillion EFD of NFCs resident in China amounted to only 3.3% of Chinese GDP - the lowest ratio in the sample. At the other end of the spectrum are smaller financially open economies, where NFCs' EFD surpassed 20% of GDP. Some NFCs resident in EMEs have foreign parents that may guarantee portions of the debt incurred, although BIS data do not reveal this.
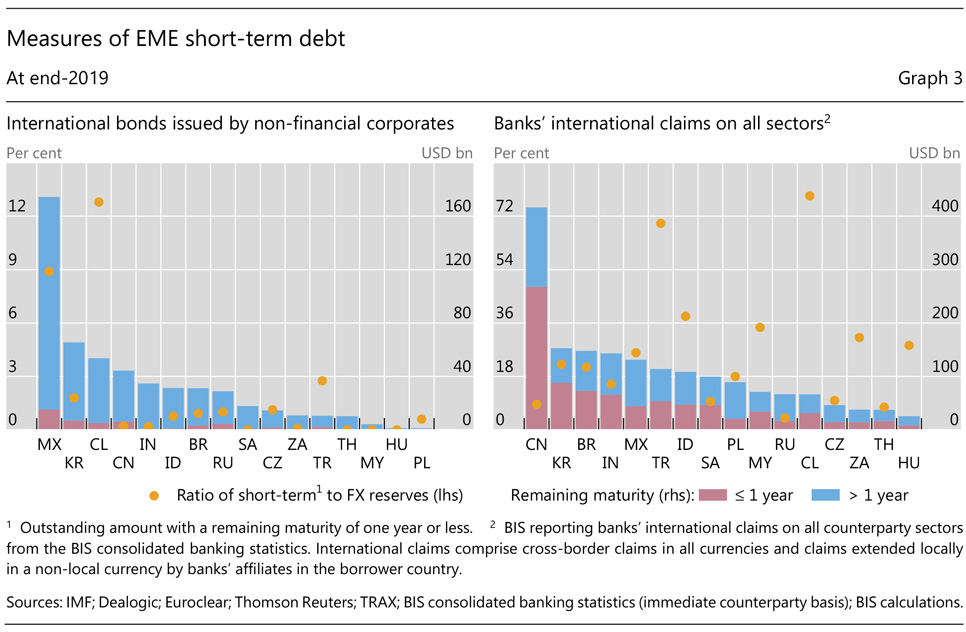
One source of stability is the fact that many NFCs issue bonds with long maturities, and thus face limited rollover risk. At end-2019, only a small fraction was due for repayment within a year (Graph 3, left-hand panel). The share was below 10% for most EMEs shown. All this, however, does not preclude a tightening of financial conditions if foreign investors sell their holdings (see last section).
Cross-border bank credit, which tends to have shorter maturities, can contract more quickly during stress periods such as the GFC. While BIS data do not track the maturity profile of lending to NFCs specifically, they do provide a maturity breakdown of banks' international claims on borrowers in all sectors taken together (Graph 3, right-hand panel).8 On average, short-term claims - defined as those with a remaining maturity of up to one year - accounted for over 40% of total claims, with higher shares for China (64%) and Korea (57%) and lower shares for Russia (26%) and Poland (23%). These figures overstate the share of short-term claims on NFCs in those countries that receive more (short-term) interbank credit overall (eg EMEs in Asia). That said, (net) interbank borrowing can be relevant to the NFC sector through the indirect channel shown in Graph 2.
Applying a simple standard reserve-adequacy rule suggests that the EMEs shown here should be able to weather plausible contractions in short-term credit to their NFCs over the near term (yellow dots in Graph 3). The ratio of short-term debt to international reserves became a key metric characterising the EME crises in the 1990s (Chang and Velasco (1999), IMF (2016)). The ratios here lie well below 100% for most of the countries shown, although they will of course be higher when the external liabilities of other sectors are included as well. Any vulnerability assessment would recognise that many EMEs have substantial external assets and natural hedges in the form of export revenues too.
Foreign currency debt
Total foreign currency debt (FCD) includes any loans and debt securities denominated in foreign currencies (see box). Foreign currency debt, if not hedged, can pose financial stability risks through the financial channel of the exchange rate (Chang and Velasco (1999), Bruno and Shin (2015)). Sharp depreciations of EME currencies against the US dollar (such as those that took place during the Covid-19 stress period) reduce the creditworthiness of currency-mismatched EME borrowers and lead to a tightening of financial conditions thorough both demand and supply effects.
Rankings of EMEs based on the level and relative importance of FCD (Graph 4) are similar to those based on EFD discussed above, albeit with exceptions. This is not surprising given that most external debt is denominated in foreign currencies. By outstanding stocks at end-2019 (left-hand panel), China, Mexico and India were among the top five EMEs on both measures. And when FCD is scaled by GDP (centre panel), the five EMEs (Chile, Turkey, Mexico, Czech Republic and Malaysia) that emerge on top are exactly the same as in the case of EFD, albeit in a different order. That said, the two indicators differ for several EMEs. FCD is considerably higher (by 15% of GDP) than EFD for Turkey. By contrast, EFD exceeds FCD by a wide margin in the Czech Republic (by 17% of GDP) and Malaysia (by 10% of GDP).
US dollar debt accounted for the bulk of FCD in most EMEs (Graph 4, left-hand panel, red bars). The dominance of the dollar is most pronounced in emerging Asia and Latin America. By contrast, emerging Europe relies more on euro-denominated credit (blue bars).
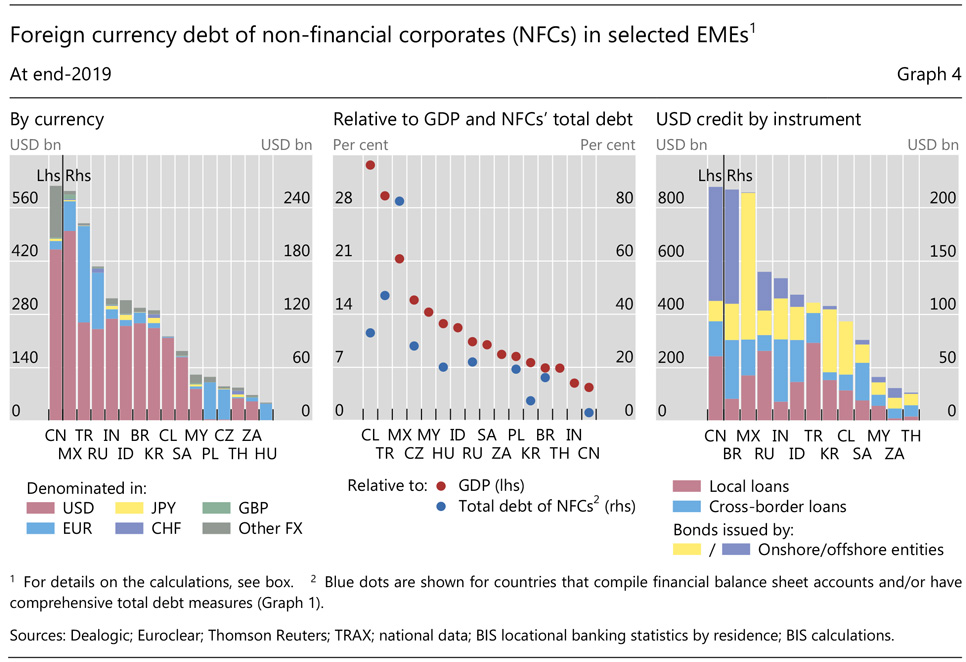
Any assessment of vulnerabilities related to FCD should take into account several additional points about the incompleteness of available data. First, the benchmark FCD estimates in the left-hand panel of Graph 4 actually underestimate the foreign currency debt since they are based on the residence (as opposed to the nationality) of borrowers.9 They ignore the fact that some NFCs have issued debt securities through offshore entities (McCauley et al (2015b), Coppola et al (2020)). Once this offshore issuance is taken into account, the US dollar debt of several major EMEs, notably Brazil, China, India and Russia, rises considerably (Graph 4, right-hand panel).
Second, the amounts owed in foreign currencies could be higher still, since the estimates in Graph 4 capture only on-balance sheet liabilities; they do not include borrowing through FX derivatives. Many NFCs sell commodities and finished products, or buy manufacturing inputs on global markets, where the US dollar is used as an invoicing currency. They may hedge future foreign currency payment and revenue streams using FX forwards. While exact numbers for EME borrowers are not available, a rough estimate suggests around $2 trillion in dollar repayment obligations via FX derivatives at end-2019, on top of nearly $2.6 trillion in on-balance sheet dollar debt.10 Even when derivatives are used to hedge FX risk, they can still involve significant liquidity risk due to maturity mismatches.
At the same time, there are several important factors that tend to mitigate FCD-related risks. For example, commodity exporters (eg Chile, Mexico, Russia and Saudi Arabia) have natural hedges in the form of dollar-denominated revenues. That said, the recent sharp fall in commodity prices may leave these exporters exposed. Meanwhile, NFCs, as well as other sectors in EMEs, hold foreign currency assets that can be drawn on to service debt in times of need. NFCs from EMEs have placed nearly $1 trillion in dollar and euro deposits with BIS reporting banks, and may have other foreign currency assets, such as foreign direct investment, that are more difficult to observe (and liquidate). Broadening this to all sectors, Hungary, South Africa, the Czech Republic, Chile and Malaysia each hold foreign currency assets worth more than 100% of GDP; many other EMEs also have more foreign currency assets than liabilities in their international investment position (IMF (2019), Bénétrix et al (2019)). The precise impact of the above factors on alleviating currency mismatches is not clear in the aggregate data, but authorities in some EMEs (eg Chile) monitor corporates' FX exposures to ensure they are properly hedged (Central Bank of Chile (2018)).
Dollar debt in early 2020
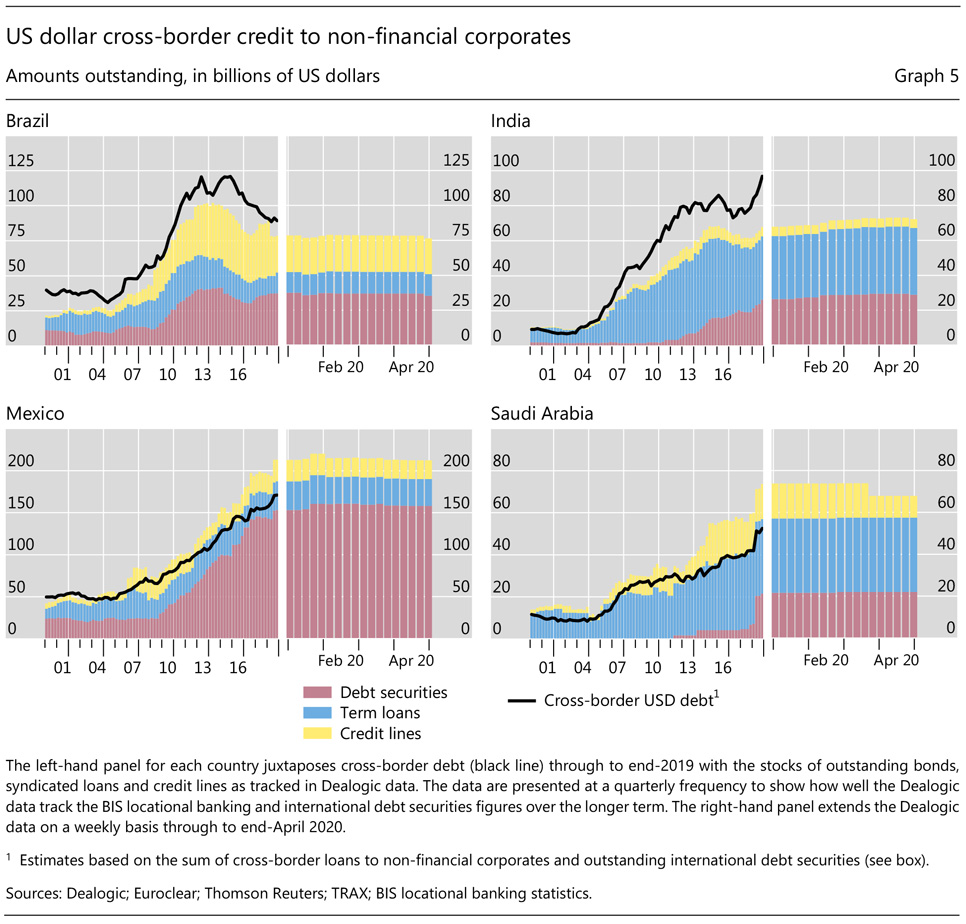
How has US dollar credit to EME NFCs evolved during the pandemic? The most recent BIS international banking statistics relate to end-2019, and thus do not cover that period.11 For their part, the BIS IDS statistics are available at end-Q1 2020, and show that outstanding stocks of EME NFCs' international debt securities actually increased marginally in the first quarter.
To examine these dollar debt stocks further into 2020, we employ Dealogic data on syndicated loans and bond issuance, which are less complete but available on a timelier basis. Graph 5 juxtaposes the estimated stock of cross-border dollar debt of several major EMEs through to end-2019 (black line) against the stock derived from Dealogic data (stacked bars) for selected EMEs.12 On the surface, the latest data do not show a contraction in NFCs' cross-border dollar debt stocks during the pandemic, mainly due to the long maturity of this debt (recall Graph 3). Indeed, it is possible that outstanding debt stocks may have increased, since corporates facing cash flow problems are likely to have tapped their credit lines in early 2020. Such drawdowns generate new credit, adding to outstanding bank claims.13
Several additional indicators, however, do show signs of a deterioration in financing conditions in EMEs (Graph 6). Net issuance of new dollar debt by EME NFCs plunged into negative territory after the pandemic went global (-$14 billion during March and April). Compiling the debt stocks on a nationality basis (which includes the debt of domestic NFCs' non-resident affiliates) shows an even sharper contraction: -$37 billion in March and April, the largest bimonthly decline since the GFC (left-hand panel). Data from the Institute of International Finance (IIF) also point in the same direction.14 They reveal that, during the first three months of the Covid-19 stress period, portfolio debt outflows from the EMEs tracked by the IIF exceeded $30 billion and were considerably larger than the respective outflows during the GFC.
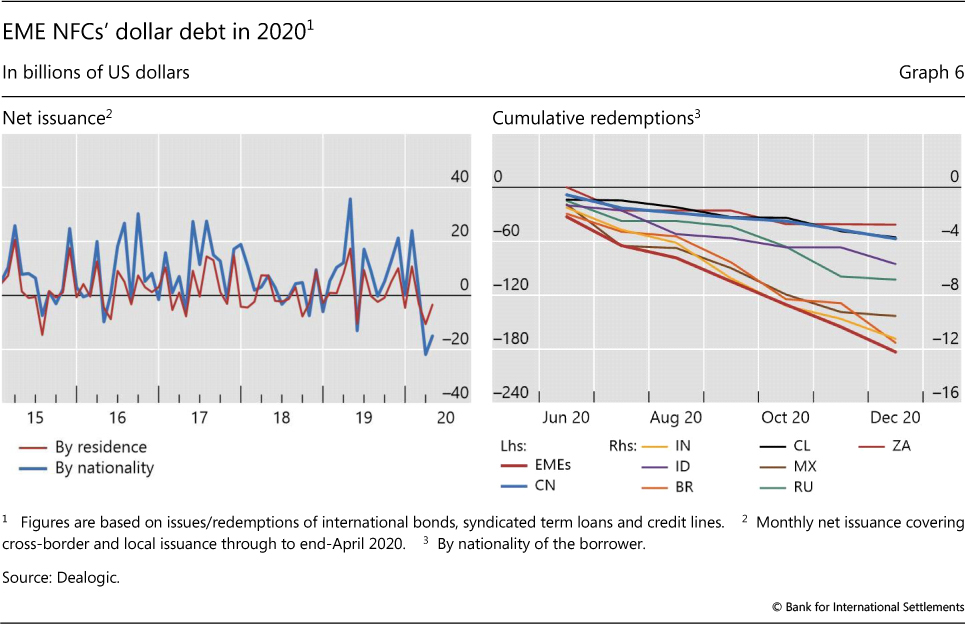
If financial conditions were to continue to deteriorate, many EME NFCs might have problems refinancing the portion of their dollar debt that is scheduled to mature over the next few months. For EMEs as a group, close to $200 billion in dollar debt (or 8% of the end-2019 debt stock) will mature between June and December 2020 (Graph 6, right-hand panel). Across individual countries, corporates from China ($57 billion, or 10% of the outstanding stock), Brazil ($12 bilion, 6%), India ($11 billion, 9%) and Mexico ($10 billion, 4%) will have the highest refinancing needs for the rest of the year.
Conclusion
The international dimensions of debt expose corporates and other borrowers to heightened funding risk when global markets become unsettled. External financing, particularly if short-term, can disappear when creditors get skittish. And foreign currency debt can be difficult to roll over when local currencies depreciate. Many of the EMEs examined in this feature, and many other countries around the world, are exporters of commodities, goods and services priced and traded in dollars. The associated dollar revenue has served as a natural hedge against currency mismatches. However, falling sales and commodity prices portend difficulties for NFCs in servicing their international debt. This debt bears watching as the pandemic's impact on the global economy continues to unfold.
References
Avdjiev, S, R McCauley and H S Shin (2016): "Breaking free of the triple coincidence in international finance", Economic Policy, vol 31, issue 87, pp 409-51.
Bénétrix, A, D Gautam, L Juvenal and M Schmitz (2019): "Cross-border currency exposures", IMF Working Papers, no WP/19/299.
Borio, C, R McCauley and P McGuire (2011): "Global credit and domestic credit booms", BIS Quarterly Review, September, pp 43-57.
Borio, C, R McCauley and P McGuire (2017): "FX swaps and forwards: missing global debt?", BIS Quarterly Review, September, pp 37-54.
Bruno, V and H S Shin (2015): "Global dollar credit and carry trades: a firm-level analysis", Review of Financial Studies, vol 30, pp 703-49.
Calvo, G (1998): "Capital flows and capital-market crises: the simple economics of sudden stops", Journal of Applied Economics, vol 1, no 1, pp 35-54.
Cantú, C, T Goel and J Schanz (2020): "EME government debt: cause for concern?", BIS Quarterly Review, June, pp 15-16.
Central Bank of Chile (2018): "Financial volatility and external debt", Monetary Policy Report, September.
Chang, R and A Velasco (1999): "Liquidity crises in emerging markets: theory and policy", NBER Macroeconomics Annual 1999, vol 14.
Coppola, A, M Maggiori, B Neiman and J Schreger (2020) "Redrawing the map of global capital flows: the role of cross-border financing and tax havens", working paper, April.
Dembiermont, C, M Drehmann and S Muksakunratana (2013): "How much does the private sector really borrow? A new database for total credit to the private nonfinancial sector", BIS Quarterly Review, March, pp 65-81.
Ehlers, T and P McGuire (2017): "Foreign banks and credit conditions in EMEs", BIS Papers, no 91, March.
Eichengreen, B (2020): "Managing the coming global debt crisis", Project Syndicate, 13 May.
Forbes, K and F Warnock (2012): "Capital flow waves: surges, stops, flight, and retrenchment", Journal of International Economics, 88, pp 235-51.
Garcia Luna, P and B Hardy (2019): "Non-bank counterparties in international banking", BIS Quarterly Review, September, pp 15-33.
Hardy, B (2019): "Emerging markets' reliance on foreign bank credit", BIS Quarterly Review, March, pp 15-28.
Hofmann, B, I Shim and H S Shin (2020): "Emerging market economy exchange rates and local currency bond markets amid the Covid-19 pandemic", BIS Bulletin, no 5, 7 April.
Hördahl, P and I Shim (2020): "EME bond portfolio flows and long-term interest rates during the Covid-19 pandemic", BIS Bulletin, no 18, 20 May.
International Monetary Fund (IMF) (2016): "Guidance note on the assessment of reserve adequacy and related considerations", June.
--- (2019): External Sector Report, July.
McCauley, R, P McGuire and V Sushko (2015a): "US monetary policy, leverage and offshore dollar credit", Economic Policy, vol 30, no 82, April, pp 187-229.
--- (2015b): "Dollar credit to emerging market economies", BIS Quarterly Review, December, pp 27-41.
Tissot, B (2016): "Globalisation and financial stability risks: is the residency-based approach of the national accounts old-fashioned?", BIS Working Papers, no 587, October.
1 The authors thank Iñaki Aldasoro, Claudio Borio, Michael Chui, Stijn Claessens, Mathias Drehmann, Bryan Hardy, Catherine Koch, Dubravko Mihaljek, Swapan-Kumar Pradhan, Hyun Song Shin and Philip Wooldridge for valuable comments, and Bat-el Berger, Jakub Demski, Kristina Micic and Marjorie Santos for excellent research assistance. The views expressed in this article are those of the authors and not necessarily those of the Bank for International Settlements.
2 In the run-up to the GFC, cross-border credit to EMEs, provided mainly by global banks, fuelled domestic credit booms, and the reversal in credit flows during the crisis exacerbated the economic downturns that followed (Borio, McCauley and McGuire (2011), Ehlers and McGuire (2017)).
3 Previous crises in EMEs tended to be associated with international borrowing by sovereigns (eg in the 1980s) or banks and other financial institutions (eg in the 1990s). Sovereigns have moved from borrowing in foreign currency towards doing so in domestic currency (Cantú, Goel and Schanz (2020, in this issue)), and banks manage their currency mismatches more carefully now.
4 Total credit to NFCs in China stood at $21.2 trillion at end-2019, up by $15.3 trillion (more than 250%) since end-2009. Total credit to NFCs in all other countries in Graph 1 rose by a combined $2.8 trillion, or 61%, over this period.
5 Adding indirect cross-border bank credit may overstate credit to NFCs in a country because this credit may be passed on to sectors other than NFCs.
6 The estimates in this section are on a residency basis, following international reporting standards (Tissot (2016)). Offshore debt (ie bonds issued by affiliates abroad) is incorporated in the next section.
7 The outstanding stock of international debt securities (IDS) may overstate externally funded debt if these securities are held by residents. For most countries in Graph 2, the stock roughly matches cross-border debt security liabilities as tracked in international investment position (IIP) data, with Korea and Russia being exceptions (grey dots, left-hand panel). We nevertheless use the IDS series, since it provides the currency breakdown needed in the following two sections.
8 International claims include loans, bonds and other financial claims extended cross-border or locally in foreign currencies. By including all sectors, they overstate credit to the NFCs but are correlated with both external and foreign currency bank credit.
9 See Avdjiev, McCauley and Shin (2016) for a discussion of why the traditional assumption of a "triple coincidence" of GDP area, decision-making unit and currency area in international finance is often misleading.
10 The BIS over-the-counter derivatives statistics on which this estimate is based do not break out dollar borrowing via FX swaps by non-banks in EMEs. However, at-end 2019, EMEs accounted for about half of global trade, which importers/exporters hedge using FX forwards and swaps, and for 43% of outstanding US dollar debt securities, which are hedged by currency swaps (Borio, McCauley and McGuire (2017)). Applying these shares to all non-financials' $7.8 trillion in dollar positions in these instruments and dividing by two yields the estimate for EME non-financials.
11 Data for Q1 2020 are expected to be released by end-July 2020.
12 The Dealogic data capture bonds and term loans as well as credit lines, although it is not known whether the credit lines have been drawn (and thus included in debt stocks) or remain untapped. The match between the two series is not perfect because some cross-border loans are not syndicated (and thus not captured in Dealogic data) and because of an imperfect overlap of the debt securities captured in Dealogic and in the BIS IDS statistics.
13 Graph 3 in the Statistical Release of the BIS international banking statistics at end-December 2019 shows a snapshot for key EMEs of the outstanding stock of foreign claims (guarantor basis) and the amount of undisbursed credit commitments. For most EMEs, the undisbursed credit commitments at end-2019 amounted to 10−15% of the outstanding stock of claims. Borrowers in Mexico even had undrawn credit lines worth $70 billion, or 19% of foreign claims on Mexico.
14 The IIF data capture net transactions by non-residents (rather than new debt creation) and do not have sector or currency breakdowns. Nevertheless, they do give an indication of foreign investors' treatment of NFCs' dollar bonds, which are a large share of EMEs' externally held bonds. See also Hofmann, Shim and Shin (2020) and Hördahl and Shim (2020).