The financial sector - preparing for the future
Abstract
The financial sector faces an improving but still challenging environment. The nearterm economic outlook has brightened substantially. At the same time, intermediation margins remain compressed across the major economies and the sector is grappling with structural forces such as technological innovation and consolidation pressures. With the main chapters of regulatory reform about to be closed, space is opening up for banks and other financial institutions to further increase resilience. One area of attention is global US dollar funding markets, which are likely to remain a key pressure point during episodes of market stress. Banks' continued heavy reliance on short-term US dollar funding, paired with a high degree of market concentration and interconnectedness, underscores the importance of supervisory cooperation and effective backstops. The ultimate aim is a stronger financial system that helps support the resilience of the global economy.
Full text
The financial sector faces an improving but still challenging environment. The near-term economic outlook has brightened substantially, and financial headwinds have turned into tailwinds in many advanced economies. Even so, uncertainty about the sustainability of the expansion lingers alongside structural challenges, such as technological innovation and consolidation pressures. And interest rates and term premia remain low across the major economies, compressing intermediation margins.
Against this backdrop, and with the main regulatory reforms about to be completed, it is important that banks and other financial institutions take advantage of improved conditions to further increase resilience and reshape their business models. The ultimate goal is a stronger financial system that supports the resilience of the global economy. This requires the continued resolve of both the private and public sectors.
This chapter first reviews recent banking, insurance and asset management sector developments. It then discusses how banks are adjusting their business models in response to key financial sector trends. It finally elaborates on changing US dollar funding patterns and their implications for bank business models and systemic risk.
Financial institutions: dissipating headwinds
Banks
In recent years, bank profitability has been hamstrung by tepid economic growth, low interest rates and relatively muted client activity. Yet, with the global recovery maturing and monetary policy in key jurisdictions poised for a gradual tightening, the outlook for banks' bottom line is now improving. This underlines the need for banks to use the "growth dividend" of dissipating headwinds to complete the adjustment of their business models to the post-crisis reality.
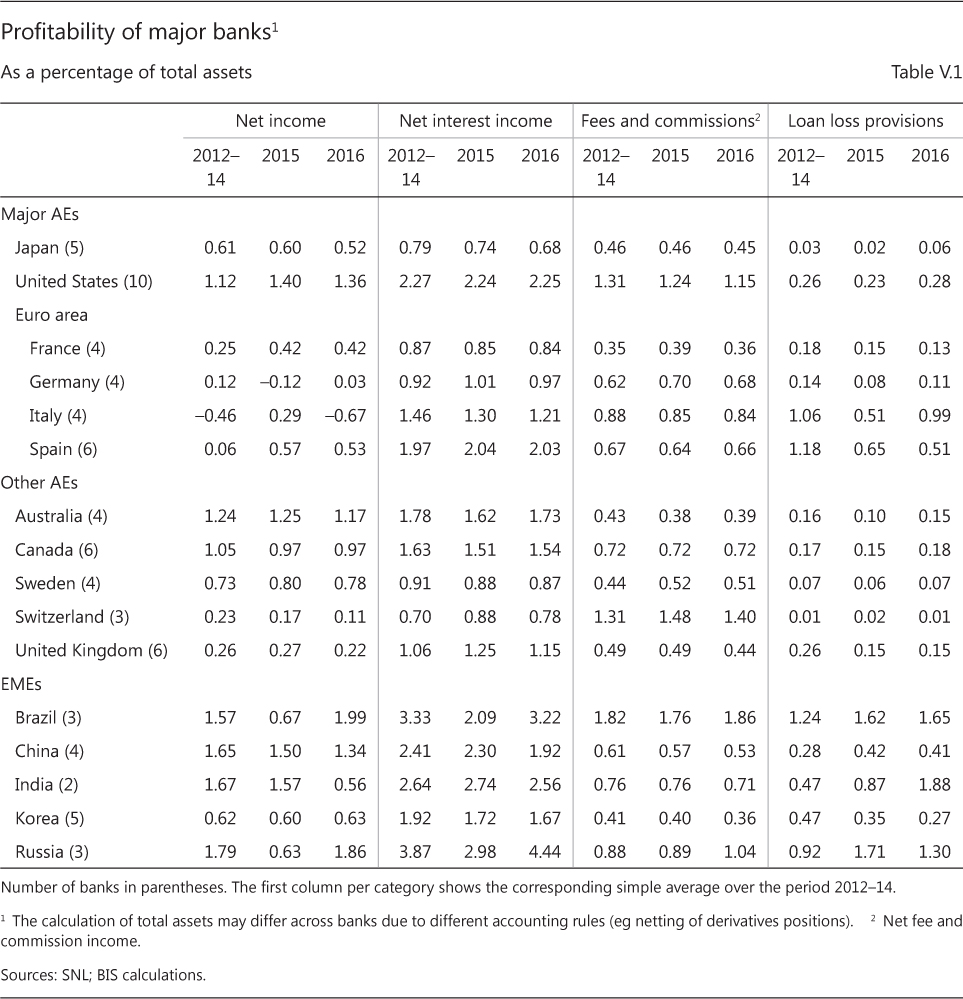
Conjunctural factors continued to be a drag on profitability, even though the impact varied across regions. Net income, for example, remained well below pre-Great Financial Crisis (GFC) levels. Relative to total assets, it hovered around zero across much of Europe and was only slightly higher in many other jurisdictions, including key emerging market economies (EMEs). Past years of low and declining interest rates had eroded yields on earning assets. Even though interest expenses also declined, assets typically repriced more quickly, weighing on net interest income. Revenue from fees and commissions and other capital market activities also remained subdued. That said, corporate bond issuance and merger and acquisition (M&A) activity supported bank revenues in jurisdictions such as the United States (Table V.1).
There are now signs that conjunctural headwinds are receding. To the extent that economic activity continues to strengthen, higher interest rates and rising term spreads should support intermediation margins. Stronger demand for banking services and higher capitalisation levels, in turn, should underpin business volume and balance sheet expansion. And both revenue growth and capital buffers would help cushion any interest rate-driven valuation losses on securities portfolios. Post-crisis declines in interest rates have increased the duration of outstanding securities, making unhedged fixed income positions vulnerable to mark-to-market losses ("snapback risk", Chapter II). Such pressures could be particularly pronounced in a context of tightening US dollar funding conditions (see below).
Individual banks' ability to benefit from the improved macroeconomic backdrop and rising interest rates depends on a number of factors. One is asset composition: revenue growth is driven by the rollover of maturing fixed rate assets and loans and, hence, depends on the share of fixed rate versus floating rate assets. On the liabilities side, core deposits are known to be relatively price-insensitive. Since they are a key funding source for many banks, increases in funding costs generally lag those in short-term rates. In addition, moderately stronger economic growth and higher rates tend to boost client activity across several business lines. Indeed, starting in mid-2016 capital market revenues benefited from higher market volatility after the Brexit referendum and in anticipation of US policy rate action (Chapter II).
Another factor is asset quality. This should generally improve as GDP growth picks up, unemployment declines and rising demand supports the corporate sector. In most advanced economies, expectations are that this will help non-performing loans (NPLs) to level off and ultimately decline. That said, banking systems in some jurisdictions still look vulnerable to a further deterioration in credit quality. In a number of euro area countries, for example, the share of NPLs remains stubbornly high. Structural factors, such as ineffective legal frameworks and defective secondary markets for NPLs, have been hindering the resolution of problem loans. 1
The outlook for asset quality becomes more differentiated once countries' position in the financial cycle is considered (Chapter III). Standard metrics, such as credit-to-GDP gaps, signal financial stability risks in a number of EMEs, including China and other parts of emerging Asia. Gaps are also elevated in some advanced economies, such as Canada, where problems at a large mortgage lender and the credit rating downgrade of six of the country's major banks highlighted risks related to rising consumer debt and high property valuations. 2 While banks' NPL ratios in all these countries mostly remained low, a majority of EMEs have continued to see financial booms, flattering credit quality indicators. Thus, loan performance should be expected to deteriorate once the financial cycle turns. In addition, pressures could also emerge as a result of spillovers from tighter US monetary policy. In some Asian economies, for example, non-financial corporates took advantage of easy global financing conditions to leverage up in US dollars. 3 Many of these corporates may thus find themselves unhedged and exposed to currency mismatches if their domestic currencies depreciate. Any balance sheet strains, therefore, could ultimately feed into banks' credit risk exposures.
Other financials
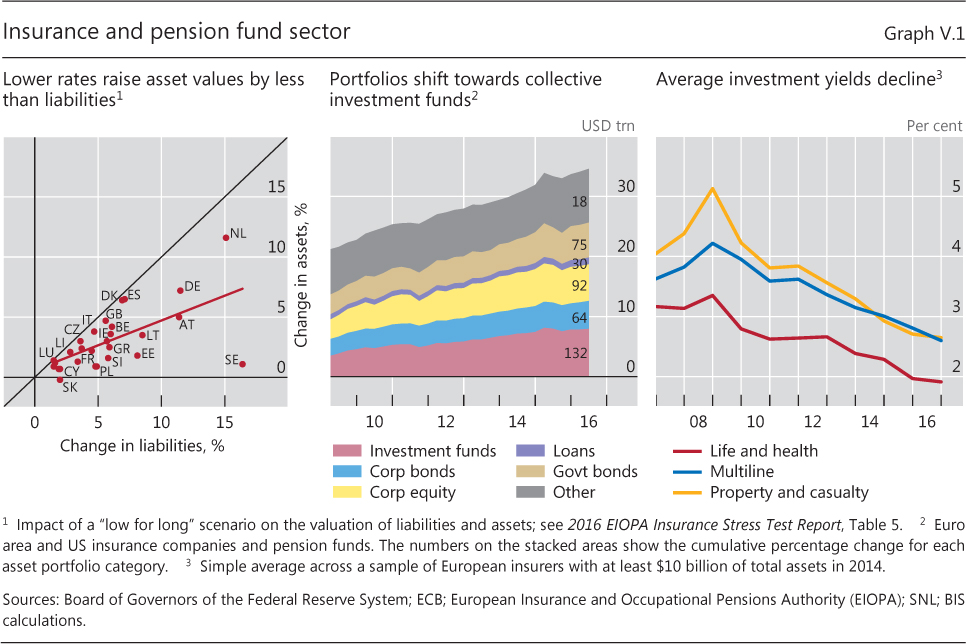
Just like their banking sector peers, many insurance companies continued to struggle with the confluence of an often sluggish recovery and low interest rates. Insurers' performance depends on investment returns and the business mix, primarily property and casualty (P&C) and life insurance, as well as the importance of legacy guaranteed-return contracts. Declining interest rates inflate the value of both assets and liabilities, but long maturities and negative duration gaps mean that the net effect is negative (Graph V.1, left-hand panel). Together with low investment returns, this can cause considerable strains, particularly for life insurers with high guaranteed rates in the legacy book, such as in Germany and the Netherlands.
In recent years, insurers - and pension funds - have tackled these pressures in a variety of ways. On the liabilities side, they have shifted underwriting practices towards contracts with reduced or no guarantees as well as unit-linked products, which place the investment risk with the policyholder. Such adjustments, however, can take a rather long time to be effective. For instance, according to the International Association of Insurance Supervisors, some 80% of life insurance premiums in Germany are for previously written guaranteed rate plans.
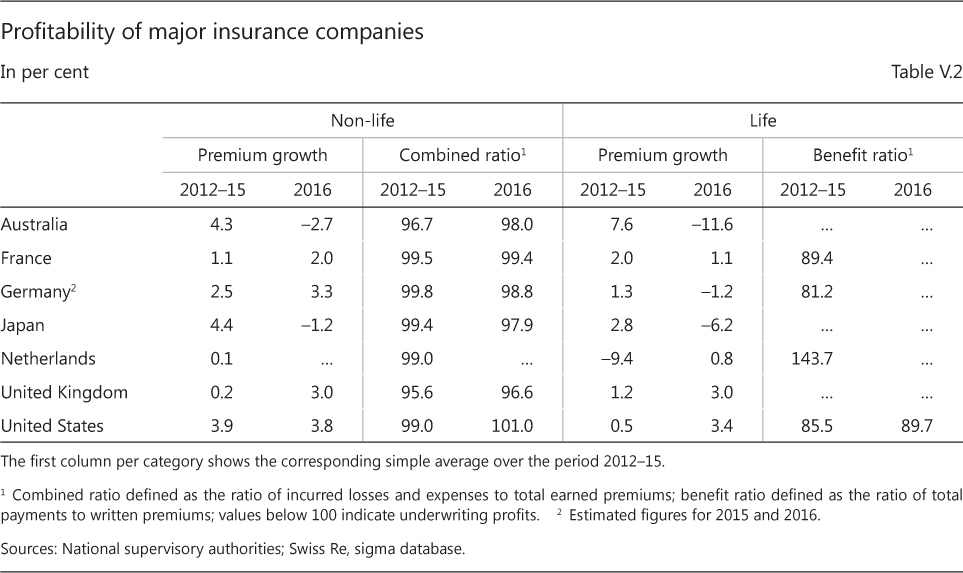
On the assets side, there has been a trend to reach for yield. Asset allocation has shifted towards riskier assets, often via collective investment vehicles and in foreign currency (Graph V.1, centre panel). For example, the proportion of investment fund shares in the sector's total assets rose from 16% in 2009 to 23% in 2016, on average, in the United States and the euro area. Even then, given prudential considerations, changes in asset portfolio composition were generally too modest to prevent investment yields from falling further (Graph V.1, right-hand panel). On balance, however, in 2016 many insurers enjoyed profits, thanks to higher gross premiums and improved conditions (such as low natural catastrophe losses) in the non-life market (Table V.2).
While profitability pressures are likely to continue, the outlook is improving across the major insurance markets. This should support premium growth. In life insurance, premium volumes tend to be highly correlated with employment and GDP, as a stronger economy pushes up sales. Rising interest rates, in turn, would boost asset values relative to liabilities, generating valuation gains, and help alleviate some of the margin pressure on guaranteed-return products. That said, investment returns will adjust only gradually, as portfolios continue to be heavily tilted towards fixed income instruments and many insurers have been forced to replace maturing bonds with lower-yielding securities. In addition, in life insurance additional investment income accrues mostly to policyholders. This is in contrast to the P&C business, where the investment risk and associated returns are fully borne by the insurer.
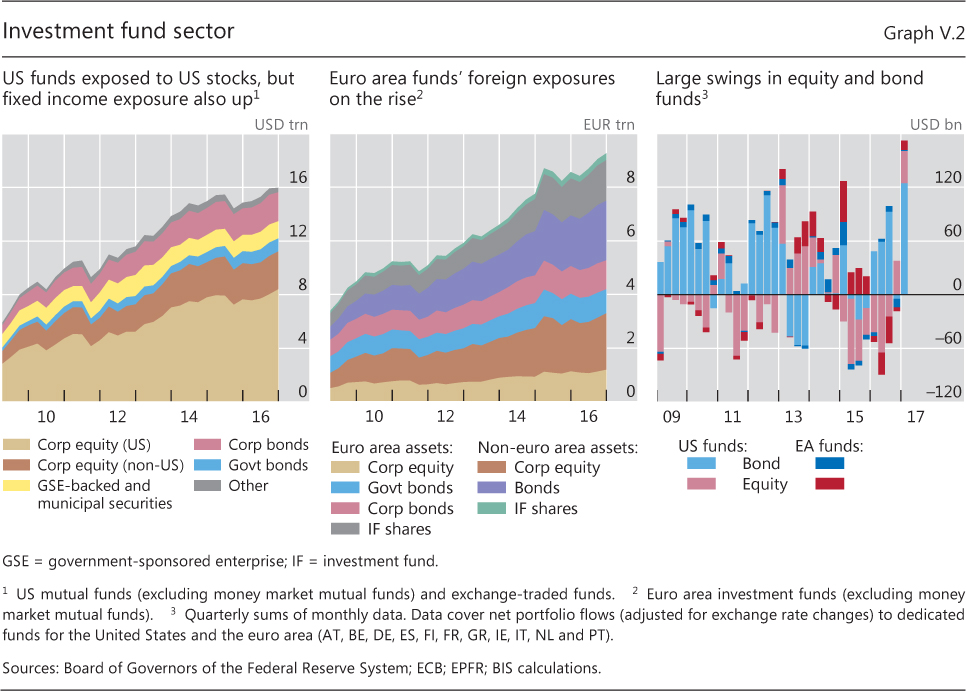
Yet there could be risks to profitability, especially if markets disappoint. One such risk stems from the sector's increased equity holdings, which expose insurers to stock market corrections and tail risks (Chapter II). Another risk may come from high direct and indirect investment fund exposures. Over the last few years, asset managers and other return-sensitive investors have increased their footprint in markets for less liquid or riskier assets, such as corporate bonds (Graph V.2, left-hand and centre panels). Given these investors' growing allocations to such asset classes, their portfolio decisions may test market liquidity under stress, which hinges on market-makers' willingness to accommodate temporary supply-demand imbalances. 4 Sure enough, net flows into and out of investment funds have been very volatile, such as during the "taper tantrum" bond market sell-off of 2013 (Graph V.2, right-hand panel). The resulting redemption pressures can generate "fire sale externalities" that would affect insurers' investment income both directly, through their investment fund holdings, and indirectly, through any impact on market prices.
Bank business models: the quest for sustainable profits
Banks have been facing persistent pressures to reshape their business models post-GFC. Notable progress has been made in diversifying both income streams and funding mix, while reducing balance sheet leverage. Yet market valuations for many banks still point to investor scepticism. The sector thus still needs to adapt to generate sustainable profits.
Signs of progress, but scepticism remains
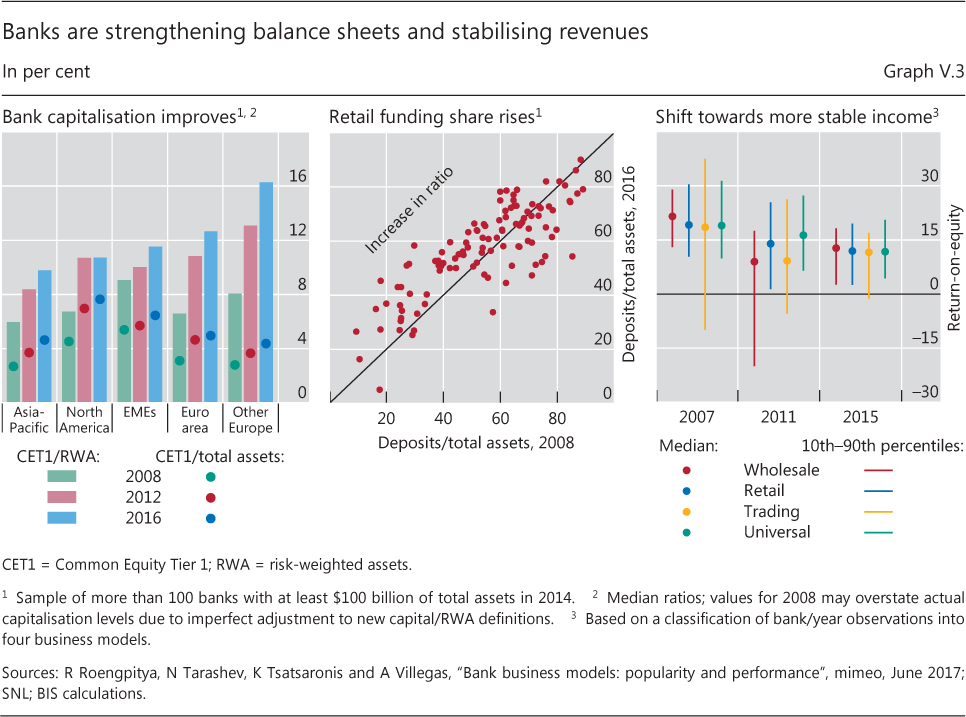
Post-crisis, global banks' business models have been challenged. In addition to a difficult conjuncture (see above), banks have been under market and regulatory pressure to raise capitalisation levels, often decisively, and cut leverage (Graph V.3, left-hand panel). Overall, the transition to higher capital ratios, both in risk-adjusted and non-risk adjusted terms, is nearing completion and has primarily been achieved through retained earnings. Most banks monitored by the Basel Committee on Banking Supervision already meet the fully phased-in Basel III standards. The larger internationally active banks report, on average, a Common Equity Tier 1 (CET1) capital ratio of nearly 12% and a leverage ratio of 5.6%.
Two other major trends have marked banks' adjustment to the post-crisis environment. One concerns their funding mix: banks have generally reduced their reliance on (unsecured) short-term wholesale funding and increased that on retail funding, such as customer deposits. This has formed part of a broader shift towards more retail-oriented business models, with relatively stable funding and income sources (Graph V.3, centre and right-hand panels). Activity has also shifted towards collateralised funding and central clearing, reflecting a keener awareness of counterparty credit risks as well as regulatory incentives. That said, exposure to rollover risks remains significant in some cases, notably in the global US dollar funding market (see next section).
The other trend concerns banks' activity mix. Post-crisis, many banks downsized or exited business lines that had suffered large losses in the past or that had exposed them to litigation risks. For many major banks, headline revenues from activities such as proprietary trading have diminished and been partly replaced by other sources of non-interest income, such as wealth management. Yet, while a more diversified income base supports more sustainable profits, scale economies and competitive pressures point to diversification limits for smaller banks and the banking sector as a whole.
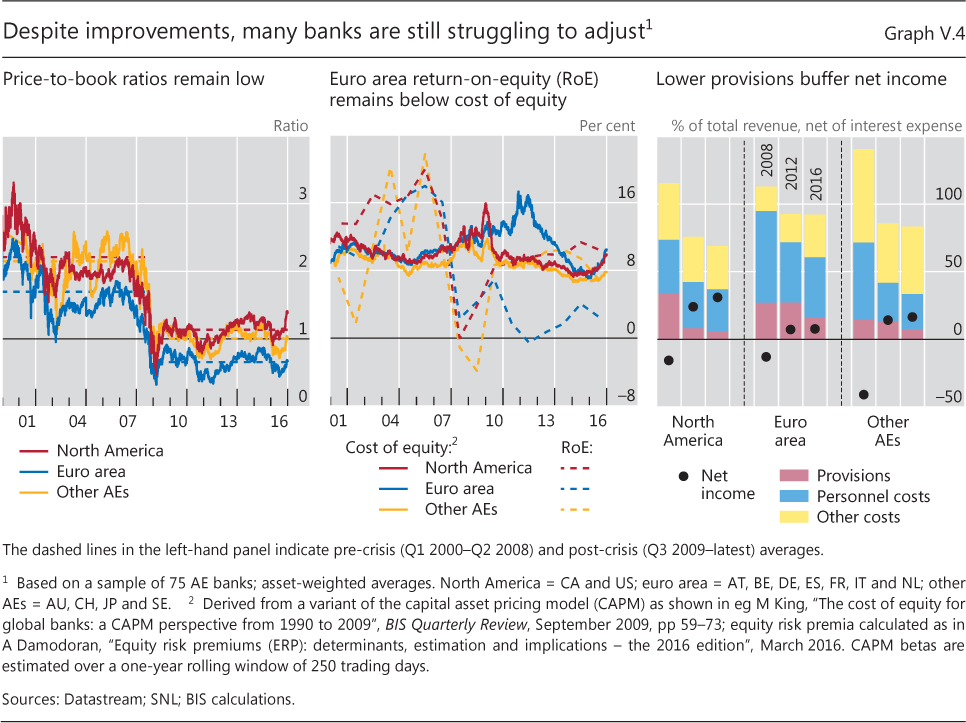
Despite the progress made and signs of an improved earnings outlook (see above), market valuations continue to suggest investor scepticism about bank business models, at least in some jurisdictions. For example, while broadly recovering most recently, price-to-book ratios have remained below unity for many advanced economy banks (Graph V.4, left-hand panel). Part of this scepticism reflects the macroeconomic outlook and unresolved NPL problems in some countries (see above). Another part points to unfinished business model adjustments and limited earnings capacity more generally.
This is in line with how returns-on-equity (RoEs) have developed relative to investors' required returns. To be sure, the gap between observed and required returns has narrowed. Even so, it remains positive in some regions, suggesting that current RoEs continue to fall short of investor expectations (Graph V.4, centre panel). This is so even though market-based estimates of the cost of bank equity have receded from their crisis highs and broadly returned to their pre-crisis levels. Notably, in Europe the gap widened most recently, highlighting persistent pressures to further improve profitability.
Moving ahead?
What steps are needed to alleviate market scepticism and complete business model adjustments? Naturally, there is no "one size fits all" solution. However, several areas are likely to remain important from both an individual bank and a banking sector perspective: (i) capital allocation; (ii) cost efficiency; and (iii) excess capacity.
Banks' capital allocation decisions determine the balance sheet capacity available across business lines. The design of the Basel III framework, with its reliance on multiple regulatory metrics, and the greater use of supervisory stress testing in some jurisdictions mean that banks may have to adjust their capital allocation practices. Given the interaction between regulatory constraints, optimal capital allocation now involves considering multiple risk-return trade-offs. For example, there is anecdotal evidence that banks implement the leverage ratio at the business unit level, as opposed to the firm-wide level foreseen under Basel III. This simplifies capital allocation, but also implies that the leverage ratio may discourage certain low-risk/high-volume activities, such as market-making or repo market intermediation, even when the leverage ratio is not binding at the consolidated level (Box V.A). This would tend to open up business opportunities for competitors, in turn promoting further adjustments to banks' practices until the industry converges to a new benchmark. Policymakers can aid this convergence by swiftly finalising the remaining elements of regulatory reform and by ensuring consistent implementation. This includes setting a high bar for any proposed adjustments to the new regulatory standards, which should be based solely on assessments of regulatory benefits and costs at the social - not the private or sectoral - level.
The second area is improving cost efficiency, particularly in the light of increasing digitalisation and competition from non-bank entities. Despite some recent progress, cost-to-income ratios have remained stubbornly high for many banks, as cost savings have tended to go hand in hand with declining revenues. Although branch networks have generally been pruned, personnel costs, typically the largest component of banks' operating expenses, have changed little as a share of operating income - at least not after an initial, crisis-induced contraction. Much of the recent improvement in net income, particularly among European banks, was due to lower provisions, because of stronger credit quality, rather than lower operating costs (Graph V.4, right-hand panel). Pressures to further rein in costs thus remain strong, especially for banks in jurisdictions known to suffer from excess capacity. 5
Technological innovations, often referred to as "fintech", are likely to play an important role in this context. These innovations provide new ways to communicate, store and process information, and to access financial services. As such, they are changing how banks interact with each other and with their customers. In addition, many of these new technologies were created by non-financial firms and, in some cases, allow customers to access financial services without bank involvement, adding to competition and margin pressure. 6 Admittedly, the volume of fintech-related activities remains small, and many new applications may fail. Even so, some technologies have the potential to profoundly change bank business models.
Retail and commercial lending is one of the areas where competition between banks and fintech companies has been most direct. Electronic platforms such as online or peer-to-peer lenders, for example, facilitate credit provision by matching borrowers with investors (Box V.B). Total credit volumes have so far remained small relative to traditional bank lending. Yet recent trends indicate a range of activities that allow banks to exploit scale economies and link their own comparative advantages (eg a large client base and associated data) with those of partnering fintech firms (eg a low cost base).
Box V.A
Bank capital allocation with multiple regulatory metrics
Research suggests that complementary regulatory metrics, like those now introduced by the Basel III framework, can improve market outcomes and economic welfare. For example, non-risk-based metrics, such as the leverage ratio (LR), can act as backstops for banks' risk-weighted capital requirements.
 Multiple metrics require banks to adjust their internal capital (and liquidity) allocation management - a process that is still under way.
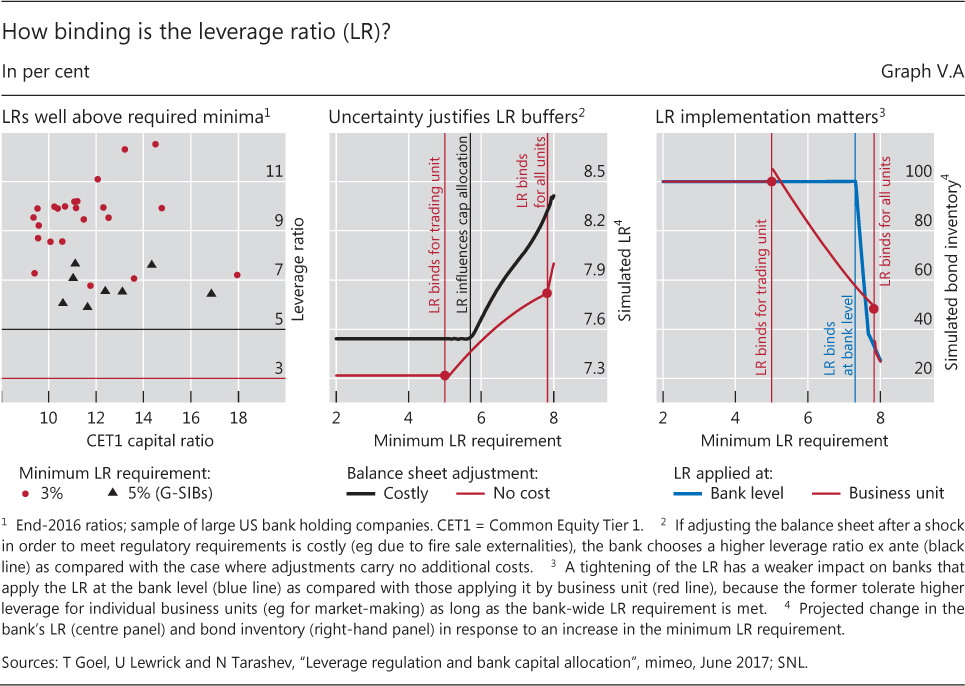
A simple model, which focuses on the role of the LR, helps to illustrate the impact of the interaction between such allocation decisions and regulation. The model, calibrated on US bank data, can rationalise why the LR may affect banks' capital allocation across business units (eg a trading unit and a loan-issuing unit as in the model) even if a bank reports an LR well above regulatory minima, as is generally the case (Graph V.A, left-hand panel).
First, banks need to strike a balance between expanding their balance sheets today and costly deleveraging in the future should they be hit by an adverse shock or subjected to a stress test. Since opting for a higher LR reduces the risk of having to deleverage, such uncertainties induce banks to hold a buffer over the minimum requirement (Graph V.A, centre panel).
Second, the LR tends to be tighter for banks that apply the ratio at a business unit rather than at the consolidated bank-wide level, as intended by regulation. In the former case, low-risk/high-volume activities with low risk-weighted regulatory capital charges, such as market-making, should be constrained most. Adjusting capital allocation to take a more bank-wide perspective would reduce the tightness of the LR. Simulations indicate that the associated capital relief could have sizeable effects on banks' balance sheets, eg by supporting banks' capacity to warehouse assets for market-making purposes (Graph V.A, right-hand panel). This points to scope for future adjustments to capital allocation frameworks to ease any perceived LR-induced pressures.
See eg F Boissay and F Collard, "Macroeconomics of bank capital and liquidity regulations", BIS Working Papers, no 596, December 2016. See I Fender and U Lewrick, "Calibrating the leverage ratio", BIS Quarterly Review, December 2015, pp 43-58. See T Goel, U Lewrick and N Tarashev, "Leverage regulation and bank capital allocation", mimeo, June 2017.
Box V.B
Banks and online lending: from competition to cooperation?
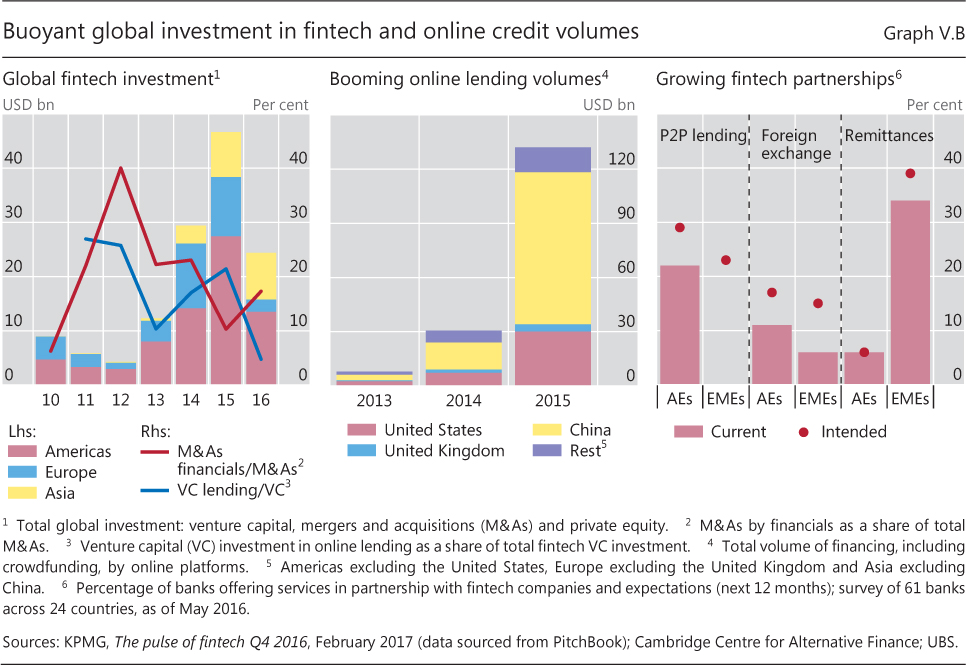
Fintech solutions enable customers to access financial services without - or with reduced - bank involvement, potentially disintermediating incumbents. Fintech investment has been growing strongly (Graph V.B, left-hand panel), albeit from a low base. One rapidly expanding area is online/peer-to-peer (P2P) lending, especially in jurisdictions such as China and the United States (centre panel). From a bank perspective, online lending presents both challenges and opportunities. Lending platforms are a potentially disruptive source of competition in a key business line, particularly if they are subject to more lenient regulation. Yet banks can also reap the cost reductions, improved customer experience and enhanced efficiency that these platforms offer. Many banks have thus been working actively to integrate online lending solutions into their business models.
One approach is for banks to directly invest in online platforms through mergers and acquisitions (M&As) or venture capital. M&As have generally accounted for the largest share of global fintech investment. A substantial part of these investments has come from banks and other financials, providing them with a stake in any returns and, in some cases, access to the platforms' technology. Banks also provide debt financing to fintech platforms, for example by funding fintech loans as institutional investors or by purchasing fintech loans.
Another approach is via partnerships. Partnerships in online/P2P lending and other fintech activities are expected to grow in both advanced and emerging market economies (Graph V.B, right-hand panel). This can take a variety of forms. One is referrals, whereby a bank refers certain borrowers to whom it denied credit to the fintech platform, while the fintech platform refers customers that require banking services to the bank. A second one is loan origination, in which the bank originates loans that have been assessed and priced on the online platform, sometimes selling these loans back to the platform. A third one involves the provision of services, such as payment and settlement services or guarantees. In some cases, mostly in the United States, banks have also supplied warehousing facilities and related services that allow online platforms to securitise fintech loans. Finally, some banks partner with platforms to use fintech models/processes in their own lending.
Fintech refers to a wide range of technologies, including online/peer-to-peer lending, payments and settlement (including distributed ledgers), insurance and trading/investment (including robo-advisers). See eg BIS, 86th Annual Report, June 2016, p 110.
With the fintech sector still evolving, a pressing question for regulators is how to ensure prudent risk management. 7 Technologies based on vast amounts of personal data, for example, give rise to new challenges in ensuring customer privacy and data security. Mounting concerns about cyber-security underscore the potential risks of technology-enhanced financial services. Due diligence of possibly multiple internal and external service providers may be needed to ensure IT systems' integrity. Furthermore, competition between banks and fintech platforms may require approaches that maintain a cross-sectoral level playing field ("same risk, same rules") to reduce regulatory arbitrage, while preserving incentives for technological innovation, such as via regulatory "sandboxes".
The third area concerns challenges at the industry level, such as excess capacity, which are likely to require a coordinated response by prudential authorities and policymakers. In many cases, excess capacity reflects policies that aim at protecting weak banks from failure by providing explicit or implicit public support. Clearly, such policies can be crucial in addressing systemic risks during crises. They can also be a catalyst for a concerted clean-up of bank balance sheets, for example by helping to sell off impaired assets. Yet they should not keep non-viable banks from exiting or become an obstacle to bank merger activity. Indeed, barriers to exit remain high in many banking sectors, notwithstanding improved resolution mechanisms and tightened conditionality on bank recapitalisations. Policymakers may thus need to step up their efforts to help reduce excess capacity in banking sectors that suffer from weak profitability. This includes complementary supportive measures, ranging from increased supervisory attention, to targeted legal steps to facilitate the workout of problem loans (including via dedicated asset management companies), to more comprehensive reforms that address deficiencies in national labour and capital markets (Chapter I).
US dollar funding: a key pressure point?
Since major banks are at the core of the global financial system, their business model choices can have far- reaching implications. The GFC, for example, illustrated how non-US banks' heavy reliance on wholesale and, in particular, US dollar funding can amplify systemic risk. In the run-up to the crisis, many banks had built up maturity mismatches in their foreign currency business. When wholesale markets dried up, maturing funds became difficult to roll over or replace, forcing banks to scramble for US dollar funding or deleverage. These funding pressures, in turn, quickly spilled over across counterparties and jurisdictions. Thus, structural vulnerabilities in banks' funding models increased the vulnerability of the financial system as a whole.
Post-crisis reforms have sought to minimise such risks. They have targeted bank resilience, in terms of both capital and funding, as well as that of other key market participants, such as money market mutual funds (MMMFs). Yet banks' continued heavy reliance on short-term US dollar funding remains a pressure point, especially given the high degree of market concentration.
US dollar funding risks
Foreign currency funding risk was prominent at the height of the GFC. In the wake of their rapid international expansion pre- crisis, banks, particularly in Europe, had accumulated foreign claims at a pace that outstripped domestic credit growth. Foreign currency funding needs grew in lockstep, especially in US dollars, and were met in part from cross-currency sources - that is, by borrowing in one currency to fund assets in another in the foreign exchange (FX) swap market. Even though these funding profiles may have appeared robust from an individual bank's perspective, the onset of the GFC in 2007 exposed system-wide vulnerabilities. 8 Indeed, many non-US financial institutions found it unexpectedly hard to roll over large amounts of US dollar funding, in both money and FX markets. 9
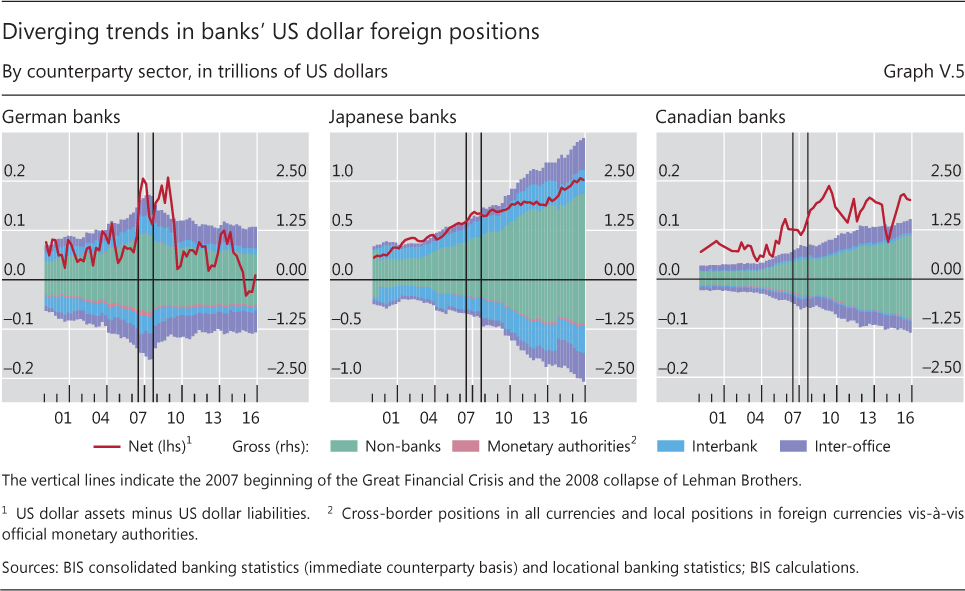
Have such funding needs subsided post-crisis? The data suggest that the location of US dollar funding risks may have changed, but that they appear to remain large. Graph V.5 portrays the relevant information for the consolidated Canadian, German and Japanese banking systems, based on these sectors' US dollar books. German banks - along with those from France and other European countries - entered the GFC with large gross US dollar claims and liabilities (left-hand panel). These, in turn, gave rise to sizeable net US dollar positions (dollar exposures that exceed on-balance sheet dollar liabilities; red lines), mainly financed and hedged by off-balance sheet instruments, such as FX swaps. 10 The resulting "US dollar funding gap" for the combined European banking sector peaked in mid-2007, and has come down significantly since then. By contrast, Japanese banks kept expanding both their gross and net US dollar positions, thereby creating substantial structural funding needs (centre panel). Canadian banks' positions followed a similar trend, though at lower overall levels (right-hand panel).
Graph V.6 provides a richer picture for a broader range of banking systems (left-hand panel). It shows dollar claims and liabilities by bank headquarters location, combined with information on the location of banks' counterparties. A number of points are worth highlighting.
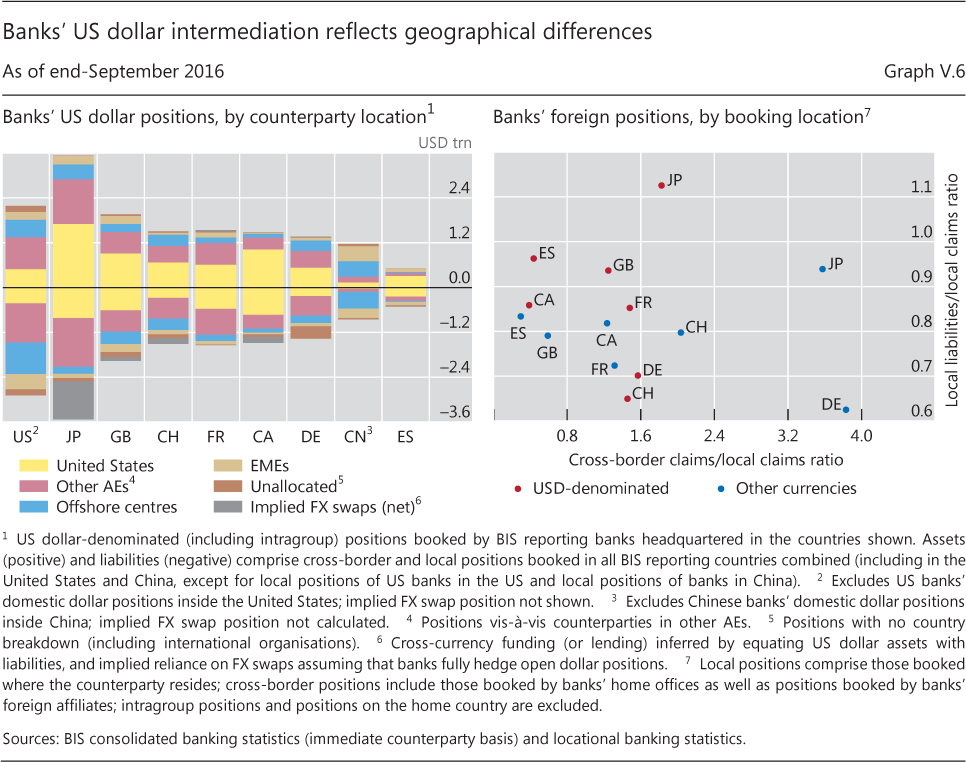
First, US dollar-based financial intermediation is both large and very much international. Indeed, the majority of international US dollar lending occurs vis-à-vis non-US counterparties. 11 Banks headquartered in - and with funding sourced from - countries outside the United States play a key role. Japanese banks stand out, with dollar assets worth more than $3 trillion, supported by on-balance sheet funding of around $2.5 trillion (see also Graph V.5). The difference is most likely accounted for by instruments such as FX swaps (grey bars in Graph V.6). As of end-2016, this took total non-US banks' US dollar funding to around $10.5 trillion (Box V.C). The heavy demand for FX swap dollar borrowing is reflected in the premium banks typically pay in the FX swap market relative to the wholesale cash market (Chapter II). 12
Second, there are signs of significant rollover risks, as sizeable parts of banks' US dollar funding rely on short-term instruments such as repos and FX swaps. Recent market reactions to MMMF reform in the United States provide an admittedly imperfect test of non-US banks' resilience to these risks (Box V.C). They suggest that the global banking system has been able to adjust rather smoothly to the loss of US dollar funding from a key supplier, US "prime" funds. While the cost spread on this funding has increased somewhat, volumes have largely been replaced. However, the reform was gradual and well anticipated, leaving open questions about banks' ability to retain funding under less benign conditions.
A mitigating factor is that a substantial part of banks' short-term funding is known to be collateralised, often with high-quality assets. This should help them obtain funding from alternative sources, including central banks, if current ones were to dry up. Yet although collateral helps mitigate both credit and liquidity risks, haircuts could well increase during a liquidity squeeze - at least for lower-quality collateral. There are also signs that banks' funding mix has been shifting towards offshore US dollar deposits (Box V.C), which lack the direct backstop ultimately provided by the Federal Reserve.
Box V.C
US money market fund reform and non-US banks' global dollar funding
The reform of US money market mutual funds (MMMFs) took effect in October 2016. Along with other rule changes, the reform requires "prime" MMMFs to maintain a floating net asset value, changing the funds' economics from an investor perspective. Since non-US banks rely heavily on unsecured funding from prime MMMFs, it was feared that the reform would lead to a US dollar funding crunch for these banks. Eventually, the reform did result in a substantial loss of dollar funding from MMMFs and some increase in its cost (Chapter II). However, non-US banks were able to mute the effect by raising US dollar deposits and similar funds from other sources.
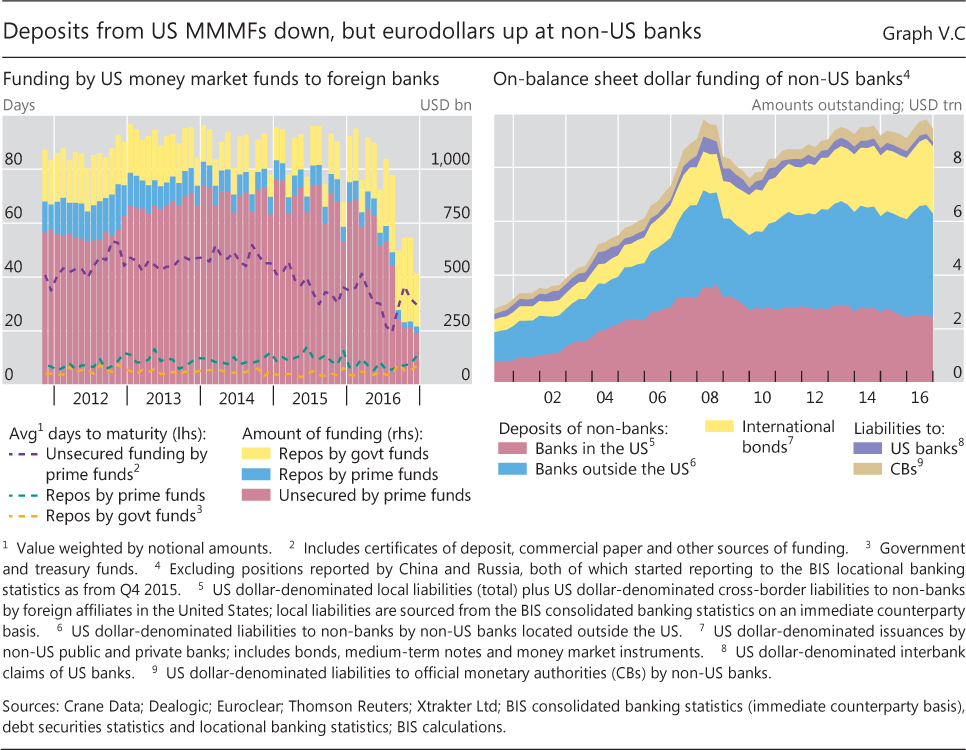
On net, MMMF reform subtracted some $310 billion of US dollar funding from non-US banks in the four quarters to September 2016, by which time most of the adjustment had taken place. A loss of about $480 billion from prime MMMFs was partially compensated by some $170 billion in repo funding from government-only funds (ie those not subject to the new regulations), with the maturity of MMMF funding declining in the process (Graph V.C, left-hand panel). The composition of US dollar funding also changed, as foreign banks' US operations responded by running down their holdings of excess reserves at the Federal Reserve and, to a lesser extent, drawing on funding from headquarters.
Overall, global (on-balance sheet) US dollar funding for non-US banks stood at almost $9.5 trillion at end-2016 (Graph V.C, right-hand panel). Off-balance sheet funding, mainly via FX swaps, raised the total to around $10.5 trillion. Despite the run-off of eurodollar deposits by US MMMFs, offshore deposits at non-US banks rose to about $4.1 trillion by September 2016, reflecting the rising importance of offshore funding in the global banking system. The MMMF reform episode thus appears to confirm global banks' ability to maintain US dollar funding. Yet questions remain about the resilience of funding under more stressed conditions.
See BIS, "Highlights of global financial flows", BIS Quarterly Review, March 2017, pp 15-23.
Third, international dollar intermediation appears to be rather concentrated. Interbank US dollar lending is known to be dominated by about a dozen or so large banks, with banks from eight non-US economies accounting for more than 60% of international dollar assets and liabilities. Much of the associated US dollar funding flows through repo markets, which are themselves fairly concentrated, due to sizeable scale economies in clearing and settlement. US triparty repos, where clearing and settlement depend on services from only two clearing banks, are estimated to account for about half of US repo market volume, at $1.7 trillion. The other half is settled bilaterally. Similarly, inter-dealer repos in US government securities are cleared via a single central counterparty (CCP), which accounted for total net cash borrowings of about $124 billion in May 2017. 13
Finally, banks - and banking systems - are likely to perform differently in terms of shock transmission and absorption. 14 Varying degrees of reliance on offshore centres (blue bars in Graph V.6), for example, reflect differences in the way funds are sourced and redistributed across banks' global operations. The right-hand panel of Graph V.6 provides a fuller picture of banks' organisational structures, highlighting the degree of centralisation of their international activities. On the basis of aggregate asset positions, banks from Germany, Japan and Switzerland are relatively centralised. That is, a lot of their US dollar and other foreign currency assets are booked via their home offices or third countries, as opposed to banks' local branches and subsidiaries (high ratios on the horizontal axis). Liability patterns, however, differ in that much of Japanese banks' US dollar financing is locally sourced (high values on vertical axis), whereas German and Swiss banks rely more on home office and third-country funds. By contrast, Spanish and Canadian banks' balance sheets reflect much more locally managed and funded foreign activities. 15
Policy implications
The patterns highlighted above suggest that global US dollar funding markets are likely to be a key pressure point during any future market stress episode. Non-US entities' US dollar funding needs remain large, posing potentially sizeable rollover risks. They are also concentrated on a rather limited number of major banks. Interconnectedness is another important factor, as dollar funds are sourced from a variety of bank and non-bank counterparties to support both outright US dollar lending and various types of market- based dollar intermediation. In this context, counterparties such as MMMFs, insurance companies and large corporates interact with banks in a range of markets, including those for repos and FX swaps. In addition, many of the same banks provide services to entities such as CCPs, which - under stress - can be a source of large liquidity demands.
What does this imply for policy? A first key issue is banks' organisational structures and the spillover risks that can arise from the links between their head offices and local affiliates. This underlines the importance of supervisory cooperation. Cooperation is essential to share information on banks' global US dollar funding profiles and conduct targeted stress tests (eg of banks' reliance on the FX swap market). Key tools include supervisory colleges, memoranda of understanding (MoUs) and less formal home-host supervisory bilateral cooperation. In addition, in some host jurisdictions regulators now require that foreign banks' local operations be more self-sufficient. Such measures, which sometimes involve full legal subsidiarisation, give rise to important trade-offs. For instance, while mitigating systemic risk concerns, subsidiarisation, and corresponding supervisory constraints on foreign branches, may hinder the movement of funds across affiliates within the same holding company and raise operating costs. This could deter foreign bank participation - a consideration that may be especially relevant for EME regulators. 16
Spillover risks also support work on broader preventive measures in several areas. One is regulatory requirements to limit banks' maturity transformation and rollover risks. Examples include Basel III's Liquidity Coverage Ratio, which can be implemented at the individual currency level. Another involves more general steps to enhance the resilience of banks and other financial institutions, including other requirements under the Basel III package and similar regulations for non-banks, such as US MMMF reform. International minimum standards, such as Basel III, also help to reduce any distortions from unlevel playing fields or regulatory fragmentation. A third area concerns market infrastructure design, including triparty repos and CCPs. US repo market reform, for example, has successfully reduced the use of clearing bank-provided intraday credit in triparty repos - addressing a concern highlighted by the GFC. CCP resilience, in turn, is supported by measures such as the CPMI-IOSCO Principles for financial market infrastructures and work under way to enhance CCP recovery planning and resolution. 17
A second key policy issue concerns access to US dollar funding during market disruptions. Given cross-currency funding mismatches and associated rollover risks, national authorities may need to facilitate access to US dollar funds to meet the foreign exchange needs of domestic banks and corporates.
One way of doing so is through their holdings of foreign exchange reserves. In 2008, some EMEs used their reserves for this purpose. 18 Yet authorities may be reluctant to dip into their reserves: financial markets could see it as a negative signal about the country's condition. There are also signs that reserve management can generate undesirable procyclical effects. During the GFC, for example, many reserve managers reduced their placements with riskier counterparties, especially banks, and cut back on their securities lending programmes. 19
Another way to mobilise foreign currency funding is through central bank swap lines. For the US dollar, only the Federal Reserve is in a technical position to supply dollars elastically. 20 This is why, during the GFC, major central banks opted for a network of ad hoc swap lines among themselves to supply and distribute US dollar liquidity. The arrangement's success underlines the need for central banks to retain the ability to offer such swap lines, some of which have since been made permanent. 21 Owing to several considerations, not least moral hazard and risk management, such arrangements are likely to remain narrow in scope and be designed for use only as backstops. 22
Endnotes
1 See eg J Fell, M Grodzicki, R Martin and E O'Brien, "Addressing market failures in the resolution of non-performing loans in the euro area", ECB Financial Stability Review, November 2016.
2 See Moody's Investors Service, "Rating action: Moody's downgrades Canadian banks", 10 May 2017.
3 See M Chui, I Fender and V Sushko, "Risks related to EME corporate balance sheets: the role of leverage and currency mismatch", BIS Quarterly Review, September 2014, pp 35-47.
4 See BIS, 86th Annual Report, June 2016, Chapter VI; and CGFS, Fixed income market liquidity, CGFS Papers, no 55, January 2016.
5 See eg V Constâncio, "Challenges for the European banking industry", lecture at the University of Navarra conference "European banking industry: what's next?", Madrid, 7 July 2016.
6 See BIS, ibid; and CGFS-FSB, FinTech credit: Market structure, business models and financial stability implications, May 2017.
7 See eg CPMI, Distributed ledger technology in payment, clearing and settlement - an analytical framework, February 2017.
8 See BIS, 78th Annual Report, June 2008, Chapter VI.
9 For a more detailed analysis, see P McGuire and G von Peter, "The US dollar shortage in global banking and the international policy response", International Finance, vol 15, issue 2, June 2012.
10 For an explanation of the calculation methodology, see McGuire and von Peter, ibid.
11 International lending excludes more than $10 trillion worth of purely domestic positions of US banks.
12 See C Borio, R McCauley, P McGuire and V Sushko, "Covered interest rate parity lost: understanding the cross-currency basis", BIS Quarterly Review, September 2016, pp 45- 64.
13 See V Baklanova, O Dalton and S Tompaidis, "Benefits and risks of central clearing in the repo market", Office of Financial Research Brief Series, no 17-04, March 2017.
14 See I Fender and P McGuire, "Bank structure, funding risk and the transmission of shocks across countries: concepts and measurement", BIS Quarterly Review, September 2010, pp 63-79; and N Cetorelli and L Goldberg, "Liquidity management of US global banks: internal capital markets in the great recession", Journal of International Economics, vol 88, issue 2, November 2012, pp 299-311.
15 During the GFC, local claims booked by banks' foreign affiliates, particularly if funded by local liabilities in local currencies, tended to be more stable than cross-border and inter-office claims. See eg R McCauley, P McGuire and G von Peter, "After the global financial crisis: from international to multinational banking?", Journal of Economics and Business, vol 64, issue 1, January-February 2012, pp 7-23.
16 For a discussion, see CGFS, EME banking systems and regional financial integration, CGFS Papers, no 51, March 2014.
17 See BCBS-CPMI-FSB-IOSCO, Progress report on the CCP workplan, August 2016.
18 See CGFS, Global liquidity - concept, measurement and policy implications, CGFS Papers, no 45, November 2011.
19 See R McCauley and J-F Rigaudy, "Managing foreign exchange reserves in the crisis and after", BIS Papers, no 58, October 2011.
20 For details, see D Domanski, I Fender and P McGuire, "Assessing global liquidity", BIS Quarterly Review, December 2011, pp 57-71.
21 See ECB, "Experience with foreign currency liquidity-providing central bank swaps", Monthly Bulletin, August 2014; and CGFS, Designing frameworks for central bank liquidity assistance: addressing new challenges, CGFS Papers, no 58, April 2017.
22 In addition to self-insurance via foreign exchange reserves, a possible alternative to swap lines is cross-border collateral arrangements (CBCAs). Such arrangements can be an effective shock mitigant in cases of dysfunction in individual local funding markets. CBCAs allow central bank liquidity to be made available to foreign affiliates against a broader range of assets than would otherwise be the case, aiding central bank responses in times of stress. See CGFS (2014), op cit.