Highlights of global financial flows
The BIS, in cooperation with central banks and monetary authorities worldwide, compiles and disseminates data on activity in international financial markets. It uses these data to compile indicators of global liquidity conditions and early warning indicators of financial crisis risks. This chapter analyses recent trends in these indicators. It also summarises the latest data for international banking markets, available up to March 2016, and for international debt securities, available up to June 2016.1
Takeaways
- International bank claims (cross-border bank claims plus local claims in foreign currencies) rose in the first quarter of 2016, for the first time since end-March 2015. On a year-on-year basis, international bank claims declined by 4.5%, undercut by an 8% year-on-year contraction in interbank claims.
- The stock of international debt securities continued to grow, with positive net issuance in the first and second quarters of 2016. By the end of Q2 2016, international debt securities were 2.1% above their level of a year earlier.
- The year-on-year growth rates of both US dollar cross-border loans to borrowers outside the United States and euro cross-border loans to borrowers outside the euro area turned negative in the first quarter of 2016. It was the first contraction since 2009 for dollar-denominated loans and the first since 2014 for euro-denominated loans.
- US dollar-denominated international credit (bank loans plus debt securities) to non-bank borrowers in emerging market economies (EMEs) saw another contraction (-$33 billion) in the first quarter of 2016, the third quarterly decline in a row. The outstanding stock fell to $3.2 trillion at end-March 2016.
- Cross-border bank claims on residents of China fell by $63 billion in the first quarter. The decline was smaller than those seen during previous quarters, but it still brought the annual growth rate down to -27%.
- Borrowing through international debt securities markets was more robust than borrowing through banks, with a revival of net issuance by financial sector borrowers in advanced economies in the first quarter of 2016, and strong quarterly net issuance from EME borrowers in the second.
- The medium-term trend towards greater use of the euro as a funding currency for non-financial debt securities issuers continued, despite the rebound in US dollar-denominated issuance in the second quarter of 2016.
- The recent UK referendum on membership of the European Union has drawn attention to how integrated banks in the United Kingdom are with the global banking system in general, and the rest of Europe in particular. Cross-border activity by banks located in the United Kingdom is notably greater than that by banks headquartered in the United Kingdom. The euro's share in cross-border claims of banks located in the United Kingdom amounted to 33% at end-March 2016 (see Box A, "The United Kingdom as a hub for international banking").
- The results of the recent BIS Triennial Survey of Foreign Exchange and Derivatives Markets show that over-the-counter (OTC) derivatives trading activity has continued to grow strongly in recent years, while the volume of exchange-traded derivatives has shown no clear trend (see Box B, "Exchanges struggle to attract derivatives trading from OTC markets").
Box A
The United Kingdom as a hub for international banking
Cathérine Koch
The recent British vote to leave the European Union has focused attention on the role of the United Kingdom in the European and international banking systems.
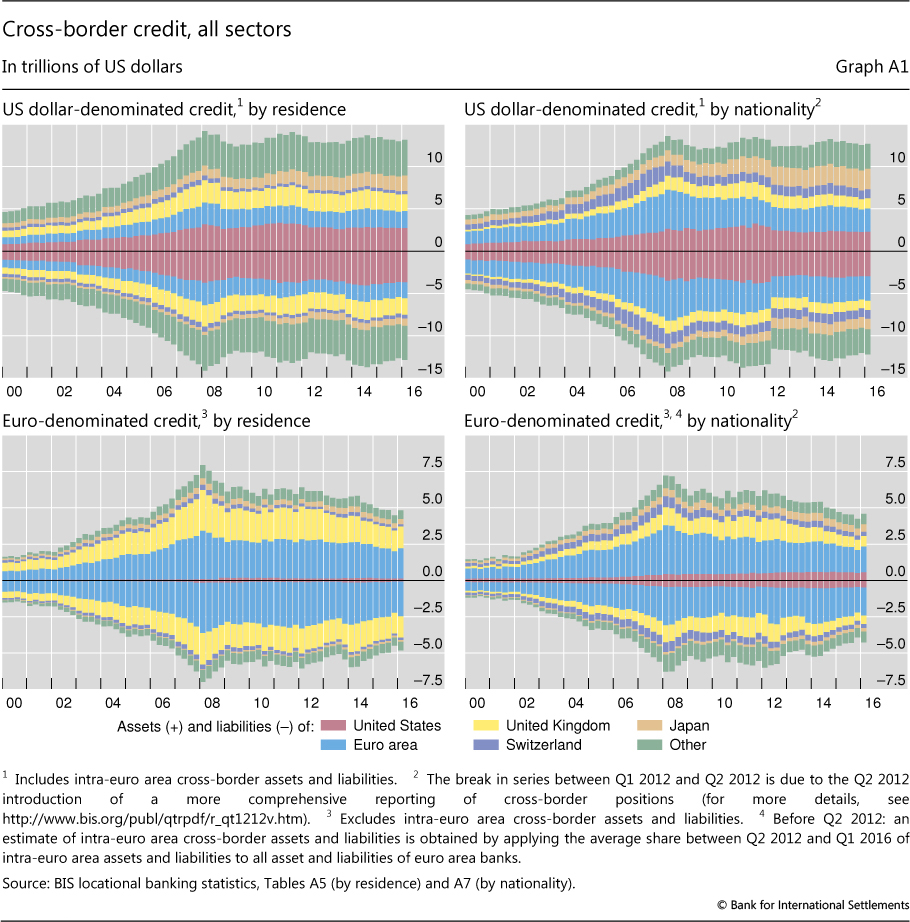
On a locational basis, the United Kingdom stands out as a prominent international banking hub. However, a large share of this activity is accounted for by banks from other countries with affiliates located in the United Kingdom. A comparison of the residence and nationality breakdowns of banks' total (worldwide) cross-border positions illustrates the distinction between the location of international bank activity and the nationality of the banks that perform it (Graph A1). In both dollar and euro business, the amount of cross-border activity by banks located in the United Kingdom (the yellow areas in Graph A1, left-hand panels) is notably bigger than the cross-border business of banks headquartered in the United Kingdom (the yellow areas in Graph A1, right-hand panels). For other countries, eg Switzerland (the purple areas), the reverse is true.
As of end-Q1 2016, banks located in the United Kingdom reported total cross-border lending worth $4.5 trillion. They ranked first among all banks located in BIS reporting countries, followed by banks in Japan ($3.4 trillion) and the United States ($3.1 trillion). At the same time, with a total of $3.8 trillion, the United Kingdom was the second largest recipient of cross-border bank credit, surpassed only by the United States ($4.8 trillion). Interbank claims made up almost two thirds of all cross-border claims on the United Kingdom, with claims on related banks accounting for about one third of the interbank positions.
A substantial share of foreign banks' business with the United Kingdom is booked through local offices in the United Kingdom, rather than cross-border (Graph A2, left-hand panel). On a consolidated ultimate risk basis, foreign claims on UK residents amounted to $2.4 trillion as of end-March 2016, of which almost two thirds were booked locally. Among those internationally active foreign banks with local operations, US banks reported the largest outstanding foreign claims on the United Kingdom ($460 billion), followed by German ($404 billion) and Spanish banks ($396 billion). Claims of banks from BIS reporting EU member countries totalled $1.3 trillion. This amounted to 56% of all foreign claims on UK residents.
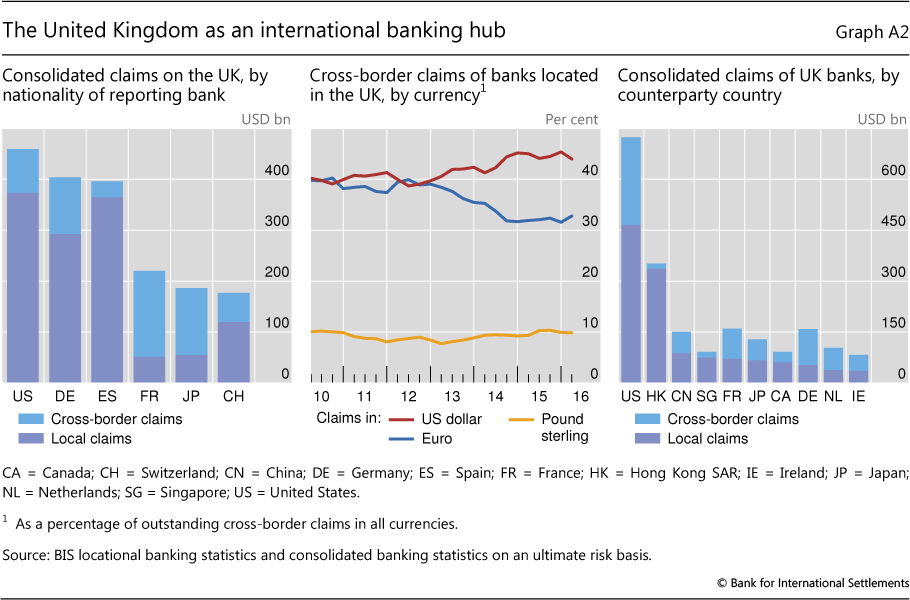
At the same time, UK banks are also closely involved in the European banking system (Graph A2, right-hand panel). As of end-Q1 2016, UK banks' consolidated foreign claims on other EU countries reached $666 billion, or 21% of their global total, while those on euro area countries totalled $634 billion, or 20%. Nevertheless, their consolidated foreign claims on the United States ($724 billion) and Hong Kong SAR ($351 billion) were larger than those on any single EU member country.
The United Kingdom has a particularly important role as a redistribution hub for euro-denominated funds. Banks and other financial intermediaries located there (many of which are headquartered outside the United Kingdom) borrow euros from abroad and then invest them in euro-denominated cross-border claims. Banks located in the United Kingdom are the largest borrowers and lenders of euros outside the euro area. As of end-March 2016, about 54% of all worldwide unconsolidated euro-denominated cross-border claims booked outside the euro area and 60% of all liabilities were accounted for by banks resident in the United Kingdom. In recent years, this share has tended to decline, owing in part to a pickup in euro-denominated activity elsewhere in the world and also to exchange rate movements.
Indeed, ever since the launch of the single currency, euro-denominated positions have been a major part of the cross-border portfolios of banks located in the United Kingdom. For most of the 2000s, the share of the euro in the cross-border claims of banks in the United Kingdom hovered around 40% and was roughly equal to the share of claims denominated in US dollars (Graph A2, centre panel). Since 2012, while partly reflecting exchange rate movements, these shares have diverged. The euro's share declined from 39% at end-September 2012 to 33% at end-March 2016. Over the same period, the share of the US dollar in the cross-border claims of banks in the United Kingdom increased from 39% to 44%.
For more information, see BIS locational banking statistics, Tables A5 and A7, www.bis.org/statistics/bankstats.htm; and H S Shin, "Global liquidity and procyclicality", speech at the World Bank conference on The state of economics, the state of the world, Washington DC, 8 June 2016. Foreign claims comprise cross-border claims plus local claims in all currencies, where local claims refer to credit extended by banks' affiliates located in the same country as the borrower. Not all EU members report to the BIS banking statistics. The figures above include Austria, Belgium, Germany, Finland, France, Greece, Ireland, Italy, the Netherlands, Portugal, Spain and Sweden.
Box B
Exchanges struggle to attract derivatives trading from OTC markets
Robert McCauley and Philip Wooldridge
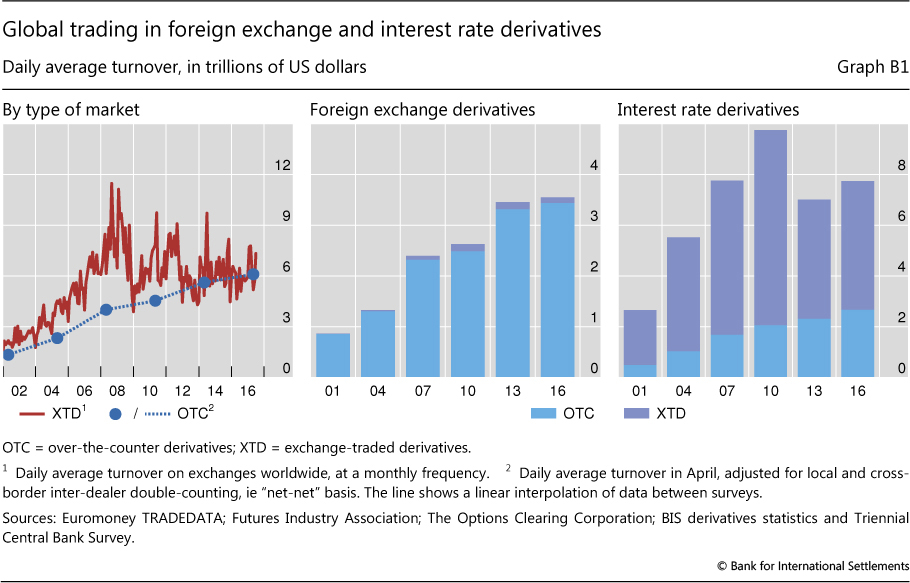
Exchanges have not won a bigger share of derivatives trading, according to the latest BIS Central Bank Triennial Survey of foreign exchange and over-the-counter (OTC) derivatives market activity. Since 2009, the trading of derivatives on exchanges has shown no trend, whereas their OTC trading has trended upwards (Graph B1, left-hand panel). The daily average turnover of foreign exchange and interest rate derivatives traded worldwide - on exchanges and OTC - rose from $10.5 trillion in April 2013 to $11.3 trillion in April 2016. The exchange-traded share remained roughly 46%.
The Triennial Survey is the most comprehensive source of information on the size and structure of OTC markets. Close to 1,300 financial institutions located in 52 countries participated in the latest survey, which was conducted in April 2016. When the results are combined with the BIS statistics on exchange-traded derivatives, they provide a global (albeit infrequent) snapshot of activity in derivatives markets.
Since the Great Financial Crisis of 2007-09, policymakers have sought to reduce systemic risks in OTC derivatives markets by promoting the trading of standardised contracts on exchanges or organised trading platforms and their clearing through central counterparties. While this might have been expected to lead to more trading on exchanges, the latest data suggest that innovations in OTC markets appear to have made OTC instruments more attractive. For example, exchange-like mechanisms have been introduced to trade OTC instruments, most notably swap execution facilities in the United States. Also, a growing share of OTC contracts is centrally cleared; the part of the Triennial Survey on outstanding amounts, to be published in November 2016, will provide comprehensive data on central clearing for the first time. Finally, dealers are compressing more and more OTC instruments - that is, market participants are working together to eliminate economically redundant contracts and thereby to reduce gross exposures.
Foreign exchange derivatives continue to be traded overwhelmingly in OTC markets. The daily average turnover of foreign exchange derivatives in OTC markets exceeded $3.4 trillion in April 2016, compared with only $0.1 trillion traded on exchanges (Graph B1, centre panel). OTC markets dominate owing in large part to foreign exchange swaps. These are popular as funding instruments because they do not change foreign exchange exposures and so can be used to roll over hedges. Moreover, OTC deals better serve customised demands in OTC markets, such as matching cash flows on odd dates or trading currency pairs not involving the US dollar. In only three currencies do exchanges account for a substantial share of FX derivatives activity: the Brazilian real, Indian rupee and Russian rouble, where exchanges accounted for 38%, 15% and 11% of turnover in April 2016, respectively.
Interest rate derivatives are traded mainly on exchanges, but the share traded in OTC markets is increasing. The daily average turnover of interest rate derivatives in OTC markets was $2.7 trillion in April 2016, compared with $5.1 trillion traded on exchanges (Graph B1, right-hand panel). The proportion traded on exchanges declined from around 80% in the 2000s to 67% in April 2013 and to 66% in April 2016. This shift towards OTC markets is explained partly by weak activity in derivatives on short-term interest rates, which dominate trading on exchanges (Graph B2). The sustained period of low and stable policy rates in major economies has reduced hedging and positioning activity in short-term rates, especially in euro and yen rates. That said, while a maturity breakdown of OTC interest rate derivatives is not collected, various data sources suggest that activity across the term structure is shifting gradually to OTC markets. Even at the long end, market participants appear to be switching from contracts based on government bond yields to ones based on private yields, namely interest rate swap rates.
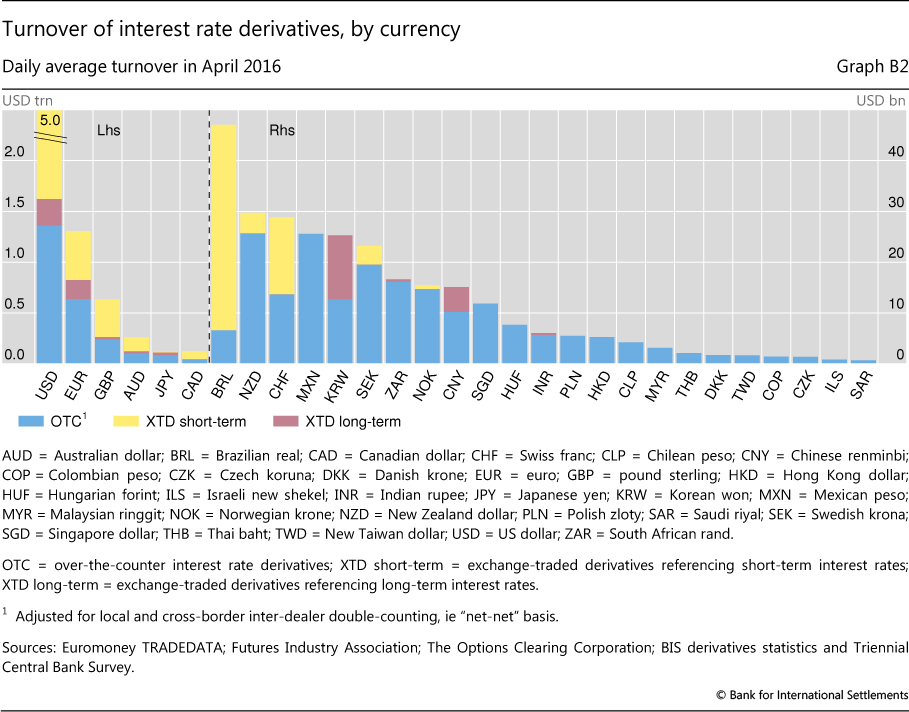
In emerging market economies, where activity is less likely to be dampened by persistently low policy rates, OTC markets are driving activity upwards in interest rate derivatives (Graph B2). The turnover of interest rate contracts denominated in EME currencies rose from $177 billion in April 2013 to $196 billion in April 2016 when measured at constant exchange rates, although the US dollar value of turnover fell owing to the depreciation of many EME currencies against the US dollar. Over the same period, the share of activity on exchanges fell from 58% to 30%. The only EME currencies where exchanges accounted for a sizeable share of activity in interest rate derivatives were the Brazilian real (86%), Korean won (50%) and Chinese renminbi (32%).
Turnover refers to notional amounts valued in US dollars. The appreciation of the US dollar against many currencies between 2013 and 2016 reduced the US dollar value of derivatives denominated in other currencies. When valued at April 2016 exchange rates, the turnover of foreign exchange and interest rate derivatives in April 2013 was $9.6 trillion. For data and more information about the Triennial Survey, see www.bis.org/publ/rpfx16.htm. Financial Stability Board, OTC derivatives market reforms: tenth progress report on implementation, November 2015, www.fsb.org/2015/11/otc-derivatives-market-reforms-tenth-progress-report-on-implementation/. It has also shifted such trading further into the future. See L Kreicher and R McCauley, "Asset managers, eurodollars and unconventional monetary policy", BIS Working Papers, no 578, August 2016. See L Kreicher, R McCauley and P Wooldridge, "Benchmark tipping in the global bond market", BIS Working Papers, no 466, October 2014, www.bis.org/publ/work466.htm.
Global credit remained weak in early 2016
Despite a turbulent start to the year in global financial markets (see "Uneasy calm gives way to turbulence", BIS Quarterly Review, March 2016, pp 1-14), international bank claims increased in the first quarter of 2016. But this increase only partially offset the large declines in the three previous quarters. As a result, international bank claims2 decreased 4.5% on a year-on-year basis,3 to $31.6 trillion, extending a slowdown that had started in mid-2015 (Graph 1, top panel). The year-long decline was driven by an 8% contraction in interbank credit.
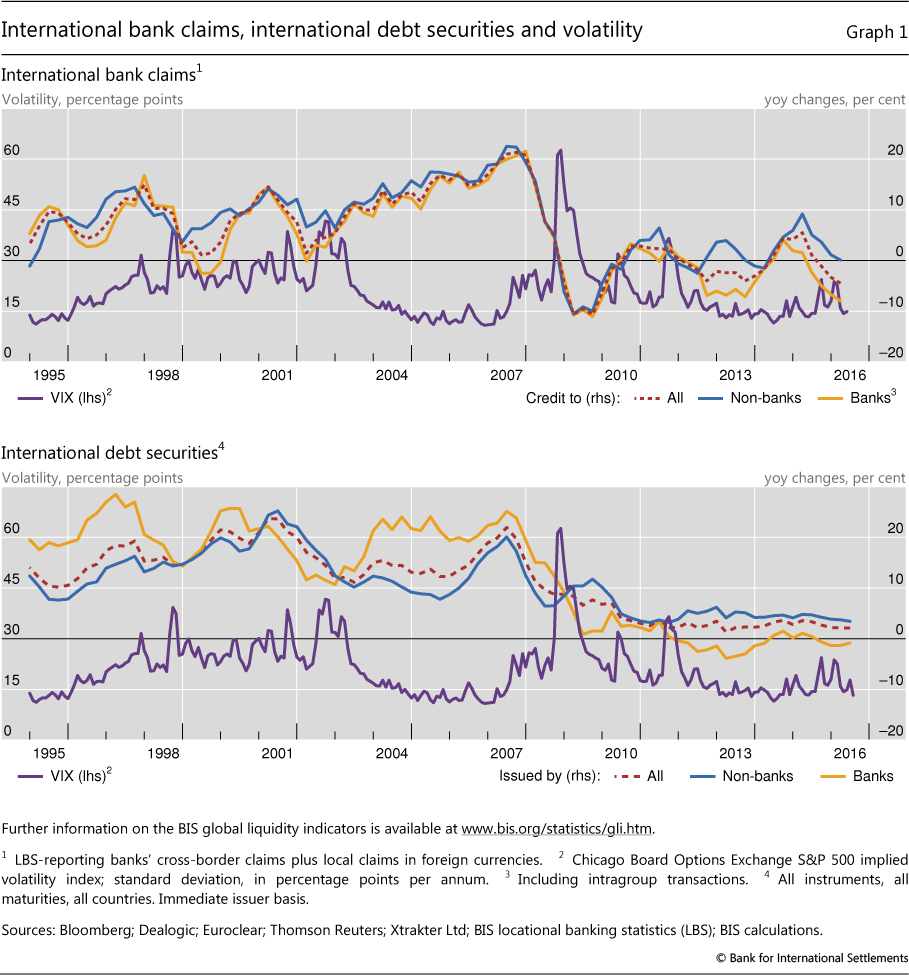
Issuance of international debt securities4 was more stable, with quarterly net issuance of $203 billion, and 2.2% year-on-year growth in the outstanding stock in the first quarter of 2016 (Graph 1, bottom panel). As confidence returned to financial markets in the second quarter (for which data are available only for international debt securities, ie not for international bank credit), net issuance rose further, to $246 billion. Nevertheless, year-on-year growth in the stock of international debt securities up to the second quarter remained essentially constant at 2.1%.
While net issuance by emerging market economies was relatively weak in the first quarter of 2016, it rose to a record high $128 billion in the second, pointing to a broader recovery of capital flows to EMEs.
Even though debt securities issuance by banks was positive in the first and second quarters, the stock contracted by 0.9% in the year to Q2 2016. For non-bank borrowers, the stock of international debt securities expanded by 3.4% over the same period - a slight slowdown in the rate of growth from previous quarters. One driving factor was the growth in credit to the public sector, in part driven by the greater financing needs of selected EME governments.
The year-on-year slowdown in international bank claims in early 2016 was reflected in an ongoing decline in foreign currency cross-border bank loans (mainly dollar- and euro-denominated loans) to the non-financial sector (Graph 2). Annual growth of US dollar-denominated bank loans to non-residents (ie dollar-denominated bank loans to borrowers outside the United States) turned negative in the first quarter, for the first time in several years. US dollar-denominated bank loans to non-residents in the non-financial sector fell 0.7% in the first quarter of 2016, the first decline since the Great Financial Crisis of 2007-09 (Graph 2, top panels). As credit through debt securities markets grew by 4% year on year, however, total US dollar credit (bank loans plus debt securities) to non-financial borrowers outside the United States edged up by 0.8% year on year, to $7.9 trillion at end-March 2016. Credit to non-bank borrowers (adding non-bank financial borrowers) grew 1.6% year on year, to $9.8 trillion at end-Q1 2016.
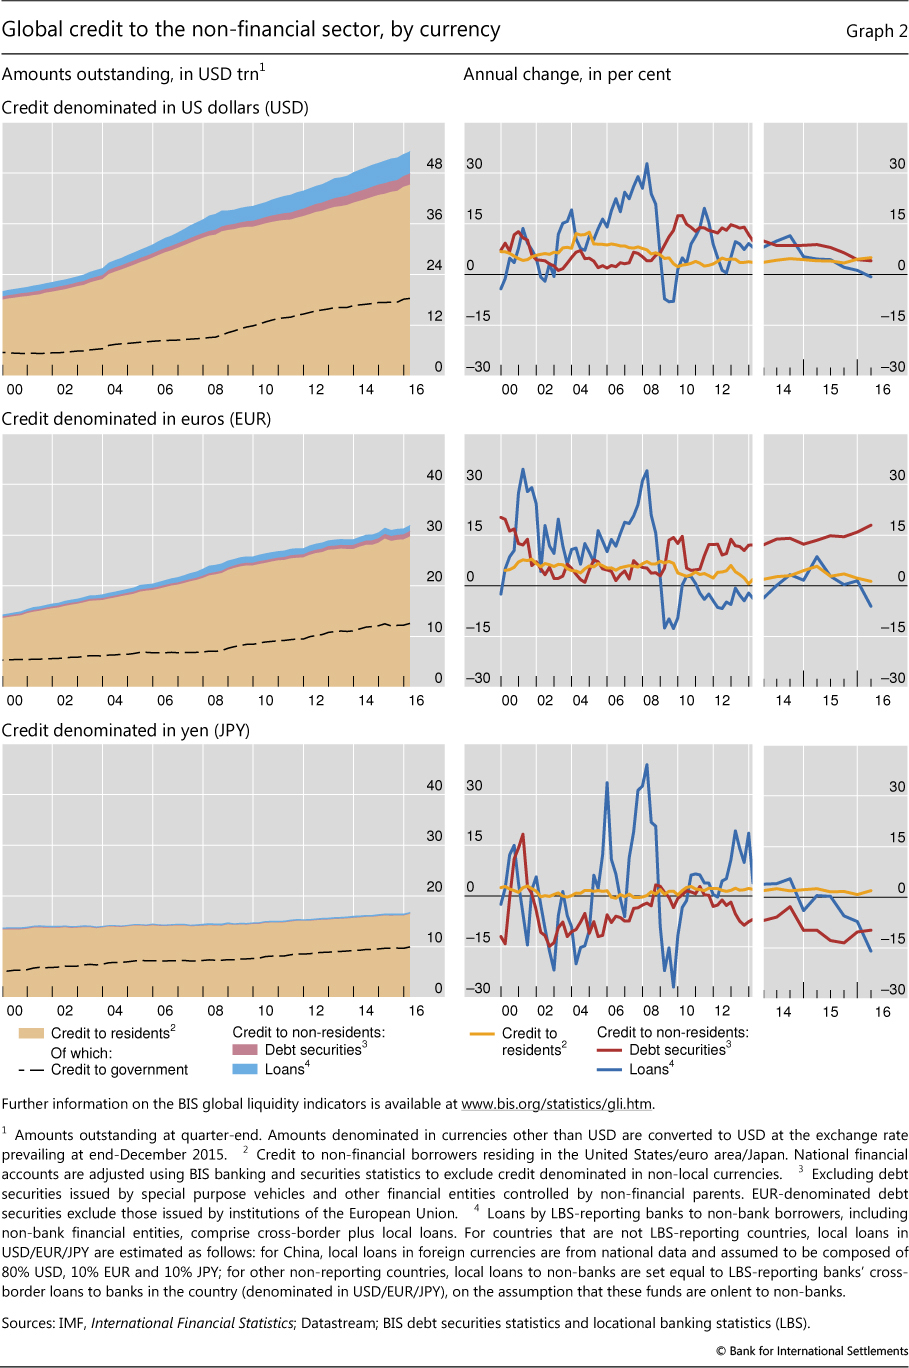
Euro-denominated bank loans to non-euro area residents also fell in year-on-year terms, reversing a recovery in 2014-15. In part, this reflected weakness in the European banking sector, with some banks pulling back their international lending (although, as discussed further below, banks from a number of European countries increased their lending in the first quarter). However, euro-denominated debt securities issuance continued to grow strongly as borrowers took advantage of very low yields and compressed risk premia (Graph 2, middle panels). As a result, the total stock of euro-denominated credit to non-euro area residents was $2.3 trillion ($2.7 trillion including borrowing by non-bank financial entities) at the end of the first quarter. This represented a 4.2% increase on a year earlier (a 4.4% increase including non-bank financial entities). Yen-denominated non-financial credit to non-residents, which was relatively small at $340 billion, continued its recent decline (Graph 2, bottom panels).
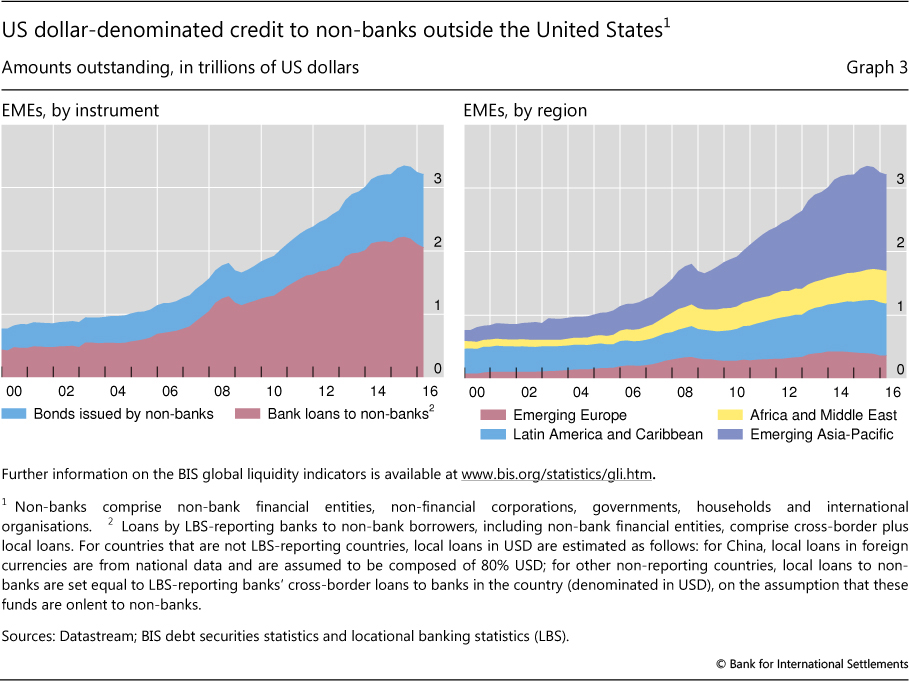
US dollar credit (bank loans and debt securities) to non-bank borrowers in EMEs also saw its first substantial year-on-year decline (Graph 3, left-hand panel) up to the first quarter of 2016 (-2.9%), as credit contracted in each of the previous three quarters. From a peak of $3.3 trillion at end-June 2015, the stock of US dollar credit to EMEs declined by $137 billion to $3.2 trillion at end-March 2016. This reflected a strengthening US dollar, slowdowns in several large EMEs and increased uncertainty in international financial markets. A reduction in US dollar borrowing by the emerging Asia-Pacific region (Graph 3, right-hand panel) was the main contributor (accounting for 86% of the total decline since end-June 2015). As net debt securities issuance by EMEs picked up in the second quarter of 2016, and recent signs of an increase in capital flows to EMEs are becoming more evident, the trend decline in the foreign currency liabilities of EME borrowers may have reversed in recent months.
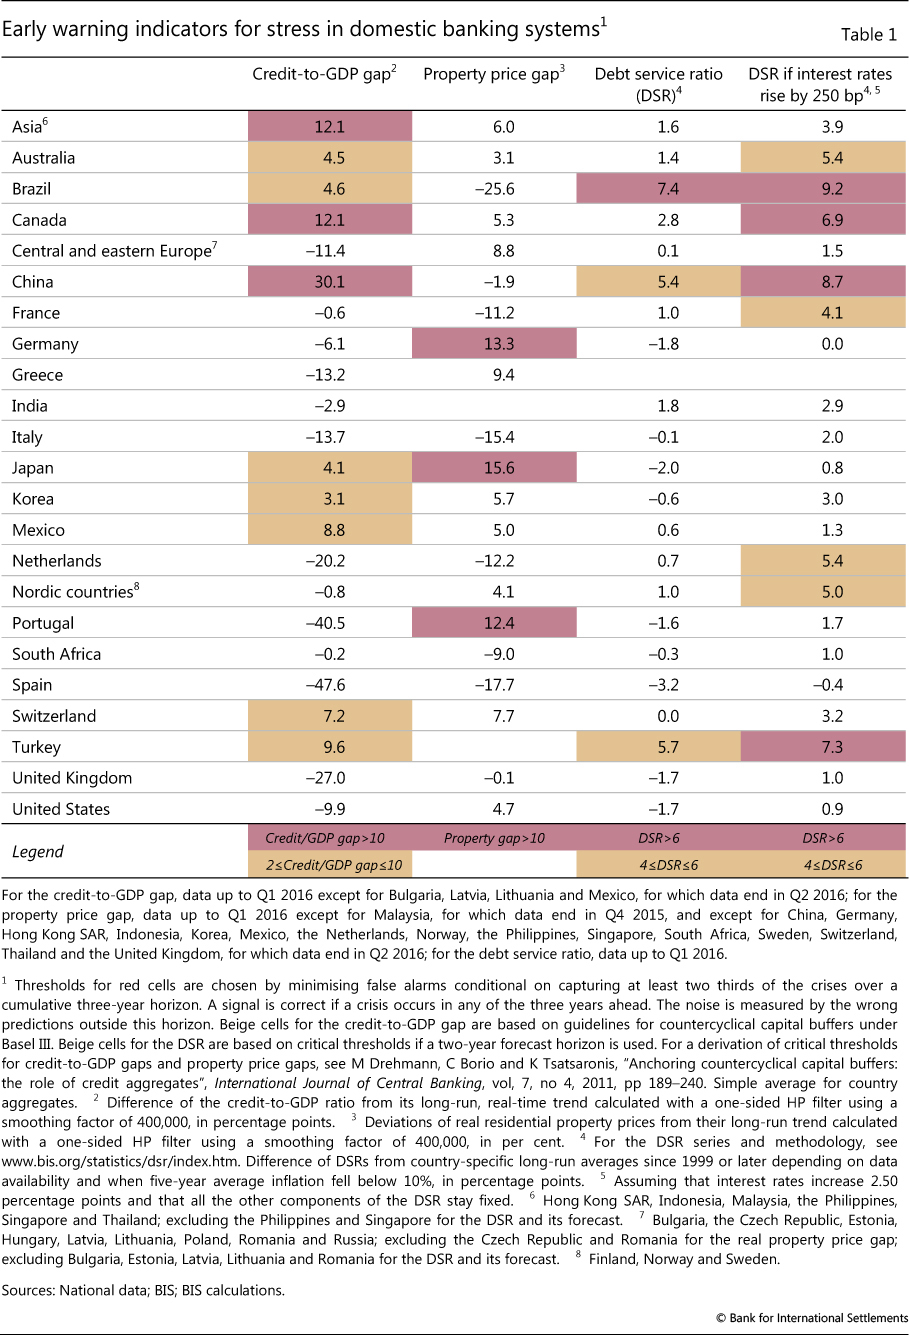
Despite the slowdown in cross-border credit in late 2015 and early 2016, a number of countries still showed signs of strongly above-average domestic credit growth, which could sow the seeds for potential financial strains (see Table 1, where nearly all of the figures are for either Q1 or Q2 2016). According to the BIS early warning indicators, which are intended to capture financial overheating and potential financial distress over medium-term horizons, credit growth continues to be unusually high relative to GDP in several Asian economies as well as in Canada (first column). However, for most countries this gap has narrowed somewhat relative to previous readings. Property price growth has been closer to historical trends, although it is still unusually high in Germany, Japan and Portugal (second column). Estimated debt service ratios, which attempt to capture principal and interest payments relative to income, appear to be at manageable levels at current interest rates for most countries, although they point to potential concerns in Brazil, Canada, China and Turkey (third and fourth columns).5
International bank lending in Q1 2016
The latest BIS locational banking statistics show that cross-border bank claims (a subcomponent of international bank claims) rose by $451 billion during the early months of 2016. This took the outstanding stock to $27.5 trillion. Despite the latest quarterly increase, the annual growth rate remained negative, at -4.6%, with cross-border claims having fallen by a cumulative $1.3 trillion in the year to end-March 2016.
A $234 billion rise in the debt securities holdings of BIS reporting banks accounted for more than half of the overall increase, while loans contributed $137 billion. The remainder reflected an $80 billion rise in "Other instruments", which mainly consist of reporting banks' holdings of equity securities and derivative instruments with positive market value.
Further shift towards the official sector in advanced economies
The quarterly increase in cross-border bank lending was entirely accounted for by a rise in claims on advanced economies (+$462 billion). Nevertheless, its year-on-year growth rate remained negative, at -4.2%.
Most of the increase in claims on advanced economies was due to a $358 billion expansion in cross-border lending to non-banks, which comprise governments, non-bank financial institutions and non-financial corporations. In terms of banks' consolidated6 claims, international bank lending to the official sector - claims on governments as well as deposits with central banks - in advanced economies has surged as a proportion of banks' total international assets, from 13% at end-March 2008 to 24% at end-March 2016, the highest level in more than 25 years.
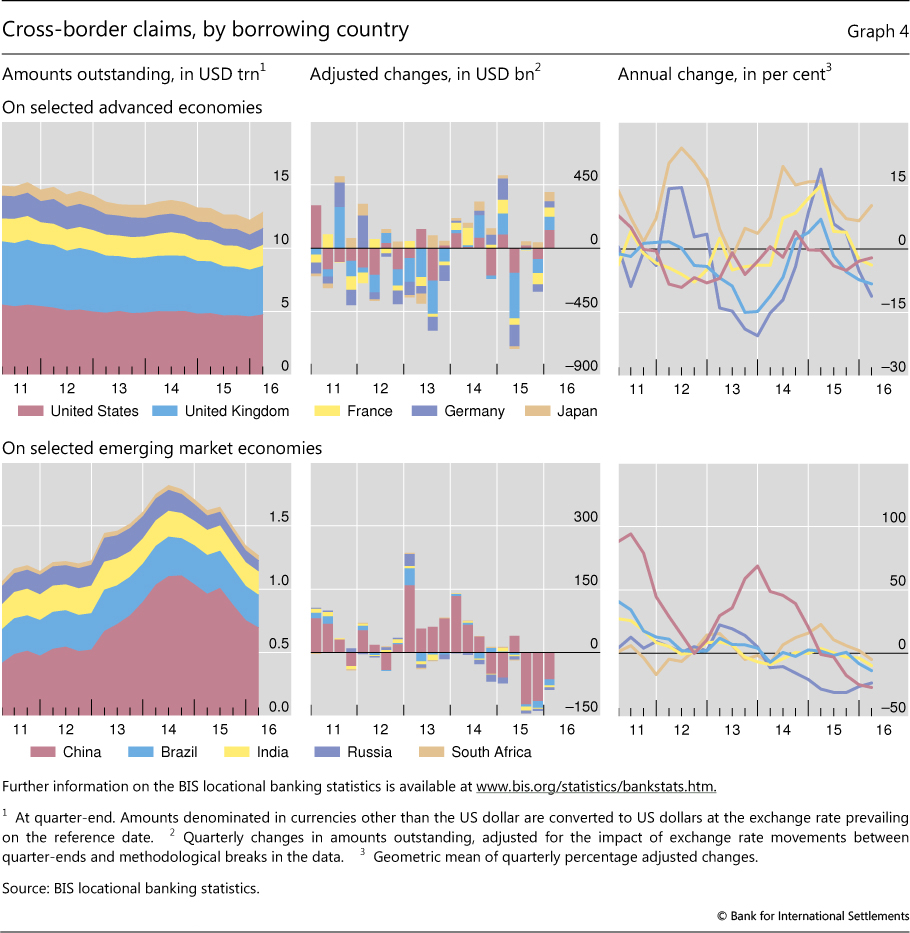
Total cross-border claims on the United States rose by $130 billion between end-2015 and end-March 2016 (Graph 4, top panels). Claims on non-bank borrowers were especially strong. The BIS consolidated banking statistics indicate that, in the first quarter of 2016, the rise in international claims on US non-banks was split between borrowers in the official and non-bank private sectors, while international claims on banks contracted.
The rise in foreign banks' claims on the US official sector - which are composed of banks' holdings of US Treasury securities as well as their claims on the US Federal Reserve System7 - continued a trend evident since the Great Financial Crisis of 2007-09. Claims on the official sector as a share of consolidated international claims on all US borrowers climbed by more than 20 percentage points between end-March 2008 and end-March 2016, from 9% to 33%. Over the same period, the outstanding total of international claims on the US official sector more than doubled, rising from $255 billion to $763 billion. By contrast, the shares of international claims on the US non-bank private sector and the US banking sector fell by 17 percentage points (from 69% to 52%) and 7 percentage points (from 22% to 15%), respectively.
In parallel with the growth in bank claims on the US official sector, the share of international claims on the official sector in the euro area has tended to increase recently. At end-March 2016, the official sector accounted for 27% of banks' consolidated international claims on euro area borrowers, up from 17% at end-March 2008. International claims on Japan were also skewed towards the official sector: the share of the official sector relative to all international lending rose by 4 percentage points (from 26% to 30%) between end-Q1 2008 and end-Q1 2016.
Further contraction in cross-border bank lending to EMEs
Cross-border bank credit to emerging market economies declined by $76 billion during the first quarter of 2016. This latest fall pushed the total outstanding down to $3.2 trillion, while further accelerating the annual pace of decline to -9%.
As in the preceding two quarters, diminishing claims on China drove the aggregate quarterly change in lending to EMEs (and to emerging Asia in particular). The $63 billion drop in cross-border bank credit to residents of China was smaller than those seen during previous quarters, but it still took the annual growth rate down to -27% (Graph 4, bottom panels). The outstanding total came to $698 billion as of end-March 2016. Since hitting its all-time high at end-September 2014, cross-border bank credit to China had contracted by a cumulative $367 billion (-33%) by end-March 2016, with interbank and inter-office activity leading the decline.
Between end-December 2015 and end-March 2016, claims on the rest of emerging Asia fell slightly (by $2 billion), while the year-on-year change was -6%. The latest decline resulted from a $16 billion fall in interbank activity and an $11 billion expansion of cross-border claims on the non-bank sector.
Cross-border bank credit to Latin America and the Caribbean contracted (by $9 billion) during the first three months of 2016, for an annual growth rate of -3%. This third consecutive quarterly decline was driven by a sharp fall in lending to Brazil (-$14 billion), whose cross-border borrowing contracted by 14% in the year to end-March 2016.
Claims on emerging Europe stagnated during the first quarter of 2016 on the back of divergent trends within the region. The annual growth rate came to -6%, similar to the average pace of decline seen over the past two years. Since end-March 2013, cross-border lending to Russia has fallen by a cumulative $96 billion.
The euro gained ground in international debt securities
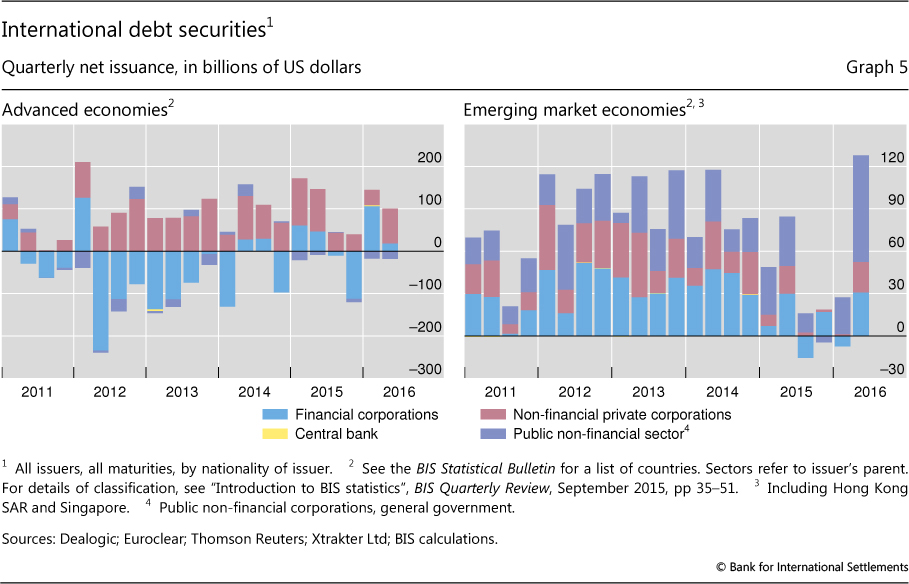
While net issuance of international debt securities was relatively weak in the second half of 2015, the first half of 2016 saw a revival in both advanced and emerging market economies, in particular in the second quarter. International issuance from advanced economy borrowers, especially financial sector borrowers, recovered in the first quarter of 2016. Strong net issuance continued, this time with substantive net issuance from the non-financial private sector, in the second quarter (Graph 5, left-hand panel). In EMEs, quarterly net issuance was weak in the first quarter of 2016 but hit $128 billion in the second, boosted by $76 billion in net issuance from the public non-financial sector (Graph 5, right-hand panel).
Despite the rebound in US dollar-denominated issuance in the second quarter of 2016, the medium-term trend towards greater use of the euro as a funding currency for non-financial issuers continued.8 For US non-financial issuers, euro-denominated debt accounted for the majority of net issuance outside the home market during the year from end-June 2015 to end-June 2016 (Graph 6, top left-hand panel).
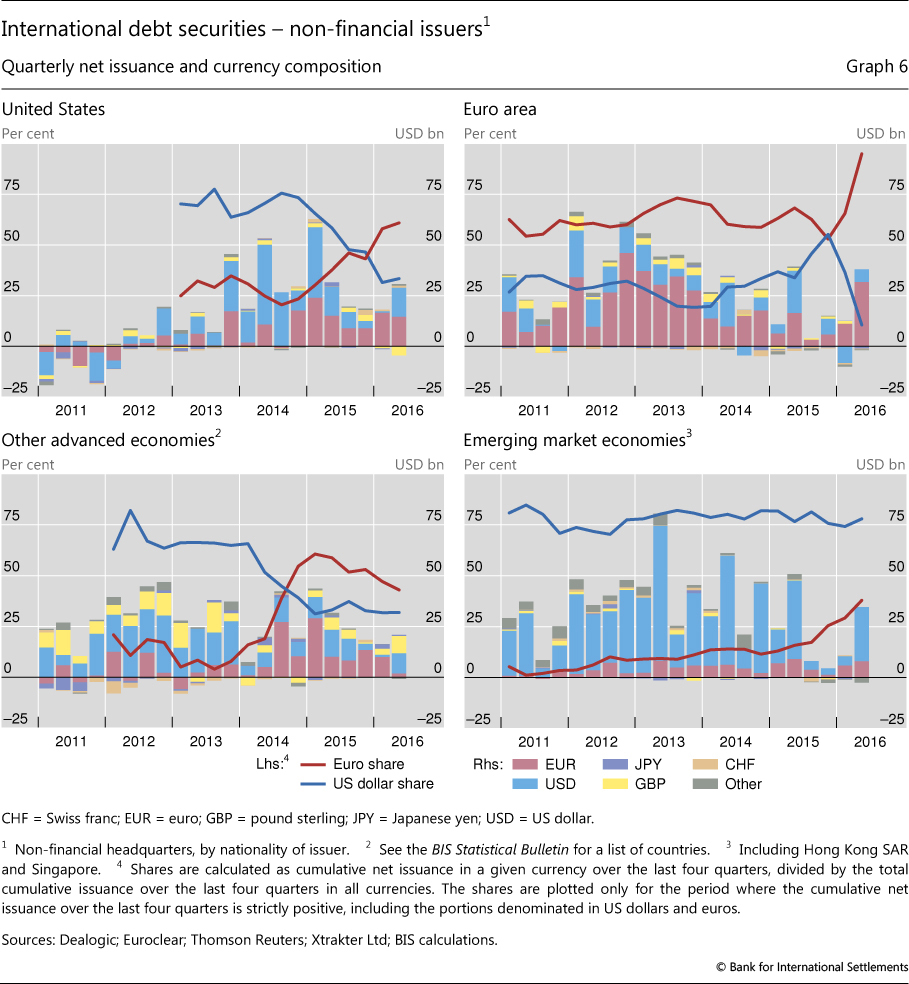
The shift to euro-denominated financing partly reflected the divergence in monetary policy between the Federal Reserve and the ECB, which has contributed to a widening gap between US dollar and euro yields. Thanks to comparatively lower corporate credit spreads for euro-denominated debt, the cost of issuance in euros has fallen well below the cost of issuance in US dollars for many issuers. As a result, US corporates can obtain cheaper US dollar funding by issuing debt in euros and then swapping it back into US dollars, putting pressure on the cross-currency basis.9 The lower spreads in turn reflect the ECB's decision in March 2016 to purchase investment grade non-financial corporate bonds from euro area issuers. Accordingly, issuers from the euro area have also increased the share of the euro in their net international issuance (Graph 6, top right-hand panel).
International issuers from emerging market economies, who traditionally have relied mostly on the US dollar as a funding currency, have also been increasing their net issuance in euros (Graph 6, bottom right-hand panel). While the share of the US dollar in annual net issuance of EME non-financial borrowers has remained high (at around 75%), that of the euro has increased by more than 25 percentage points since end-2014, to around 38%10 in the second quarter of 2016.
More broadly, the return of investors' risk appetite in the second quarter of 2016 is likely to have contributed to the revival of issuance by EME borrowers. At the same time, the revival was also driven by country-specific factors and may in part have reflected one-off events.
In Latin America, the government of Argentina returned to the international markets, with total net issuance of $19.6 billion in Q2 2016 (Graph 7, top left-hand panel) - almost entirely in US dollars.
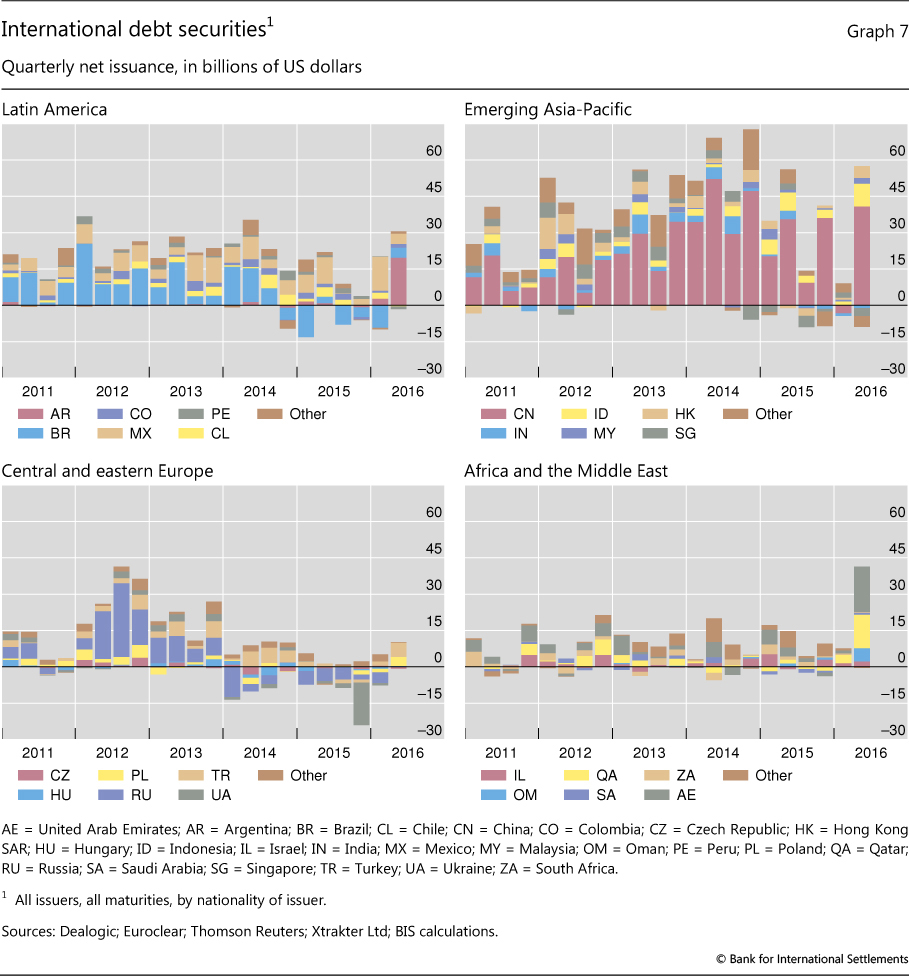
In the emerging Asia-Pacific region, China dominated net issuance of international bonds, with $40.7 billion in the second quarter of 2016 (Graph 7, top right-hand panel). Of this total, $9.0 billion was issued by non-financial and $31.2 billion by financial corporations. This represented a substantial rebound from a weak first quarter, when Chinese corporates redeemed large amounts of US dollar-denominated bonds.11 The stabilisation of the CNY/USD exchange rate during March-June 2016 is likely to have supported the rebound, after several bouts of turbulence in previous months.
Oil exporters in the Middle East were another source of the surge in international bond issuance (Graph 7, bottom right-hand panel). With oil prices reaching historical lows in February 2016, several governments turned to bond markets for funding. The United Arab Emirates ($14.4 billion net issuance), Qatar ($9 billion) and Oman ($5 billion) offered rare international bond placements in Q2 2016, all in US dollars. Overall, Africa and the Middle East contributed 32% of total net issuance by EMEs, close to the contribution from emerging Asia-Pacific (37%) and more than that from Latin America (23%).
Quarterly net issuance from central and eastern Europe (Graph 7, bottom left-hand panel) turned positive for the first time since end-2014, contributing around $9.4 billion (7%) to net issuance by EMEs in the second quarter of 2016.
1 This article was prepared by Torsten Ehlers and Cathérine Koch. Statistical support was provided by Kristina Bektyakova, Bat-el Berger, Anamaria Illes and Pamela Pogliani.
2 The term "international bank claims" as used in the BIS global liquidity indicators (GLIs) corresponds to its definition in the BIS locational banking statistics. International bank claims capture banks' cross-border claims in all currencies and their local claims in foreign currencies, where local claims refer to credit extended by banks' affiliates located in the same country as the borrower. The locational banking statistics are structured according to the location of banking offices and capture the activity of all internationally active banking offices in the reporting country regardless of the nationality of the parent bank. Banks record their positions on an unconsolidated basis, including those vis-à-vis their own offices in other countries.
3 Annual percentage changes reported for the international banking statistics are calculated as compounded quarterly percentage changes, based on the exchange rate-adjusted data published by the BIS. Annual growth rates for foreign currency credit are calculated as percentage changes in stocks compared with a year earlier, and are not adjusted for exchange rate changes.
4 The BIS defines international debt securities as securities issued by non-residents in all markets. For details, see B Gruić and P Wooldridge, "Enhancements to the BIS debt securities statistics", BIS Quarterly Review, December 2012, pp 63-76.
5 See "Highlights of global financing flows", BIS Quarterly Review, March 2016, p 28, for further discussion of these indicators and their interpretation. See also "Recent enhancements to the BIS statistics", BIS Quarterly Review, September 2016, pp 35-44, for a discussion of the credit-to-GDP gap measure and the historical series.
6 The BIS consolidated banking statistics are structured according to the nationality of reporting banks and are reported on a worldwide consolidated basis, ie excluding positions between affiliates of the same banking group. Banks consolidate their inter-office positions and report only their claims on unrelated borrowers.
7 For a more detailed treatment, see R McCauley and P McGuire, "Non-US banks' claims on the Federal Reserve", BIS Quarterly Review, March 2014, pp 89-97.
8 The currency composition of financial sector issuers does not show a clear trend, and indeed has been very volatile over the past few years.
9 See C Borio, R McCauley, P McGuire and V Sushko, "Covered interest parity lost: understanding the cross-currency basis", BIS Quarterly Review, September 2016, pp 45-64.
10 The dollar and euro shares in cumulative net issuance illustrated in Graph 7 add up, in some cases, to more than 100% because of negative net issuance in other currencies.
11 See R McCauley and C Shu, "Dollars and renminbi flowed out of China", BIS Quarterly Review, March 2016, pp 26-7.