Recent enhancements to the BIS statistics
The BIS has been enhancing its statistical offering to support monetary and financial stability analysis, in close coordination with central banks and international organisations. Some of this work has been undertaken in the context of the Data Gaps Initiative (DGI) endorsed by the G20.1 In the current issue of the Quarterly Review, the BIS is introducing new statistics in the following areas:
- Detailed locational banking statistics shedding further light on the geography of international banking, specifically the claims and liabilities of banks in each reporting country on counterparties in more than 200 countries.
- Time series on credit-to-GDP gaps.
- Commercial property price indicators.
- Historical time series on consumer prices.
In addition, the BIS is making publicly available daily data on nominal effective exchange rates for 61 countries, to complement the monthly data already published. The daily data will be updated on a weekly basis.
Locational banking statistics by reporting country2
One of the enhancements to the international banking statistics (IBS) agreed by the Committee on the Global Financial System following the Great Financial Crisis of 2007-09 was to make the IBS more widely available (CGFS (2012)). The new tables and data published by the BIS in September 2015 were an important step in that direction (Avdjiev et al (2015)). The BIS and central banks continue to work towards publishing more data and improving the tools for accessing them.
Concurrently with this Quarterly Review, the BIS has started publishing more details at the reporting country level from the locational banking statistics (LBS), in particular the claims and liabilities of banks in individual reporting countries on counterparties in more than 200 countries. Previously, the BIS had made public only two types of aggregates in the LBS: the positions of banks in all reporting countries on counterparties in individual countries (Table A6 in the BIS Statistical Bulletin and the BIS Statistics Explorer), and the positions of banks in individual reporting countries on all counterparties abroad (Table A5). The BIS now discloses a matrix of reporting countries and counterparty countries, for the full history of the LBS. For example, whereas previously only the cross-border claims of all LBS-reporting banks on borrowers in China were published, now the location of those reporting banks is also disclosed. This information shows that, at end-March 2016, banks in Hong Kong SAR were the main creditors, accounting for 42% of cross-border claims on China's mainland borrowers, followed by banks in Chinese Taipei with 9%.
Such geographical details can be used to analyse how shocks might propagate across sectors and borders. For example, they can help track how funds are transferred from sources in one country via banks to users in another. They can also shed light on the complexity of banks' international operations.
When undertaking such analysis, it is very important to distinguish between the unconsolidated office-level view in the LBS and the consolidated group-level view in the consolidated banking statistics (CBS). The LBS capture the positions of banking offices located in a given country, following the same residency principles as national accounts and balance of payments. By contrast, the CBS capture the worldwide positions of banking groups headquartered in that country, using the consolidated approach followed by banking supervisors. Accordingly, the principal use of the LBS is to analyse capital flows between countries, whereas the CBS provide measures of banks' country risk exposures.3
The published matrix of reporting countries and counterparty countries covers the cross-border positions of banks located in up to 29 LBS-reporting countries on counterparties in more than 200 countries. As many as eight series are publicly available in the LBS for each reporting-counterparty country pair: total claims and liabilities on counterparties in all sectors and the non-bank sector, and the same details for the instrument component loans and deposits. Selected series are published in Table A6 of the BIS Statistical Bulletin, and all the data can be downloaded from the BIS Statistics Explorer, the BIS Statistics Warehouse or in a single CSV file. A matrix of reporting countries and counterparty countries is also published for the CBS, in Table B4 of the BIS Statistical Bulletin.
Countries report to the BIS more details than these newly published series. However, the additional details are often less complete, owing to gaps in reporting. Moreover, granular data are often composed of data collected from very few banks. If an aggregate comprises data from only one or two banks, then its disclosure risks revealing proprietary information about those banks' activities. Consequently, reporting countries classify a significant part of the data that they report to the BIS as confidential and not for publication.4 Confidentiality restrictions result in holes in the data that the BIS can make publicly available. Indeed, for 15 of the 44 countries that report the LBS, limited details are currently published, and even among the 29 countries for which more details are published, historical data for some quarters may not be shown.
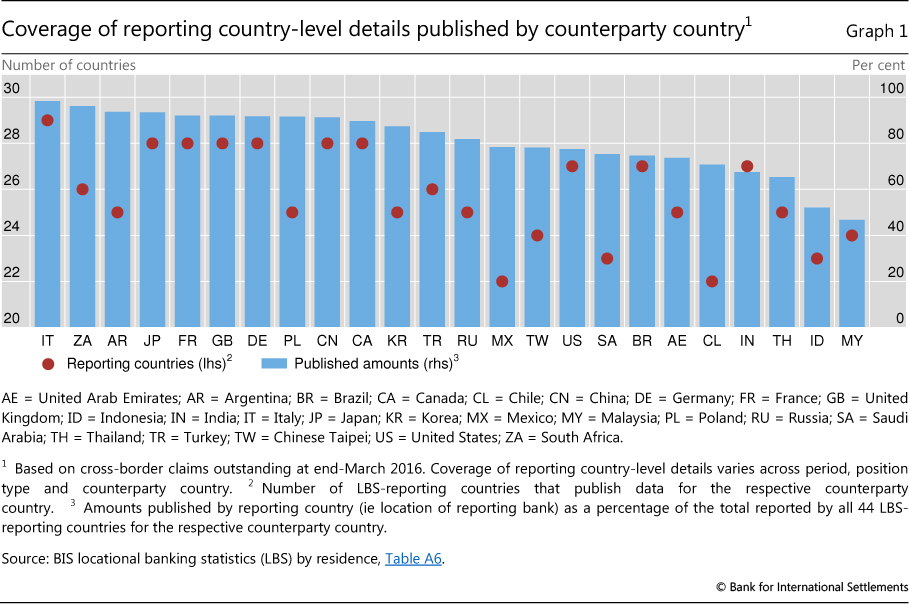
On average, the published matrix covers 90% of cross-border claims, although for any given counterparty country coverage ranges from 40% to 100% depending on the relative importance of the reporting countries that have agreed to publish their data (Graph 1). For example, 29 reporting countries have agreed to publish their cross-border claims on Italy (red dots), which represents almost 100% of all cross-border claims on Italy (blue bars). Twenty-four countries publish this information for Malaysia, which covers a little under 50% of all banks' cross-border claims on that country.
The credit-to-GDP gap5
The build-up of excessive credit features prominently in discussions about financial crises. While it is difficult to quantify "excessive credit" precisely, the credit-to-GDP gap captures this notion in a simple way. Importantly from a policy perspective, large gaps have been found to be a reliable early warning indicator (EWI) of banking crises or severe distress.6 The BIS already reports examples of these gaps in the EWI tables that are released in the March and September Quarterly Reviews as part of the discussions of global liquidity conditions.7
Complementing the regular publication of the EWI tables, the BIS has started releasing time-series data for the credit-to-GDP gap.8 The published series cover 43 countries starting at the earliest in 1961. Here we explain the methodology and data used.
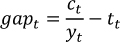
The credit-to-GDP gap (gapt) is defined as the difference between the credit-to-GDP ratio (ct/yt) and its long-run trend tt:
The trend to generate the credit-to-GDP gap is derived using a Hodrick-Prescott (HP) filter. The HP filter is a standard mathematical tool used in macroeconomics to establish the trend of a variable over time. Like any statistical concept, it is based on simplifying assumptions - in this case, that the original series (namely, the credit-to-GDP ratio: ct/yt) can be decomposed into two components: the trend tt and the cycle. Hodrick and Prescott (1997) proposed obtaining the trend by solving the following optimisation problem:
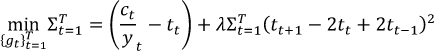
where λ (lambda) is the smoothing parameter. The first term in the loss function penalises the variance of the cyclical component, while the second imposes a penalty on the lack of smoothness in the trend. Hence, the solution to the problem is a trade-off between the smoothness of the trend and how well it fits the original series.
When calculating the trend for the credit-to-GDP gap, three technical features are important:
First, to capture data constraints in day-to-day policymaking, the trend tt is calculated by means of a one-sided (ie backward-looking) filter. In other words, the filter is run recursively for each period over an expanding sample, so that a trend for, say, end-2005 (t2005 Q4) only takes account of information up to the end of 2005 even if this calculation is done in 2016 when more observations have become available.
Second, we apply a much larger smoothing parameter λ than the one employed in the business cycle literature involving quarterly data. The parameter equals 400,000. This choice is motivated by the observation that credit cycles are on average about four times longer than standard business cycles. Empirically, this choice also leads to the best EWI performance.9
Last, we require at least 10 years of available data for the credit-to-GDP ratio before we publish a gap. Hence, if the credit-to-GDP ratio is first available in 1995, the credit-to-GDP gap series starts in 2005. We do so because the starting point for estimating the trend can have strong implications for the measurement of the gap if there is only a limited time series. Drehmann and Tsatsaronis (2014) show that this "start-point problem" is greatly diminished if at least 10 years of data are available.10
As input data, we use the credit-to-GDP ratio as published in the BIS database of total credit to the private non-financial sector (Dembiermont et al (2013)). The credit series capture total borrowing by the private non-financial sector (ie households and non-financial corporations) from all domestic and foreign sources, covering both bank and non-bank financing.11
Importantly, while the use of these total credit series as input data facilitates comparability across countries, it means that the credit-to-GDP gaps published by the BIS may differ from credit-to-GDP gaps considered by national authorities as part of their countercyclical capital buffer decisions. Given the EWI qualities of the gap, the indicator was adopted as a common reference point under Basel III to guide the build-up of countercyclical capital buffers (BCBS (2010)). Authorities are expected, however, to apply judgment in the setting of the buffer in their jurisdiction after using the best information available to gauge the build-up of system-wide risk rather than relying mechanistically on the credit-to-GDP guide. For instance, national authorities may form their policy decisions using credit-to-GDP ratios that are based on different data series from the BIS's as input data, leading to credit-to-GDP gaps that differ from those published by the BIS.
Commercial property price indicators12
In 2010, the BIS started disseminating a limited number of commercial property price indicators (CPPIs) collected from national central banks as part of its general work on property price statistics. Country coverage has improved significantly since then. The BIS will henceforth regularly publish these indicators as a separate data set on its website.13 The BIS also plans to further expand the coverage of this new data set in the near future as more indicators become available across countries.
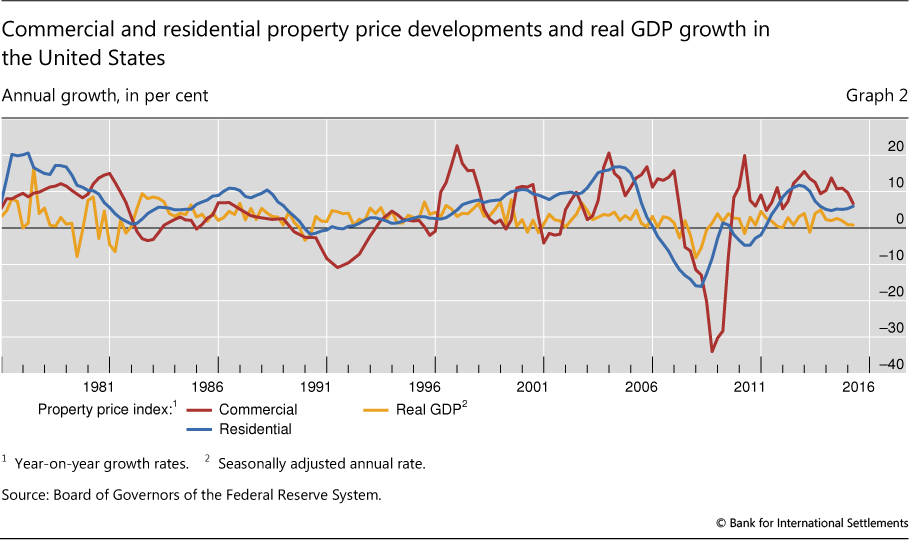
CPPIs have long been seen as a useful tool for monitoring financial stability and macroeconomic developments (see Graph 2 for commercial and residential property prices and GDP growth in the United States). Yet despite their importance, the availability and international comparability of CPPIs was limited before the Great Financial Crisis. After the crisis, the first phase of the G20's DGI initiative underlined the importance of CPPIs and members of the Inter-Agency Group on Economic and Financial Statistics (IAG)14 were asked to improve their dissemination and to start methodological work for their compilation. The second phase of the DGI, initiated in 2015, builds on this preparatory work. It recommends that international organisations enhance methodological guidance on the compilation of CPPIs and encourages dissemination of data on commercial property prices via the BIS website.15
At present, there is no agreement on a single definition of commercial property. Experts from international organisations in charge of developing best practice guidelines on price statistics are tentatively considering a definition that would treat a property (together with the land on which it is situated) as "commercial" if the underlying activity creates market output with the aim of generating profits. Based on this consideration, commercial properties may include properties rented out at market prices; those under construction for future sale; and those used in the production of market goods and services (for example, retail premises, offices, factories and warehouses). But there are other considerations that can lead to substantial differences.16 The commercial property price can be decomposed into the price of the land and the price of the structure. In case there is no price information on vacant land, statisticians may estimate the land value by deducting the construction costs from the price of the commercial property.
A number of potential sources can be used to measure commercial property price developments. The first and most preferred - but not always available - source is transaction records (official selling prices registered by land registries or tax authorities). A second and complementary source is appraisals or valuations (estimated prices based on expert judgment taking into account general market situation, the characteristics of the property and its location). Finally, financial market indicators (for instance, the share prices of funds investing mainly or solely in commercial property, such as real estate investment trusts (REITs)) can provide an indirect source, with good timeliness but limited coverage.
Each of these sources has advantages and drawbacks. The main advantage of transaction-based data is that land registries capture all transactions which take place in a relevant territory. But the number of transactions on commercial properties is usually low, especially during recessions, which hampers the compilation of representative price indices. Therefore, compilers and statisticians have to use appraisals as a complementary source (or even the only one). However, appraisal-based data also present several drawbacks: they often cover only a fraction of the market; and the appraisal quality depends on the expertise of the appraiser, who moreover may be pressured to bias the appraisal in the direction desired by the payer (ie the buyer, or the financial institution providing the loan). The third source, financial market data, can provide almost real-time information. However, disentangling the price change of the underlying assets from other factors affecting a real estate fund's performance is not an easy task; in addition, the portfolio of such funds usually consists mainly of premium-segment properties, which does not reflect the whole market.
Commercial property prices are published only in a handful of places. In several countries, the low number of transactions and the heterogeneity of commercial properties have prevented the compilation of official, transaction-based and quality-adjusted statistics. In some cases, private commercial providers instead compile appraisal-based data sets, but they are often not available to the public. Furthermore, the lack of international compilation guidelines has so far hampered cross-country comparability.
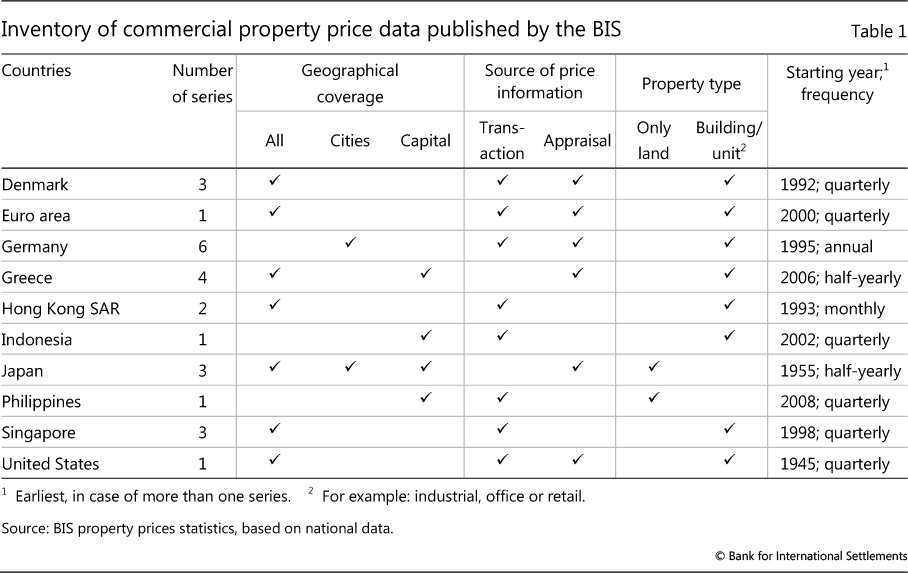
The scarcity of data is reflected in the limited number of series in the BIS data set. Currently, the BIS publishes 25 commercial property price series covering 10 countries, far fewer than the close to 300 residential property price series covering 58 countries (Table 1 summarises information on the available data). Nonetheless, data availability has improved somewhat recently and the DGI is likely to lead to further substantial improvements.
The main challenge in the coming years will be to expand country coverage while also enhancing the methodological guidance. The target set in the DGI is to reach a significant coverage of G20 economies by 2021. The ECB has already made progress towards improved coverage by mapping potential data sources, summarising the methodological challenges and publishing experimental data. Moreover, Eurostat, in cooperation with the aforementioned international organisations, will later this year publish a working paper summarising the various methodological and compilation issues. This publication will help statisticians compile and publish new indicators and will enhance the cross-country comparability of data.
Long series on consumer prices17
The BIS's data set on consumer prices contains long monthly and annual time series for 60 countries. The BIS long series have been used, in particular, for the calculation of the real effective exchange rate and real residential property price series published; they are also very useful in supporting economic research on macroeconomics and financial stability. These series are now available on the BIS website.18
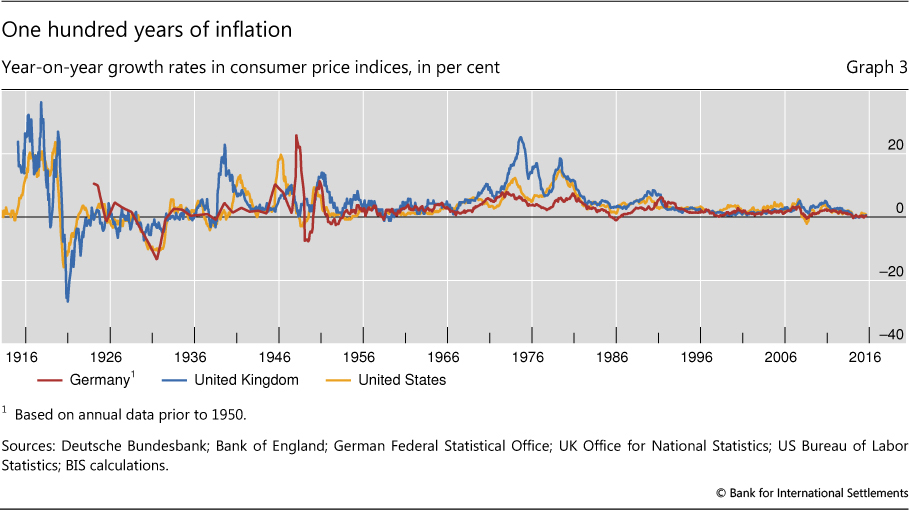
The average length of the monthly series is close to 55 years. Some annual series go back to the middle of the 19th century - or even earlier for several countries (see Graph 3 for data from Germany, the United Kingdom and the United States). For each country, the data for the most recent periods correspond to the consumer price index published by national statistical offices. Proxy indicators, such as a consumer price index with limited coverage or a retail price index, were used to extend the series backwards as far as possible. The series have been constructed by joining those available for consecutive periods.
In undertaking this work, the BIS has worked very closely with national authorities to provide the most accurate data possible.
References
Avdjiev, S, P McGuire and P Wooldridge (2015): "Enhanced data to analyse international banking", BIS Quarterly Review, September, pp 53-68.
Bank for International Settlements (2015): "Introduction to BIS statistics", BIS Quarterly Review, September, pp 35-51.
--- (2016): "Highlights of global financial flows", BIS Quarterly Review, September, Table 1, p 22.
Basel Committee on Banking Supervision (2010): Guidance for national authorities operating the countercyclical capital buffer, December.
Committee on the Global Financial System (2012): "Improving the BIS international banking statistics", CGFS Publications, no 47, November.
Dembiermont, C, M Drehmann and S Muksakunratana (2013): "How much does the private sector really borrow? A new database for total credit to the private non-financial sector", BIS Quarterly Review, March, pp 65-81.
Detken, C, O Weeken, L Alessi, D Bonfim, M Boucinha, C Castro, S Frontczak, G Giordana, J Giese, N Jahn, J Kakes, B Klaus, J Lang, N Puzanova and P Welz (2014): "Operationalising the countercyclical capital buffer: indicator selection, threshold identification and calibration options", European Systemic Risk Board, Occasional Paper Series, no 5, June.
Drehmann, M (2013): "Total credit as an early warning indicator for systemic banking crises", BIS Quarterly Review, June, pp 41-5.
Drehmann, M, C Borio, L Gambacorta, G Jiménez and C Trucharte (2010): "Countercyclical capital buffers: exploring options", BIS Working Papers, no 317, July.
Drehmann, M, C Borio and K Tsatsaronis (2011): "Anchoring countercyclical capital buffers: the role of credit aggregates", International Journal of Central Banking, vol 7, no 4, 2011.
Drehmann, M and K Tsatsaronis (2014): "The credit-to-GDP gap and countercyclical capital buffers: questions and answers", BIS Quarterly Review, March, pp 55-73.
Financial Stability Board and International Monetary Fund (2015): The Financial Crisis and Information Gaps: Sixth Progress Report on the Implementation of the G-20 Data Gaps Initiative, September.
Hodrick, R and E Prescott (1997): "Postwar US business cycles: an empirical investigation", Journal of Money, Credit and Banking, vol 29, no 1, pp 1-16.
1 See FSB and IMF (2015).
2 This section was prepared by Swapan Kumar Pradhan and Philip Wooldridge.
3 For discussion of the uses of the LBS and CBS, see BIS (2015).
4 The reporting of such data to the BIS is critical to ensure that global aggregates, which sum data from all reporting countries, are as complete as possible. Data that are not for publication are disclosed to authorities that report the international banking statistics, subject to restrictions on their use and dissemination so as to ensure that the confidentiality of unpublished data is respected. Such data may be available to researchers through joint projects with staff at the BIS or reporting authorities. The BIS and many central banks offer research fellowships to support such projects, eg www.bis.org/research/fellowship.htm.
5 This section was prepared by Mathias Drehmann; Marjorie Santos and José María Vidal Pastor provided research assistance.
6 See Drehmann et al (2011) or Detken et al (2014).
7 The most recent indicators are shown in BIS (2016).
8 http://www.bis.org/statistics/c_gaps.htm.
9 See Drehmann et al (2010).
10 The start point problem is the flip side to the well known "end-point" problem of the HP filter. Note, though, that the end-point problem does not invalidate the EWI ability of the credit-to-GDP gap. From a practical perspective, it would be impossible for the policymaker to apply a two-sided filter since the future is not known. But even if policymakers did somehow know the future values of the credit-to-GDP ratio and calculated credit gaps based on this knowledge, Drehmann and Tsatsaronis (2014) show that the resulting indicator would not outperform the gap calculated with the backward-looking HP filter except for exceedingly short forecast horizons of less than four quarters.
11 Drehmann (2013) shows that the credit-to-GDP gap derived from total credit is a better EWI than if the credit takes only bank credit into account.
12 This section was prepared by Robert Szemere.
13 http://www.bis.org/statistics/pp_commercial.htm.
14 The IAG comprises the BIS, the ECB, Eurostat, the International Monetary Fund (IMF, Chair), the Organisation for Economic Co-operation and Development (OECD), the United Nations and the World Bank. It was established in 2008 to coordinate statistical issues and data gaps highlighted by the Great Financial Crisis and to strengthen data collection.
15 The BIS is working closely with a number of organisations, especially the Deutsche Bundesbank, the ECB, Eurostat, the IMF and the OECD, in developing commercial and residential property price statistics.
16 For instance, one may also decide to categorise properties based on their use (ie housing); in that case, flats and houses rented out would not be considered as commercial properties.
17 This section was prepared by Robert Szemere.