Dollars and renminbi flowed out of China
(Extract from pages 26-27 of BIS Quarterly Review, March 2016)
Persistent private capital outflows from China since June 2014 have led to two different narratives. One tells a story of investors selling mainland assets en masse; the other of Chinese firms paying down their dollar debt. Our analysis favours the second view, but also points to what both narratives miss - the shrinkage of offshore renminbi deposits.
Our approach, presented in the September 2015 BIS Quarterly Review, starts from the BIS international banking statistics reported by banks outside China. This contrasts with other analyses which typically take changes in official foreign reserves (plus current account surplus) as capital outflows, which require complicated estimation of valuation and other adjustments. To understand the cross-border outflow of capital in the BIS data, we follow the money from declining offshore renminbi deposits in East Asia and declining foreign currency loans at banks in mainland China, as reported by the People's Bank of China (PBoC). In addition, we exclude from the BIS data PBoC deposits with overseas banks, using new data consistent with the IMF's special data dissemination standard (SDDS).
We start with a record $175 billion net decline in BIS reporting banks' cross-border loans to China in Q3 2015 (Graph A, left-hand panel, red line), almost double the outflow in Q1. It reflected both a sharp decline in loans to China and continued growth in liabilities to China (ie China's cross-border deposits). The new SDDS data show that $12 billion of this Q3 outflow was due to an increase in Chinese official foreign exchange reserves deposited at banks located outside China (a capital outflow). That leaves $163 billion of non-reserve outflows to be accounted for. National and BIS data suggest that these outflows through BIS reporting banks reflected a reduction of (i) renminbi deposits offshore, (ii) net dollar debt of Chinese firms cross-border and (iii) their net debt within China.
(i) Offshore, as firms and households reduced renminbi deposits, banks outside China in turn reduced their cross-border renminbi deposits with mainland banks. In particular, banks in Chinese Taipei, Hong Kong SAR, Korea, Macao SAR and Singapore reported a $40 billion equivalent decline in renminbi deposits in Q3 2015, which was associated with depreciation in the renminbi/dollar rate (Graph A, centre panel). In response to lower demand for renminbi deposits, banks in these and other jurisdictions drew down their cross-border renminbi deposits with mainland banks, leading to a capital outflow of $80 billion (PBoC data) that amounts to half of the $163 billion outflow.
(ii) BIS data show that firms in China reduced their cross-border net debt (Graph A, left-hand panel, blue line). The share of this in currencies other than the renminbi, mostly the dollar, amounted to $34 billion (directly included in the $163 billion).
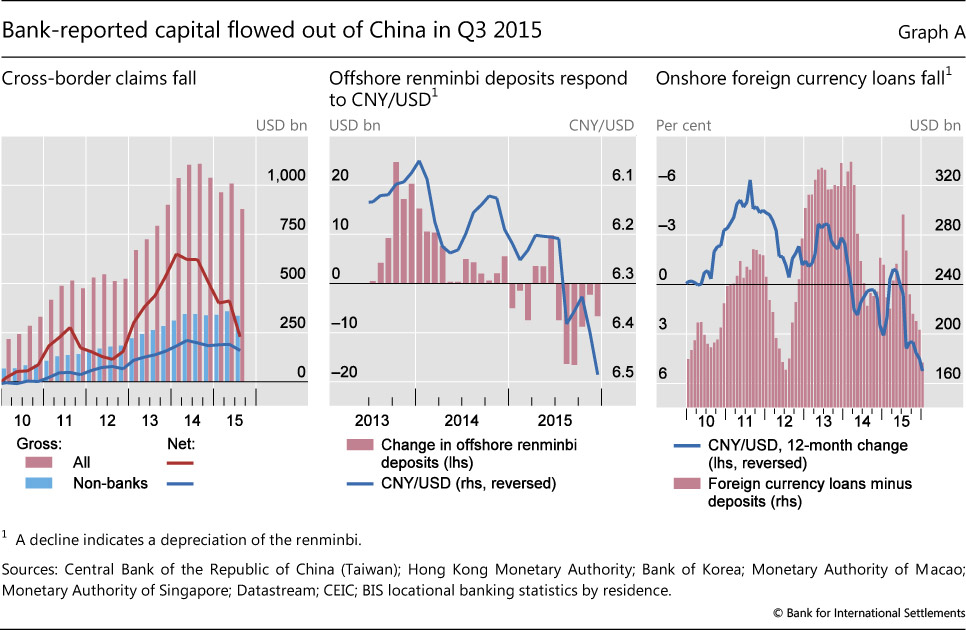
(iii) Within China, firms' reduction in net foreign currency loans from mainland banks led these banks in turn to reduce cross-border net liabilities in Q3 2015 (a capital outflow). PBoC data show that firms reduced their net foreign currency debt to banks in China by $7 billion in Q3 (Graph A, right-hand panel). If mainland banks squared their position with BIS reporting banks outside China, this would have contributed to the $163 billion outflow.
Overall, reduction of renminbi holdings offshore ($80 billion), and Chinese firms' net repayment of foreign currency debts cross-border ($34 billion) and within China ($7 billion), amounted to $121 billion. This can account for almost three quarters of the non-reserve outflows of $163 billion revealed by the BIS banking data.
Partial data suggest that outflows from China continued in Q4 2015. The rundown of renminbi deposits offshore slowed, judging from both partner data (Graph A, centre panel) and the PBoC-reported renminbi deposits (down $24 billion, versus $80 billion in Q3). However, Hong Kong Monetary Authority data on cross-border claims on Chinese non-banks (close to 40% of the BIS total) for October and November show an acceleration of net outflows. In addition, onshore net foreign currency loans contracted faster, at $29 billion (vs $7 billion in Q3).
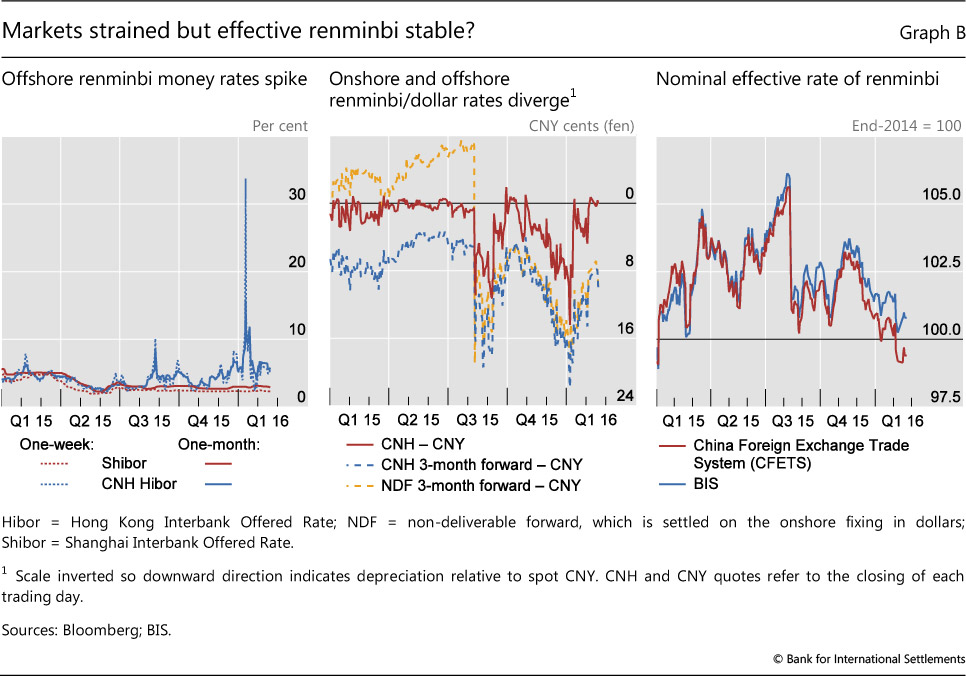
Q1 2016 price developments suggest greater strains than in the second half of 2015, with associated incentives for fund outflows. Many market participants interpreted the PBoC's management of the exchange rate in early January as signalling an intended depreciation against the dollar, and offshore interest rates briefly surged to levels exceeding those in August-September (Graph B, left-hand panel). Onshore and offshore spot rates diverged more than in Q3, and offshore forwards pointed to a sharper depreciation (Graph B, centre panel).
 And yet, this volatility in money market and bilateral exchange rates contrasted with the renminbi's limited fluctuation against a basket of trading partner currencies (Graph B, right-hand panel). To recap, our analysis suggests that recent outflows from China can be explained, to a large extent, by continued shrinkage of the offshore renminbi market and Chinese firms' paydown of net foreign currency debt. The PBoC's declared intention to keep the renminbi stable in effective terms would imply a weaker renminbi against the dollar were the dollar to appreciate against major currencies. In this event, offshore depositors might not hold onto maturing renminbi deposits and Chinese firms would still have reason to repay dollar-denominated debt.
See R McCauley, "Capital flowed out of China through BIS reporting banks in Q1 2015", BIS Quarterly Review, September 2015, pp 28-9. Spot CNY/CNH gapped to CNY 14 cents (fen) on 6 January 2016, above the Q3 2015 high (11 fen) and close to 2010's alltime high of 15 in M Funke, C Shu, X Q Cheng and S Eraslan, "Assessing the CNH-CNY pricing differential", Journal of International Money and Finance, vol 59, 2015, p 250. In the forward market, the CNH and NDF markets priced in 2.5% and 3% depreciation over three months, compared with 0.7% in the CNY market. As foreseen in R McCauley, C Shu and G Ma, "Non-deliverable forwards: 2013 and beyond", BIS Quarterly Review, March 2014, pp 75-88, NDF forwards have fallen to only half of forwards in the April 2015 Bank of England data from ¾ in 2013.