Highlights of global financing flows
The BIS, in cooperation with central banks and monetary authorities worldwide, compiles and disseminates data on activity in international financial markets. It uses these data to compile indicators of global liquidity conditions and early warning indicators of financial crisis risks. This chapter analyses recent trends in these indicators. It also summarises the latest data for international banking markets, available up to September 2015, and for international debt securities, available up to December 2015.1
Takeaways
- International financing, as measured by the BIS global liquidity indicators (GLIs), slowed in the second half of 2015. Aggregate international bank credit in the third quarter declined compared with a year earlier. The stock of international debt securities grew in the year to December 2015, but at a slower pace than in recent years.
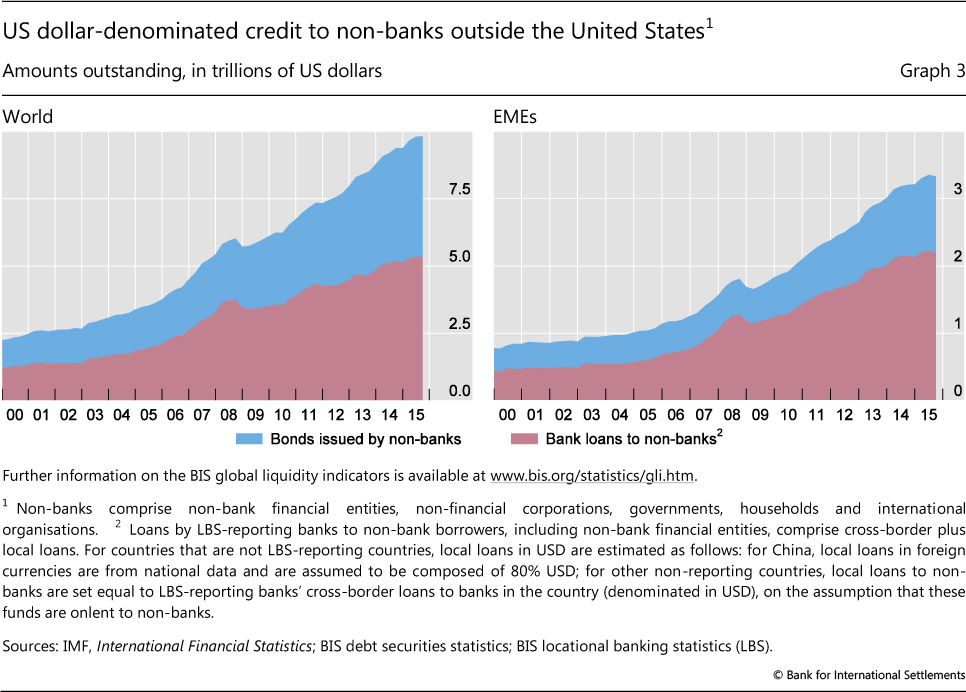
- US dollar credit to non-bank borrowers outside the United States stood at $9.8 trillion in September 2015, essentially unchanged from the previous reading in June. Dollar borrowing by non-banks in emerging market economies (EMEs) stood at $3.3 trillion, again unchanged from June. This was the first time since 2009 that the latter has stopped increasing.
- The stock of cross-border claims fell for the second consecutive quarter, due mainly to falling claims on major EMEs. The global contraction of $157 billion between end-June and end-September 2015 was smaller than the previous quarter's and left outstanding claims at $27 trillion. Banks' cross-border claims on EMEs declined by $141 billion in the third quarter, or 6% year on year. The decline was primarily driven by claims on emerging Asia, and China in particular, while claims on other EMEs changed relatively little.
- The total amount of international debt securities outstanding decreased by 0.2% in the fourth quarter of 2015, with repayments exceeding new issues by $47 billion.
- The contraction was mainly driven by weak issuance by financial companies in advanced economies. Net debt issuance by EMEs was relatively stable.
- The euro as a currency of denomination gained popularity among non-financial issuers headquartered in the United States, with total net issuance in euros in the fourth quarter accounting for 48% of the US total.
Global credit slows
International credit aggregates slowed in the third quarter of 2015. Aggregate international bank claims2 contracted by 0.8% compared with a year earlier (Graph 1, top panel). A decline in interbank claims outweighed a positive, but slowing, growth rate in bank claims on non-banks. This marked the first outright contraction in international bank claims overall since the first quarter of 2014. International debt securities issuance3 was more stable. The stock of outstanding securities fell slightly in the fourth quarter relative to the third, but was still 2.3% greater than a year earlier (Graph 1, bottom panel).4
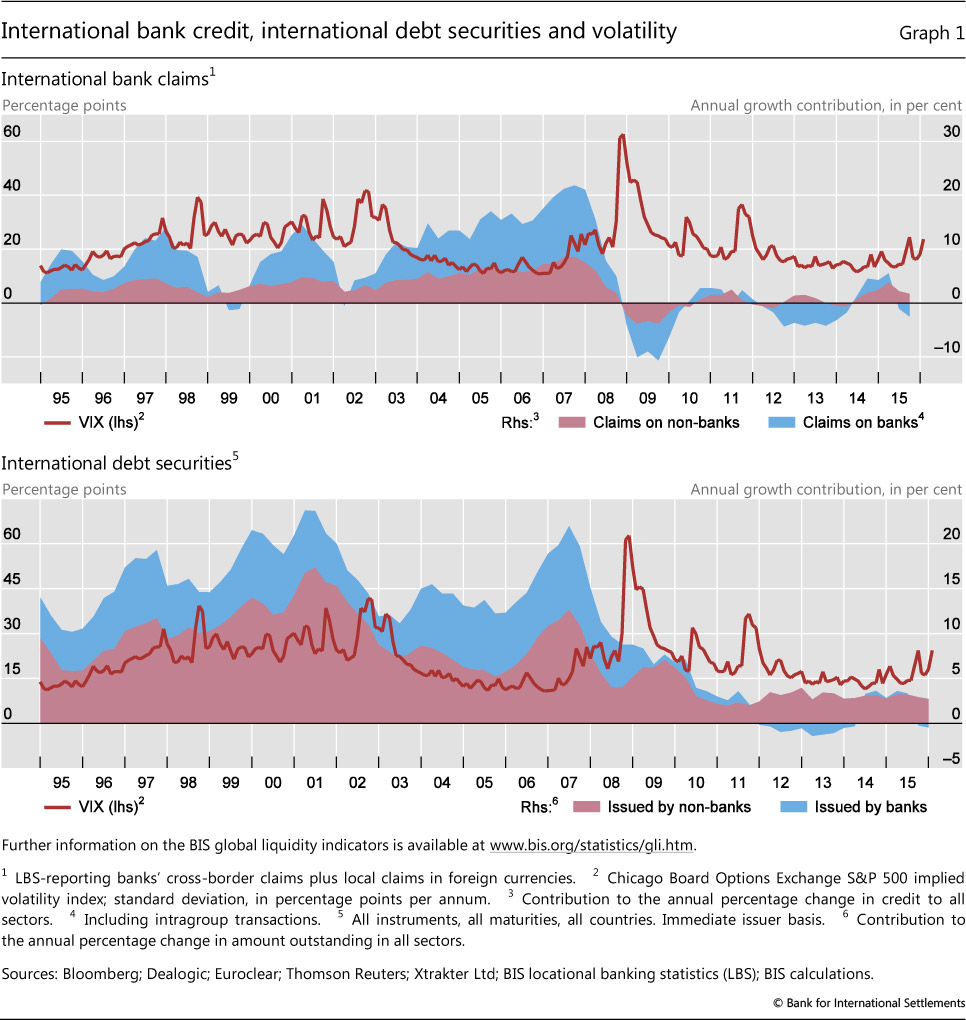
As discussed later in these Highlights, however, debt securities issuance by emerging economies, while slightly positive on a net basis, was sharply lower throughout the second half of the year. International issuance continued to be dominated by non-banks.5
These developments in international bank and securities credit are significant because they may signal a turning point in global liquidity - loosely understood as the ease of financing in international financial markets.6 Periods of abundant international financing tend to coincide with exuberant attitudes towards risk, as signalled, for example, by relatively low levels of the VIX index, which measures market expectations of volatility as derived from option prices (Graph 1). In particular, borrowing in foreign currencies may create currency mismatches and fund unsustainable carry trades. At the same time, as growth in some of the larger emerging economies has slowed, reduced demand for credit has also played a role in the slowdown in international financing.
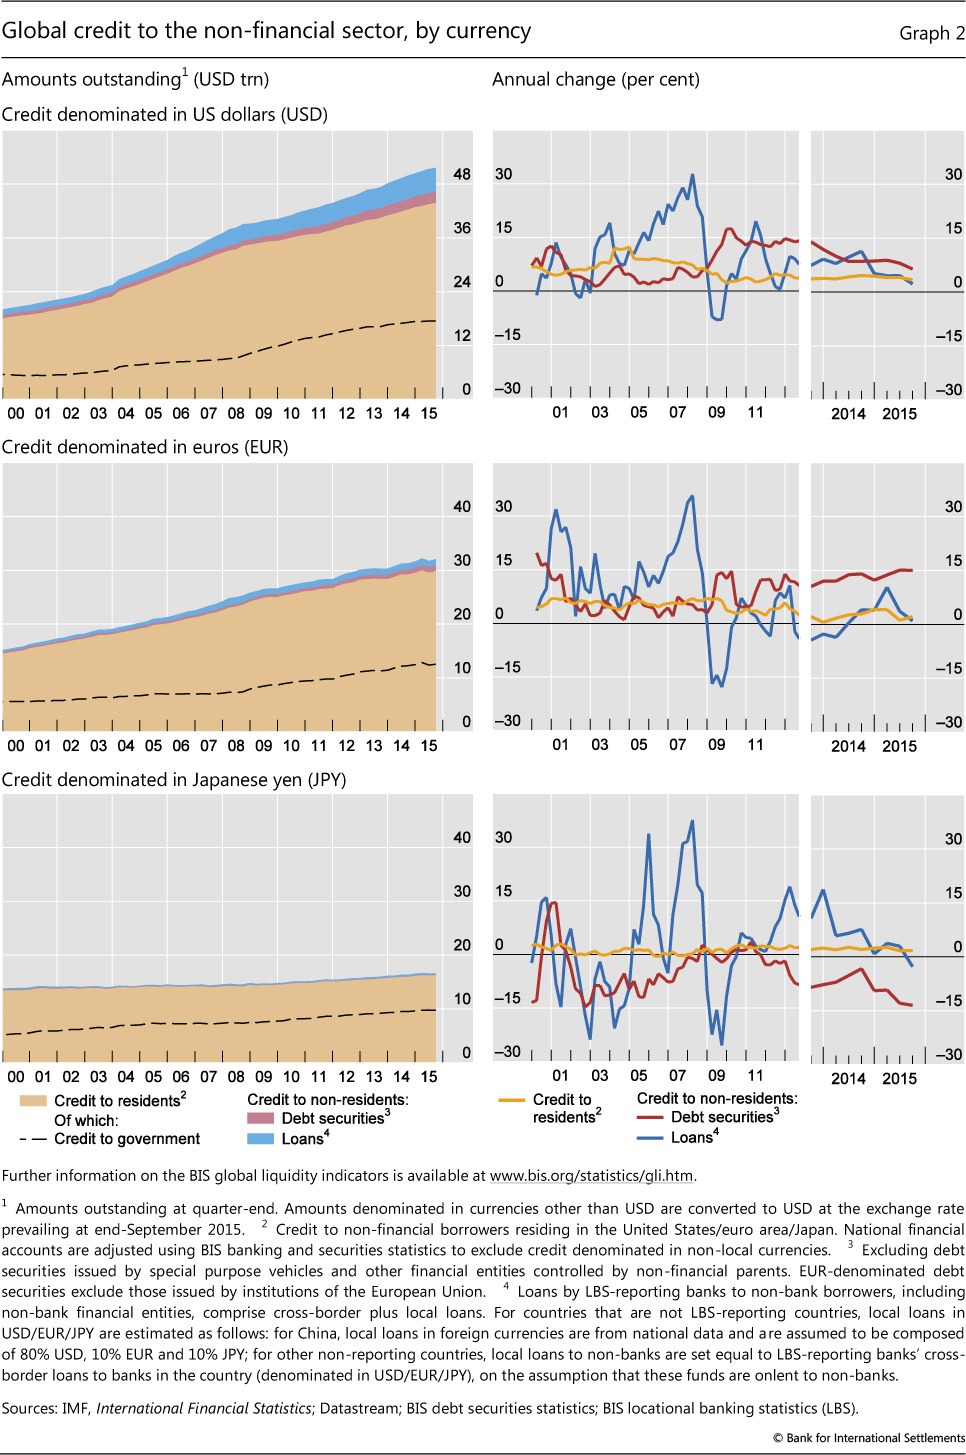
Indeed, the outstanding stock of credit to non-resident non-financial borrowers in dollars and euros stagnated in the third quarter. The stock of US dollar credit to non-financial borrowers outside the United States was essentially stable, at $7.9 trillion, in the second quarter and the third (Graph 2, top panels). When non-bank financial borrowers are added, this amount rises to $9.8 trillion, again with little change from the second quarter to the third (Graph 3, left-hand panel). US dollar credit to non-banks in emerging economies remained at around $3.3 trillion (Graph 3, right-hand panel). As was the case throughout 2015, bank and securities credit in US dollars to non-residents diverged, with dollar-denominated bank lending outside the United States slowing significantly while non-resident securities issuance continued at a healthy pace (Graph 2, top right-hand panel).
Euro-denominated credit to borrowers outside the euro area was also flat, totalling $2.2 trillion to non-financial borrowers and $2.7 trillion when non-bank financials are included. Non-resident credit in Japanese yen remained relatively low, totalling $392 billion, with both bank and securities credit to non-residents contracting in the third quarter (Graph 2, bottom panels).
The slowdown in international credit aggregates which seems to have taken hold towards the end of 2015, and which has coincided with a sharp increase in the VIX, could signal a tightening of external financing conditions for emerging market economies. The consequences have been felt recently in turbulent markets ("Uneasy calm gives way to turbulence", BIS Quarterly Review, March 2016). The strength of the dollar since mid-2014 may have contributed, with a lag, to pressure on borrowers to reduce or reverse these positions. More recently, in some countries, such as China, tighter conditions have been reflected in a slowdown or reversal of some categories of capital flows and a reduction of foreign currency exposures (Box 1). If they persist, tighter global liquidity conditions may raise stability risks in some countries, especially those where other indicators already point to a heightened risk of financial stress (Box 2).
The remainder of these Highlights looks more closely at patterns of international financing in the second half of 2015. The next section considers international banking flows in the third quarter, including their breakdowns by borrower country and region. The following section looks at international debt securities issuance, based on data up to the fourth quarter of 2015. Box 1 looks at recent developments in capital flows to and from China, while Box 2 examines the BIS early warning indicators of banking distress.
International banking flows contract, led by EMEs
Outstanding cross-border claims of BIS reporting banks contracted during the third quarter of 2015 (Graph 4, left-hand and centre panels). While lending to EMEs experienced a sharp decline, claims on advanced economies remained broadly unchanged.
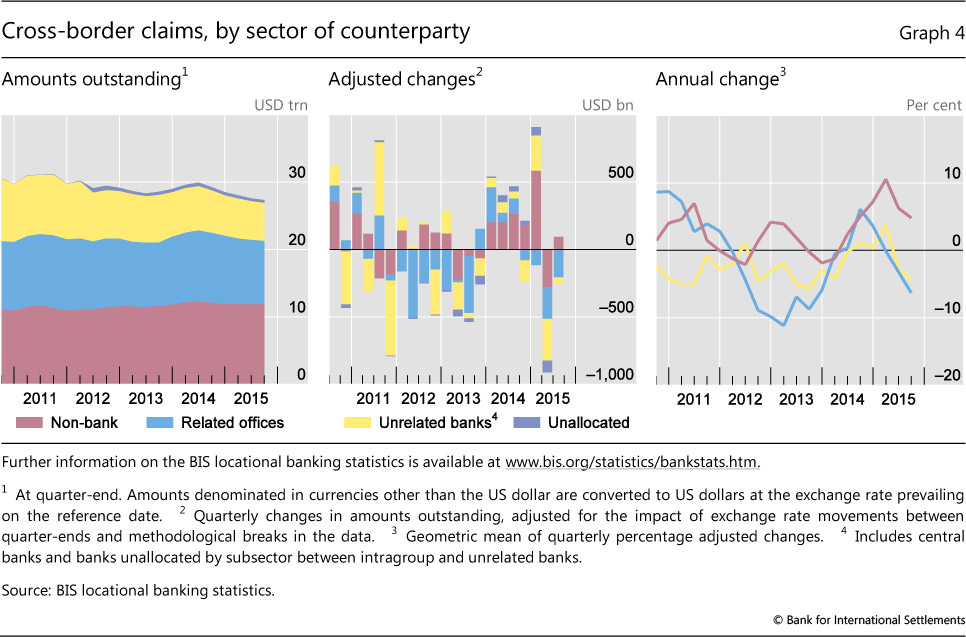
Cross-border claims of BIS reporting banks fell by $157 billion after adjusting for breaks in series and exchange rate movements.7 The quarterly decline, which followed a larger drop in the second quarter, left the outstanding amount of cross-border claims at $27 trillion and nudged the year-on-year growth rate into negative territory (-1%).
Cross-border claims on banks and non-banks diverged in the third quarter (Graph 4, right-hand panel). The aggregate drop was driven by a $251 billion decline in interbank claims. This was in turn driven by a fall in inter-office positions, leading to an annual rate of contraction of 5%. By contrast, cross-border claims on non-banks rose slightly.
Trends also diverged between the advanced and emerging economies. Aggregate cross-border claims on advanced economies remained virtually unchanged during Q3 2015, at $20 trillion outstanding (Graph 5, top panels), while those on EMEs shrank by $141 billion (Graph 5, bottom panels). Emerging Asia accounted for more than the overall decline ($145 billion), as claims increased slightly on other EME regions.
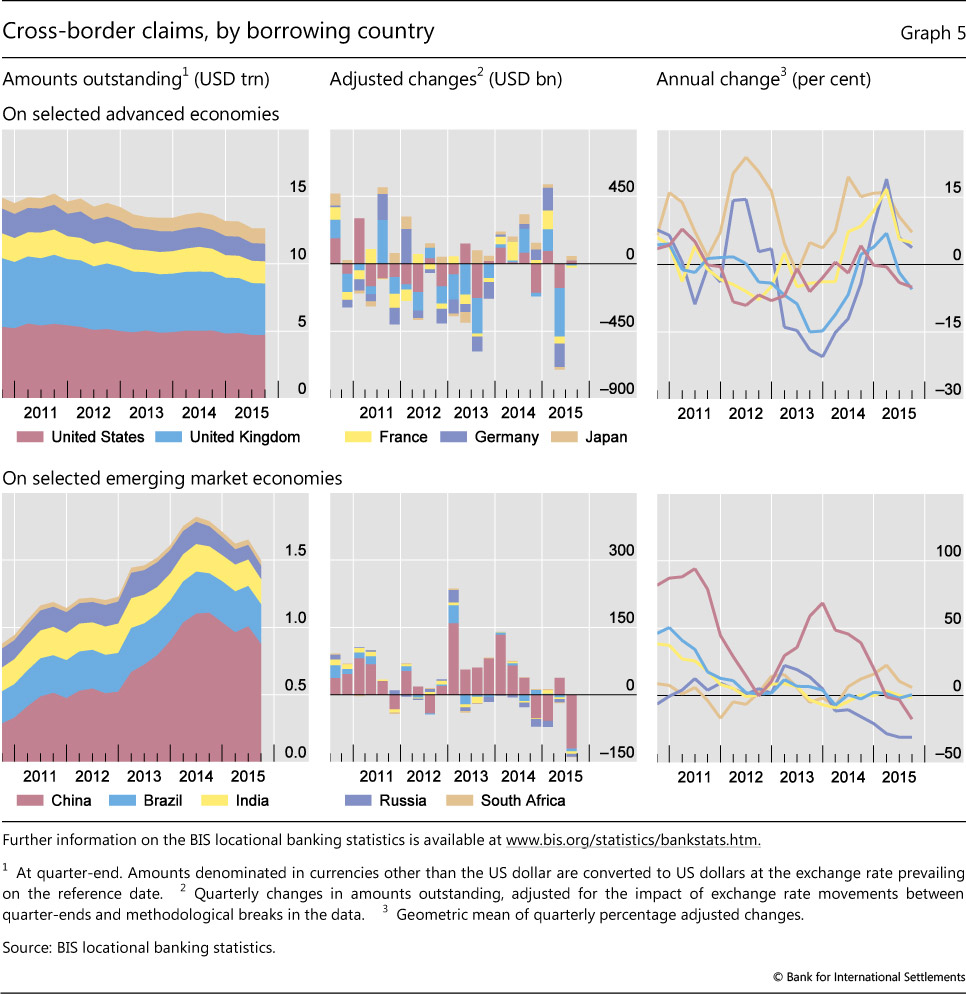
In particular, cross-border claims on China fell by $119 billion during Q3 2015, reducing their outstanding stock to $877 billion. This compares with the peak of $1.1 trillion at end-September 2014. The annual pace of decline accelerated to -17% as of end-September 2015. A drop of $100 billion in international interbank activity (including inter-office positions) with China was the main driver, but claims on the non-bank private sector also fell by $19 billion. At end-September 2015, cross-border lending to banks in China still amounted to 61% of the country's total cross-border borrowing from BIS reporting countries, down from 68% within the past 12 months. On a consolidated basis, short-term international claims,8 with remaining maturities of up to one year, fell from their peak of $858 billion in mid-2014 to $625 billion at end-September 2015.
Banks from several advanced economies are exposed to China. UK banks ranked first, followed by those from the euro area, Japan and the United States.9 The trend towards a reduction of carry trade positions (short US dollars, long renminbi) discussed in the September 2015 BIS Quarterly Review continued into the summer and autumn of 2015 (Box 1).
Cross-border claims on emerging Asia excluding China fell by $26 billion in the third quarter of 2015. The latest quarterly decline took the annual rate of contraction to -5% and the outstanding total to $874 billion. Lending to Chinese Taipei contracted by $8.8 billion, while cross-border claims on Korea shrank by $7.9 billion and those on India by $5.6 billion. In the year to end-September 2015, cross-border lending to Chinese Taipei contracted by 20%, while that to Korea and India by 7% and 1%, respectively.
Overall, cross-border lending flows to the other EME regions were relatively flat during Q3 2015. But this, conceals divergent trends across countries and regions (Graph 5, bottom panels). Cross-border lending to Latin America and the Caribbean remained virtually unchanged during Q3 2015. Claims on Brazil, however, fell by $6 billion, reducing their annual growth rate to 1%, while claims on Colombia expanded by $1.5 billion (or 17% year on year) and cross-border lending to Mexico remained virtually unchanged. Cross-border lending to emerging Europe fell by $5.9 billion, while the annual pace of contraction stood at 7.5%. Lending to Russia contracted by $7.0 billion, bringing the annual rate of decline to 30%. Cross-border claims on Turkey, the region's largest borrower, rose by $2.6 billion, lifting their year-on-year growth rate to 1.3% at end-September 2015. Cross-border claims on developing Africa and Middle East continued to expand rapidly between end-June and end-September 2015. The latest $11 billion quarterly increase took the annual rate of expansion to 8.7 %.
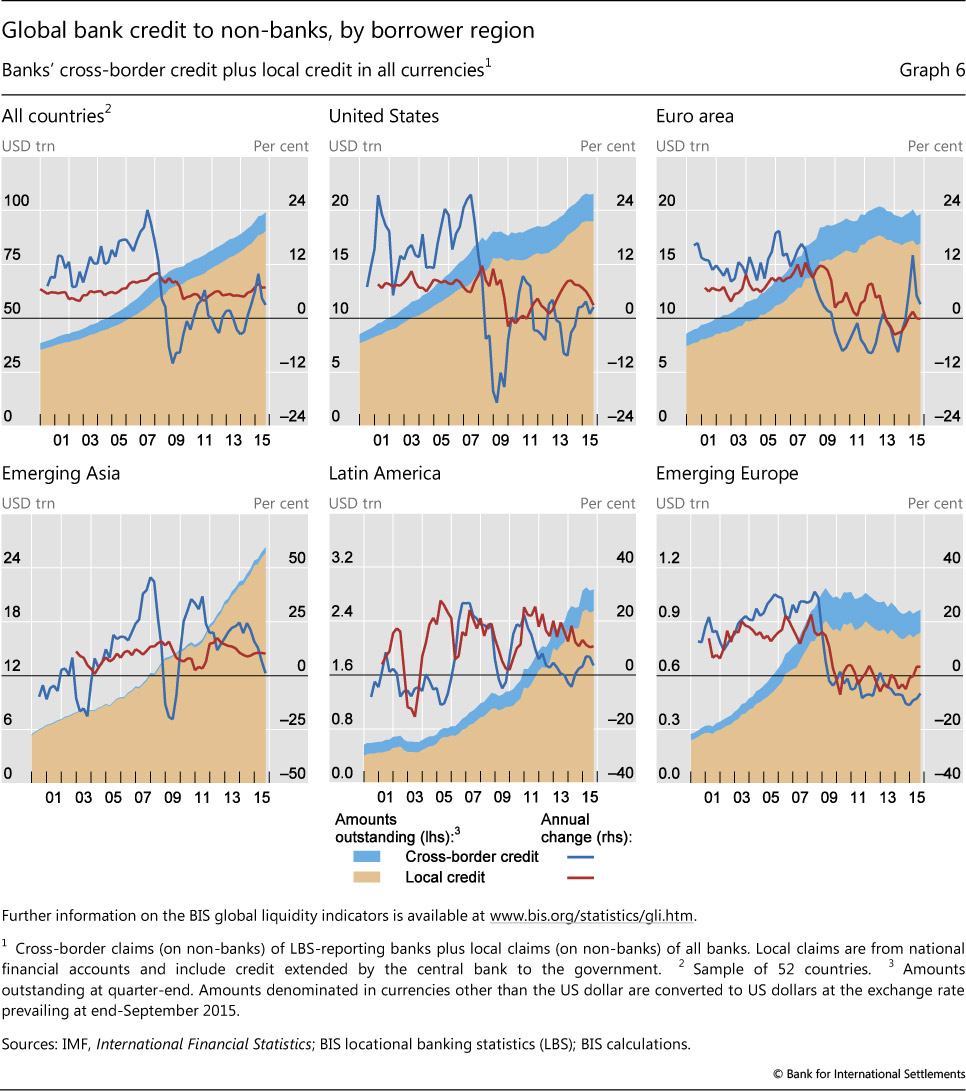
These divergent regional trends in international bank lending were reflected in patterns of cross-border bank credit to non-banks (Graph 6). In emerging Asia, cross-border credit to non-banks grew only 1% in the third quarter compared with a year earlier, continuing a sharp slowdown (Graph 6, bottom left-hand panel). Such credit, which at $612 billion is quite small in absolute terms, had grown 6% year on year in the second quarter and at double-digit annual rates since 2009. As a result, domestic bank credit outpaced cross-border credit in the third quarter in emerging Asia, as it has in Latin America, emerging Europe and the United States for the past few years. Cross-border credit growth continues to exceed that of local credit in the euro area, although the pace slowed markedly in 2015 (Graph 6, top right-hand panel).
International debt securities issuance weakens
International debt securities issuance was weak in the last quarter of 2015. After falling to $64 billion in the third quarter, net debt issuance turned negative at almost -$47 billion, a reduction of 0.2% in the total amount outstanding after accounting for exchange rate movements. The negative number marked the largest contraction registered since the third quarter of 2012. The decline was driven by both a significant decrease in issuance by advanced economies and subdued issuance by emerging economies. Net issuance in advanced economies totalled - $78 billion, reducing the amount outstanding by 0.5% from the previous quarter. EME borrowers issued $16 billion on net, 0.5% more than in the previous quarter but still significantly less than in any other quarter after the financial crisis. Offshore centres and international organisations accounted for the remainder.
The fall in outstanding international debt in advanced economies was mainly driven by the financial sector. Net repayments by financial institutions rose to $110 billion, decreasing the amount outstanding for this sector by 1% (Graph 7, top left-hand panel). Net issuance by European and US financial borrowers was particularly weak. Net issuance was also negative or low in most of the other advanced economies, with the exception of Australia and Japan. But non-financial corporations issued a net $50 billion of new debt, increasing outstanding stocks by 1%. Despite the negative number in the last quarter of the year, total net issuance by advanced economies in 2015, at $250 billion, was the highest annual total since 2011 (Graph 7, bottom left-hand panel).
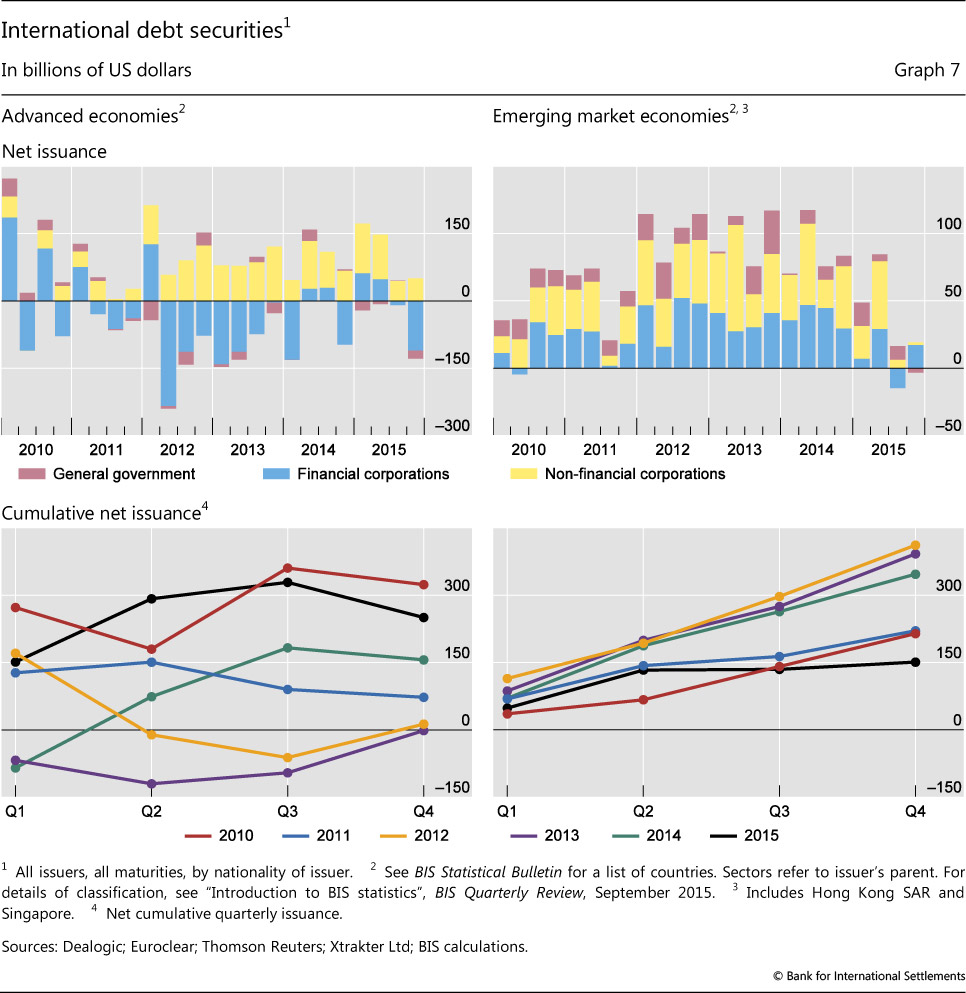
EMEs' net debt issuance was subdued at $16 billion in the fourth quarter of 2015, representing an increase of 0.5% in the amount outstanding at the end of the previous quarter (Graph 7, bottom right-hand panel). Net issuance by financial corporations partially recovered after the net repayments registered in the third quarter of the year. Chinese banks, however, significantly increased their debt securities issuance in Q4, in contrast to the slowdown in their interbank borrowing in the third quarter, as noted above. The issuance of local debt in China remained strong, according to data from the People's Bank of China. Net issuance by non-financial corporations, however, was weak at $2 billion in the fourth quarter of the year, similar to the low amount registered in the previous quarter (Graph 7, top right-hand panel). Net debt issuance by EMEs in 2015, at $151 billion, was overall the lowest in six years.
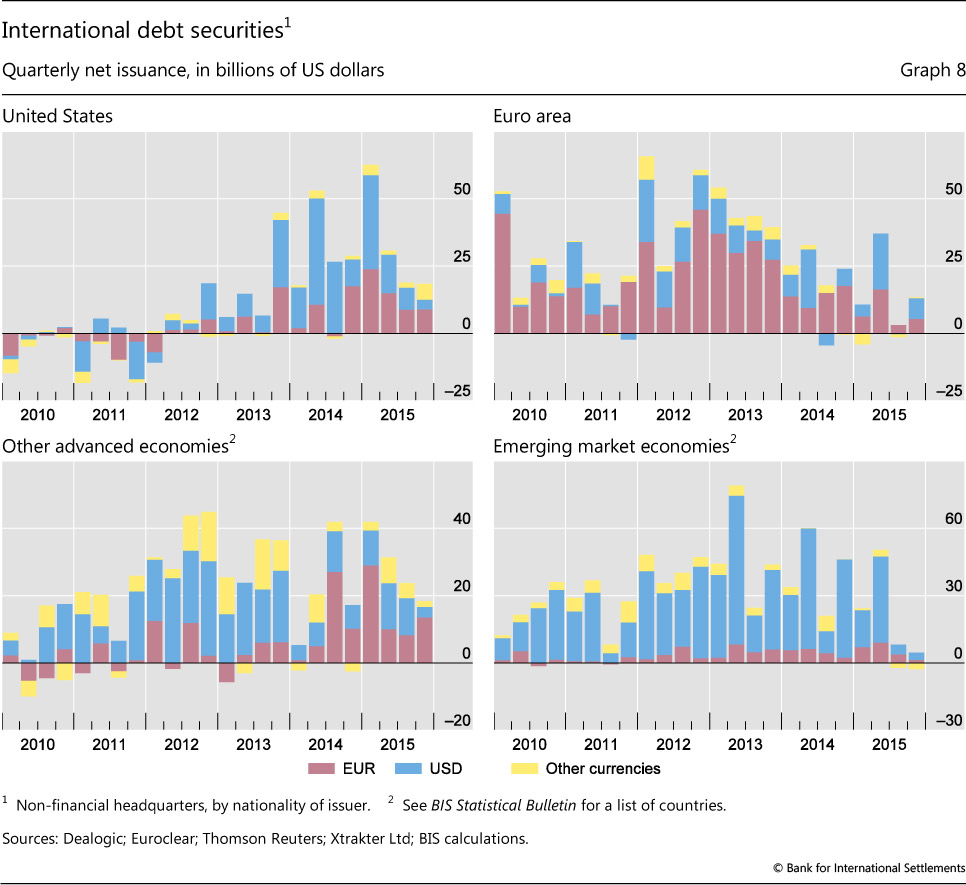
The year 2015 marked a significant increase in the use of the euro as a currency of denomination for international debt securities issued by non-financial borrowers. In the last quarter of the year, net issuance of international debt securities in euros was $29 billion, an increase of 1.5% in the amount outstanding. Non-financial borrowers headquartered in the United States issued $9 billion in euro-denominated debt, an increase of 4% in the amount outstanding from the third quarter. This accounted for 48% of the net international issuance by US non-financial borrowers (Graph 8, top left-hand panel). Euro-denominated net issuance in the euro area remained strong in the fourth quarter at $5 billion (Graph 8, top right-hand panel). Euro-denominated net issuance rose from 35% to 73% of the total in other advanced economies (bottom left-hand panel), and from 61% to 69% of the total in emerging economies (bottom right-hand panel). At the same time, issuance in other currencies weakened. Net issuance in dollars was $18 billion, a less than 1% increase over the amount outstanding at the end of the previous quarter, and net issuance in sterling was $4 billion, also a less than 1% increase in the total amount outstanding with respect to the previous quarter.
Box 1
Dollars and renminbi flowed out of China
Robert N McCauley and Chang Shu
Persistent private capital outflows from China since June 2014 have led to two different narratives. One tells a story of investors selling mainland assets en masse; the other of Chinese firms paying down their dollar debt. Our analysis favours the second view, but also points to what both narratives miss - the shrinkage of offshore renminbi deposits.
Our approach, presented in the September 2015 BIS Quarterly Review, starts from the BIS international banking statistics reported by banks outside China. This contrasts with other analyses which typically take changes in official foreign reserves (plus current account surplus) as capital outflows, which require complicated estimation of valuation and other adjustments. To understand the cross-border outflow of capital in the BIS data, we follow the money from declining offshore renminbi deposits in East Asia and declining foreign currency loans at banks in mainland China, as reported by the People's Bank of China (PBoC). In addition, we exclude from the BIS data PBoC deposits with overseas banks, using new data consistent with the IMF's special data dissemination standard (SDDS).
We start with a record $175 billion net decline in BIS reporting banks' cross-border loans to China in Q3 2015 (Graph A, left-hand panel, red line), almost double the outflow in Q1. It reflected both a sharp decline in loans to China and continued growth in liabilities to China (ie China's cross-border deposits). The new SDDS data show that $12 billion of this Q3 outflow was due to an increase in Chinese official foreign exchange reserves deposited at banks located outside China (a capital outflow). That leaves $163 billion of non-reserve outflows to be accounted for. National and BIS data suggest that these outflows through BIS reporting banks reflected a reduction of (i) renminbi deposits offshore, (ii) net dollar debt of Chinese firms cross-border and (iii) their net debt within China.
(i) Offshore, as firms and households reduced renminbi deposits, banks outside China in turn reduced their cross-border renminbi deposits with mainland banks. In particular, banks in Chinese Taipei, Hong Kong SAR, Korea, Macao SAR and Singapore reported a $40 billion equivalent decline in renminbi deposits in Q3 2015, which was associated with depreciation in the renminbi/dollar rate (Graph A, centre panel). In response to lower demand for renminbi deposits, banks in these and other jurisdictions drew down their cross-border renminbi deposits with mainland banks, leading to a capital outflow of $80 billion (PBoC data) that amounts to half of the $163 billion outflow.
(ii) BIS data show that firms in China reduced their cross-border net debt (Graph A, left-hand panel, blue line). The share of this in currencies other than the renminbi, mostly the dollar, amounted to $34 billion (directly included in the $163 billion).
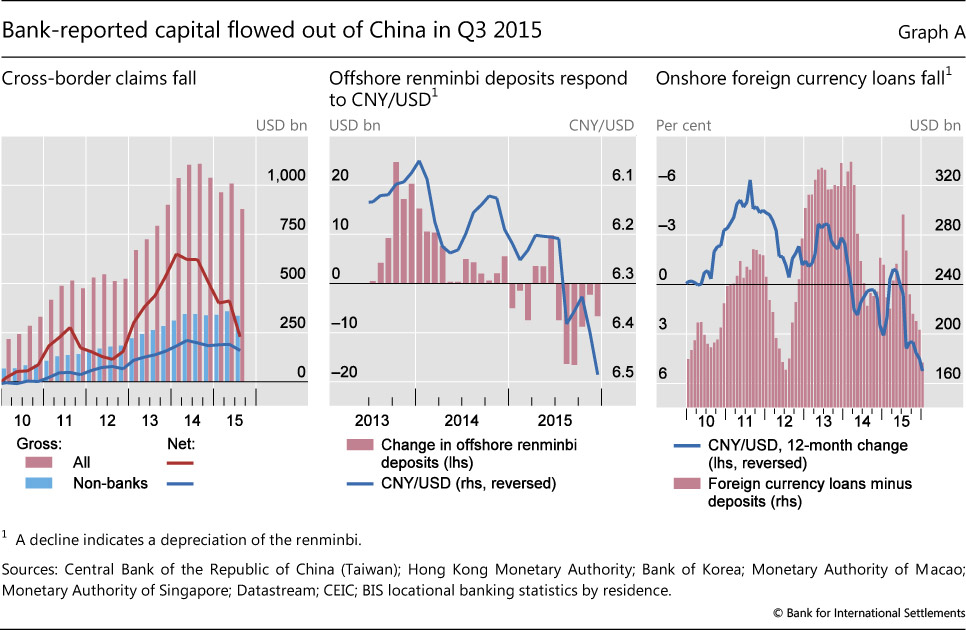
(iii) Within China, firms' reduction in net foreign currency loans from mainland banks led these banks in turn to reduce cross-border net liabilities in Q3 2015 (a capital outflow). PBoC data show that firms reduced their net foreign currency debt to banks in China by $7 billion in Q3 (Graph A, right-hand panel). If mainland banks squared their position with BIS reporting banks outside China, this would have contributed to the $163 billion outflow.
Overall, reduction of renminbi holdings offshore ($80 billion), and Chinese firms' net repayment of foreign currency debts cross-border ($34 billion) and within China ($7 billion), amounted to $121 billion. This can account for almost three quarters of the non-reserve outflows of $163 billion revealed by the BIS banking data.
Partial data suggest that outflows from China continued in Q4 2015. The rundown of renminbi deposits offshore slowed, judging from both partner data (Graph A, centre panel) and the PBoC-reported renminbi deposits (down $24 billion, versus $80 billion in Q3). However, Hong Kong Monetary Authority data on cross-border claims on Chinese non-banks (close to 40% of the BIS total) for October and November show an acceleration of net outflows. In addition, onshore net foreign currency loans contracted faster, at $29 billion (vs $7 billion in Q3).
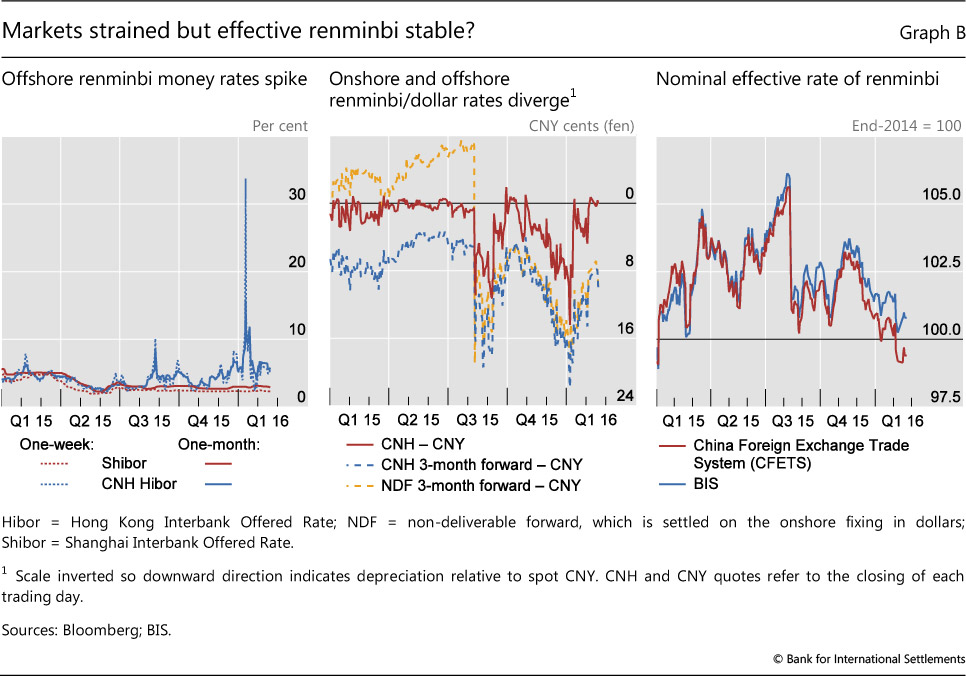
Q1 2016 price developments suggest greater strains than in the second half of 2015, with associated incentives for fund outflows. Many market participants interpreted the PBoC's management of the exchange rate in early January as signalling an intended depreciation against the dollar, and offshore interest rates briefly surged to levels exceeding those in August-September (Graph B, left-hand panel). Onshore and offshore spot rates diverged more than in Q3, and offshore forwards pointed to a sharper depreciation (Graph B, centre panel).
 And yet, this volatility in money market and bilateral exchange rates contrasted with the renminbi's limited fluctuation against a basket of trading partner currencies (Graph B, right-hand panel). To recap, our analysis suggests that recent outflows from China can be explained, to a large extent, by continued shrinkage of the offshore renminbi market and Chinese firms' paydown of net foreign currency debt. The PBoC's declared intention to keep the renminbi stable in effective terms would imply a weaker renminbi against the dollar were the dollar to appreciate against major currencies. In this event, offshore depositors might not hold onto maturing renminbi deposits and Chinese firms would still have reason to repay dollar-denominated debt.
See R McCauley, "Capital flowed out of China through BIS reporting banks in Q1 2015", BIS Quarterly Review, September 2015, pp 28-9. Spot CNY/CNH gapped to CNY 14 cents (fen) on 6 January 2016, above the Q3 2015 high (11 fen) and close to 2010's alltime high of 15 in M Funke, C Shu, X Q Cheng and S Eraslan, "Assessing the CNH-CNY pricing differential", Journal of International Money and Finance, vol 59, 2015, p 250. In the forward market, the CNH and NDF markets priced in 2.5% and 3% depreciation over three months, compared with 0.7% in the CNY market. As foreseen in R McCauley, C Shu and G Ma, "Non-deliverable forwards: 2013 and beyond", BIS Quarterly Review, March 2014, pp 75-88, NDF forwards have fallen to only half of forwards in the April 2015 Bank of England data from ¾ in 2013.
Box 2
Early warning indicators
The BIS has analysed and monitored early warning indicators of domestic banking distress. These indicators capture financial overheating and signal potential banking distress over medium-term horizons. They are calibrated with reference to the signal-to-noise ratio, defined roughly as the ratio of correctly predicted historical episodes to false alarms.
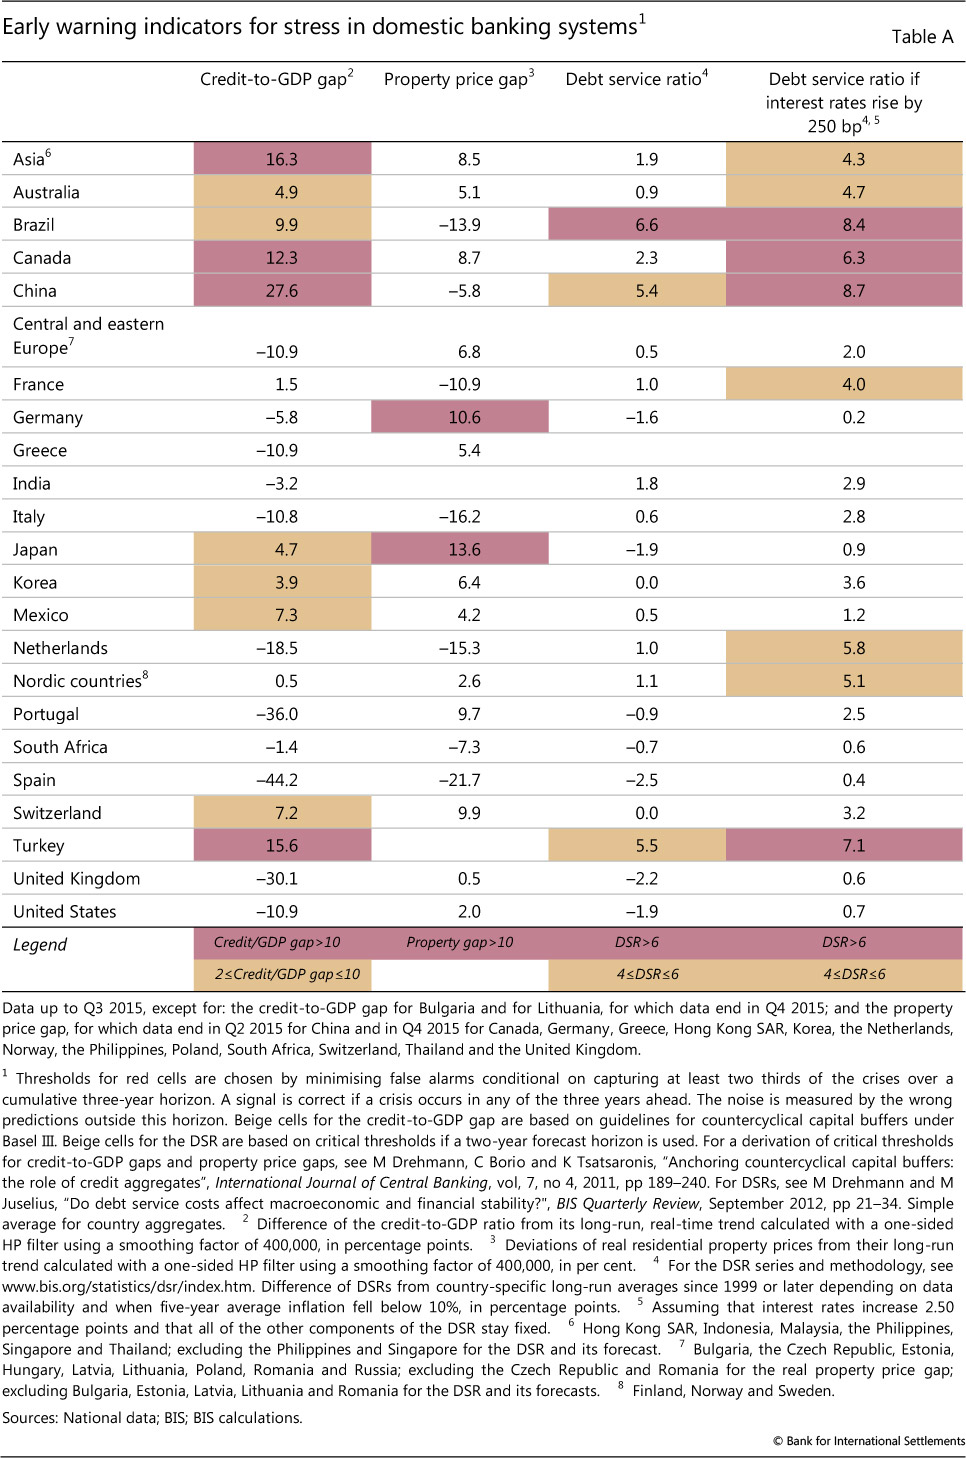
Table A reports three indicators, measured in most cases as of Q3 2015. The first is the gap between the credit-to-GDP ratio and its long-term trend (first column). The second is the gap between the residential property price index and its long-term trend (second column). The last one is the difference between the debt service ratio (DSR) and its average over time. It is estimated under two different assumptions (third and fourth columns): one under current interest rates, the second at rates that are 250 basis points higher. Importantly, this second estimate assumes an immediate and full (100%) pass-through of interest rate changes into DSRs. It does not take account of the fact that many debt contracts are based on fixed rates and will not reprice immediately. Nor does it reflect the ways in which borrowers and lenders would respond to interest rate movements by changing debt maturities, repaying their obligations or other measures. As such it overestimates the impact.
All three indicators suggest that the risk of banking strains remains elevated in a number of economies and regions. This is in particular the case for Canada, China and Turkey, where the credit-to-GDP gaps are above 10%. The same is true for a grouping of Asian economies (Hong Kong SAR, Indonesia, Malaysia, the Philippines, Singapore and Thailand). The indicator for Brazil, after having been persistently above this threshold for quite some time, at 9.9%, is just below this level. In the past, two thirds of all readings above this threshold were followed by serious banking strains in the subsequent three years. The DSR-based indicators also point to several of these economies. The size of the property price gap is closer to historical trends for most of the economies listed, although Germany and Japan stand out. When assessing these indicators, it is important to consider that they do not explicitly take into account any strengthening of regulation since the previous episodes of stress.
See "Highlights of global financing flows", BIS Quarterly Review, September 2015, pp 33-4. See M Drehmann, C Borio and K Tsatsaronis, "Anchoring countercyclical capital buffers: the role of credit aggregates", International Journal of Central Banking, vol 7, no 4, December 2011, pp 189-240.
1 This article was prepared by Ben Cohen (ben.cohen@bis.org), Cathérine Koch (Catherine.Koch@bis.org) and Gianpaolo Parise (gianpaolo.parise@bis.org). Statistical support was provided by Kristina Bektyakova, Bat-el Berger and Anamaria Illes.
2 International bank claims are the sum of banks' cross-border claims and their local claims in foreign currencies.
3 International debt securities are bonds and money market instruments issued outside the borrower's home market.
4 The top and bottom panels of Graph 1 are not strictly comparable. In the top panel, bank credit is measured on a residence basis, analogously to balance of payments figures. The bottom panel tracks debt securities issued on international markets, some of which may nevertheless have been purchased by residents. There is some overlap, since banks hold substantial amounts of international securities in their portfolios.
5 These aggregates, as well as those illustrated in Graphs 2, 3 and 5, are part of the GLIs tracked by the BIS. Further information on the GLIs is available at http://www.bis.org/statistics/gli.htm.
6 The GLIs build on Committee on the Global Financial System, "Global liquidity - concept, measurement and policy implications", CGFS Publications, no 45, November 2011 (http://www.bis.org/publ/cgfs45.htm). Data, analysis and research on global liquidity can be found on the BIS website at http://www.bis.org/statistics/gli.htm.
7 These figures are drawn from the BIS locational banking statistics (LBS), which are structured according to the location of banking offices and capture the activity of all internationally active banking offices in the reporting country regardless of the nationality of the parent bank. Banks record their positions on an unconsolidated basis, including those vis-à-vis their own offices in other countries. Quarterly changes in outstanding amounts are adjusted for the impact of exchange rate movements between the ends of the respective quarters and for methodological breaks in the data series.
8 International claims in consolidated banking statistics (CBS) capture cross-border claims and local claims in foreign currency data, and are not adjusted for exchange rate changes.
9 For further details, see C Koch, "Foreign bank lending to China", BIS Quarterly Review, December 2015, pp 18-19.