I. Covid and beyond

![]() Watch the video (00:01:51)
Watch the video (00:01:51)
with Agustín Carstens, General Manager of the BIS
Listen to the podcast (00:17:26)
with Agustín Carstens
Key takeaways
- The global recession was deep, but ended sooner than expected, aided by considerable policy support. The recovery has been uneven; some countries and sectors returned to pre-pandemic growth paths, while others lagged. Meanwhile, financial conditions have remained exceptionally accommodative.
- The next stage of the pandemic will involve different, but no less formidable, challenges. As the rollout of vaccines and improved treatments help countries manage the pandemic, its enduring consequences for economic reallocation and work practices will become increasingly apparent.
- Upside and downside risks to growth loom large. Enormous fiscal stimulus and the drawdown of accumulated household savings could deliver stronger growth and higher inflation; but growth could disappoint and business credit losses mount if the virus is not controlled.
- In the near term, diverging economic conditions could pose policy challenges for emerging market economies. Further out, a key task will be to lay a solid foundation for the recovery to allow for policy normalisation and to manage any tensions that might arise between fiscal and monetary policy.
The battle against the Covid-19 pandemic shaped economic and financial developments over the past 12 months. In most countries, the recovery from the first wave of the virus was stronger, and the financial consequences less persistent, than initially feared. But with the virus continuing to spread, the recovery has been markedly uneven across countries and sectors. Ample policy support has shielded firms from the worst consequences of the downturn, helping to ease financial conditions but also supporting buoyant asset prices, which in some cases have been hard to justify given economic conditions.
In the coming year, it seems likely that many countries will gradually bring the virus under control. This will usher in a new phase of the pandemic involving different, but no less formidable, challenges. While the ebb and flow of infections will continue to influence economic conditions, the frequency and severity of lockdowns should ease. Instead, issues such as potential corporate credit losses and capital and labour reallocation will come to the fore. In advanced economies (AEs), fiscal stimulus should facilitate the financial and economic transition and hasten the recovery. But less policy support is likely in most emerging market economies (EMEs). While EMEs will benefit from increased export demand as the recovery in AEs consolidates, they could also face additional headwinds should global financial conditions tighten. The whole world entered the crisis suddenly and as one; the exit is proving slower and staggered.
In the near term, the need to assist firms and households affected by the pandemic will remain a key policy objective. The nature of policy assistance needs to evolve, however, as broad-based support measures give way to more targeted programmes. Differences across countries in the strength and timing of the recovery could lead to a divergence in policy settings and pose a challenge for policymakers in countries where growth is lagging. Meanwhile, it will be important for policymakers to keep long-term objectives in mind. Key among these is ensuring a solid foundation for sustainable growth to allow policy to be normalised and reaffirming clear boundaries between monetary and fiscal policies.
This chapter reviews economic and financial conditions over the past year. It then discusses the key economic and financial challenges that are likely to arise in the next stage of the pandemic and lays out scenarios for how they might evolve. Finally, it elaborates on the near- and long-term policy challenges.
The year in retrospect
An incomplete recovery
Many of the key forces that shaped economic developments over the past 12 months were already apparent a year ago.1 At the time of last year's Annual Economic Report, the world was in the midst of a historically large and synchronised recession. Unprecedented joint monetary and fiscal policy support had been deployed, although it was unclear how effective it would be or how long it could be sustained.2 There was widespread anticipation of scarring to broad swathes of the economy including firms, households and global trade. There were concerns about the lingering impact of insolvencies, persistent shifts in consumption patterns and shrinking global value chains. Some vaccines were already being developed but their effectiveness was unproven. The duration of the pandemic was also highly uncertain; early estimates ranged from a single wave lasting a few months to a much more prolonged process.
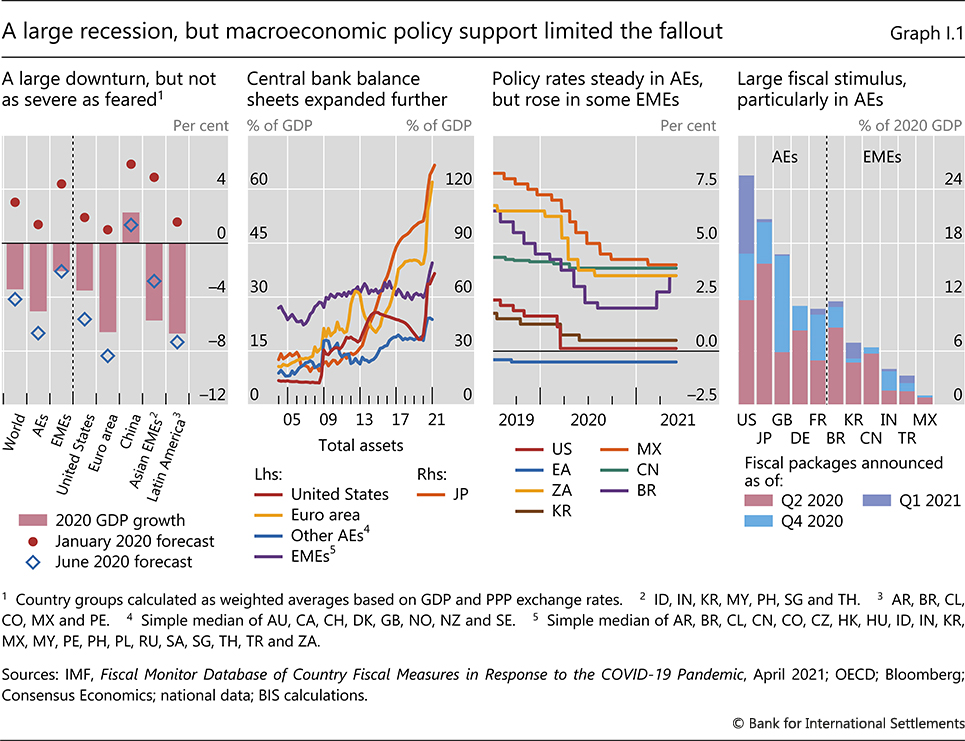
The recession was certainly deep, but the rebound was stronger than forecasters had predicted. The second quarter of 2020 saw the biggest quarterly contraction in global economic activity since the Second World War. However, for the year as a whole, the GDP drop amounted to only 3.4% – a dire outcome in any normal year, but considerably better than projected at the height of the crisis (Graph I.1, first panel).
Macroeconomic policy support, which was even more extensive than anticipated, limited the fallout. After acting decisively to pre-empt severe disruptions to credit intermediation and preserve market functioning at the onset of the pandemic, in the period under review central banks provided further stimulus to aid the recovery.3 In AEs they maintained, and in some cases expanded, asset purchase programmes (Graph I.1, second panel). Some also made greater use of forward guidance, in the case of the Federal Reserve as part of a revised monetary policy framework. In EMEs, central bank actions reflected varying economic forces. Some EME central banks lowered policy rates further; others, such as those of Brazil and Turkey, tightened in early 2021 in response to rising inflation (third panel). Several EME central banks also launched asset purchase programmes for the first time, generally to stabilise markets. In time, most EME central banks were able to weather the furious storm of March and April 2020.
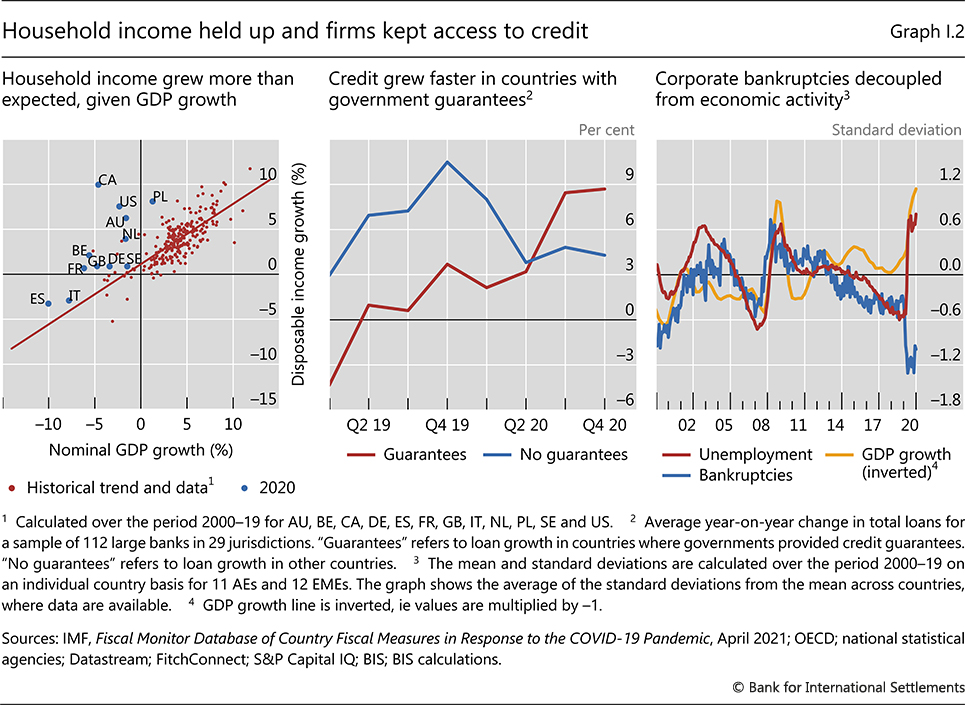
Unprecedented and timely global fiscal stimulus further supported demand, breaking patterns that have become well established in previous recessions. Particularly in AEs, fiscal expansion continued after the initial pandemic shock (Graph I.1, fourth panel). In a number of countries, the packages amounted to more than 10% of GDP. In AEs, household income greatly benefited from fiscal transfers, expanded unemployment benefits and furlough schemes. In a number of cases, household disposable income actually rose in 2020 – sometimes exceptionally fast (Graph I.2, left-hand panel). For firms, government debt guarantees, debt moratoriums and other direct support measures helped ensure ample credit supply, counterbalancing a dramatic fall in revenue (centre panel).
Partly as a result, the anticipated wave of corporate insolvencies did not materialise. In fact, business bankruptcies fell in many countries. This coincided with a significant break in the previously close relationship between bankruptcies and economic activity (Graph I.2, right-hand panel).4
The impact of the crisis on households was less persistent than initially feared. When lockdowns eased in many countries in the third quarter of 2020, spending made up much of its lost ground (Graph I.3, left-hand panel). The lingering weakness in some forms of consumption, notably recreation services, probably reflected constraints rather than enduring shifts in consumer preferences. Indeed, in countries that saw only a single large infection wave, spending on services such as restaurants returned close to pre-pandemic levels (centre panel). At the same time, the pandemic reinforced previous trends in consumption patterns. In particular, the shift to online retailing gathered pace, regardless of whether countries experienced multiple waves of infection. These changes in consumer behaviour also helped insulate economic activity from containment measures. As a result, lockdowns led to much smaller declines in economic activity in early 2021 than they had earlier in the pandemic.5
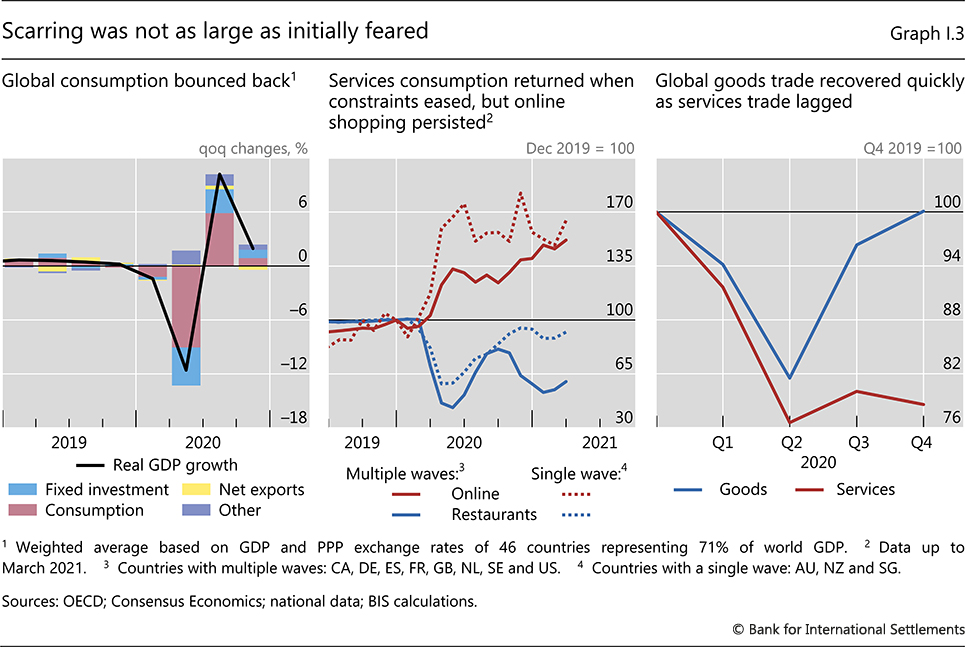
Concerns that the pandemic would deal a lasting blow to global economic integration also proved overly pessimistic. Goods trade rebounded strongly after contracting by nearly 20% early in the first half of 2020 when supply disruptions had wreaked havoc on production networks (Graph I.3, right-hand panel). When supply pressures reappeared in early 2021, they reflected robust demand for goods such as electronic equipment and motor vehicles rather than disruptions to global value chains (GVCs). Services trade, however, did not recover. Cross-border tourism was hard hit, with international air travel declining by 74% in 2020.6
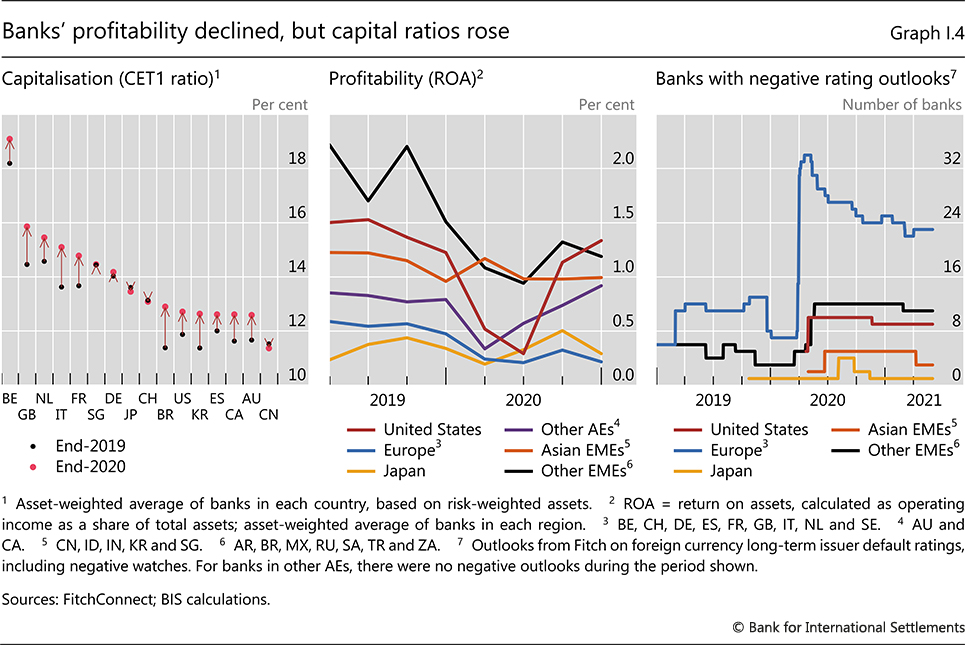
Banks weathered the recession surprisingly well. Most had entered the pandemic with relatively strong balance sheets, in large part owing to post-Great Financial Crisis (GFC) regulatory reforms. Low insolvency rates meant that the hit to asset quality was contained relative to the sharp drop in GDP. Indeed, bank capitalisation increased in many countries in 2020, in part due to restrictions on shareholder payouts and greater flexibility in classifying loans and applying regulations (Graph I.4, left-hand panel). After declining early in the pandemic because of increased provisions against expected losses, bank profitability recovered in the United States and some smaller AEs, although it remained low in Europe and Japan (centre panel). The number of banks with negative rating outlooks also remained elevated, particularly in Europe and EMEs outside Asia. This reflected the uncertain outlook for corporate insolvencies as well as the persistent challenges to bank profitability from low interest rates and competition from technology firms (right-hand panel).
Although the recession turned out to be less severe than initially feared, the recovery has been incomplete. GDP has remained well below pre-pandemic expectations, which admittedly were unusually strong given the length of the previous economic expansion (Graph I.5, left-hand panel). Labour market conditions have deteriorated markedly since the start of the pandemic. And higher unemployment rates tell only part of the story (centre panel). Labour force participation rates have declined substantially in some countries. In Europe, where furlough and part-time work schemes averted large rises in unemployment, the deterioration is visible in shorter working hours. In some countries, enrolment in these schemes – intended initially as a temporary measure – has remained well above pre-pandemic levels (right-hand panel).

The pace and extent of the recovery differed markedly across countries. China, the first economy to enter recession, rebounded quickly. It grew by 2.3% in 2020, on the back of strong business fixed investment and export demand. In turn, China's economic recovery lifted growth in some East Asian EMEs through GVCs. Meanwhile, in the United States a consumption-led bounceback in the second half of the year, supported by a residential construction boom and strong growth in information technology investment, limited the contraction in 2020 to 3.5%. In both China and the United States, the vigorous growth momentum extended into 2021.
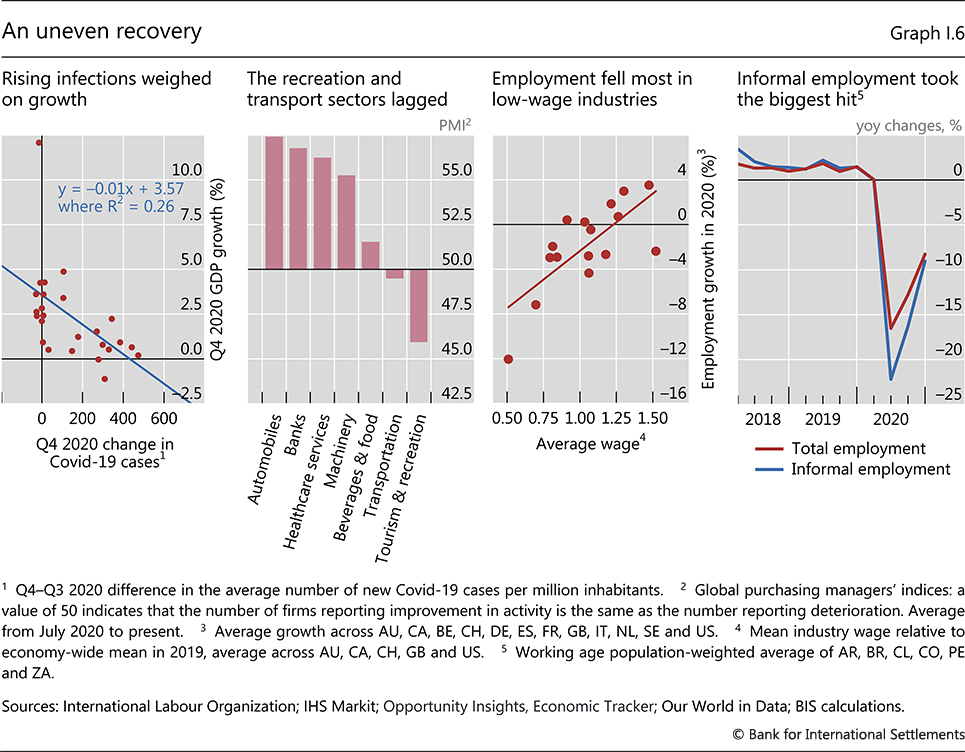
In other countries, however, the initial recovery lost steam. In the euro area, in particular, economic activity declined by 6.6% in 2020 and contracted further in the first quarter of 2021, as new waves of infection led to renewed lockdowns. Growth also slowed in other AEs that experienced multiple infection waves (Graph I.6, first panel).
EMEs in Latin America, Africa and parts of Asia faced particularly challenging conditions. In many of these countries, the structure of economic activity is less suited to remote working and social distancing, constraining their ability to contain the virus, which at times overwhelmed local health services. Early in the crisis, expansionary policy, in some countries alongside remittances, cushioned the initial drop in activity. However, there was little additional fiscal stimulus from mid-2020, in most cases reflecting diminished policy space.
The recovery was also uneven at a sectoral level due to the pattern of containment measures. In most countries, sectors such as manufacturing and construction bounced back rapidly after lockdowns were relaxed (Graph I.6, second panel). By contrast, customer-facing service industries lagged badly. Unsurprisingly, these typically labour-intensive low-wage sectors saw by far the largest job losses (third panel).7 In EMEs, the informal sector suffered most (fourth panel).
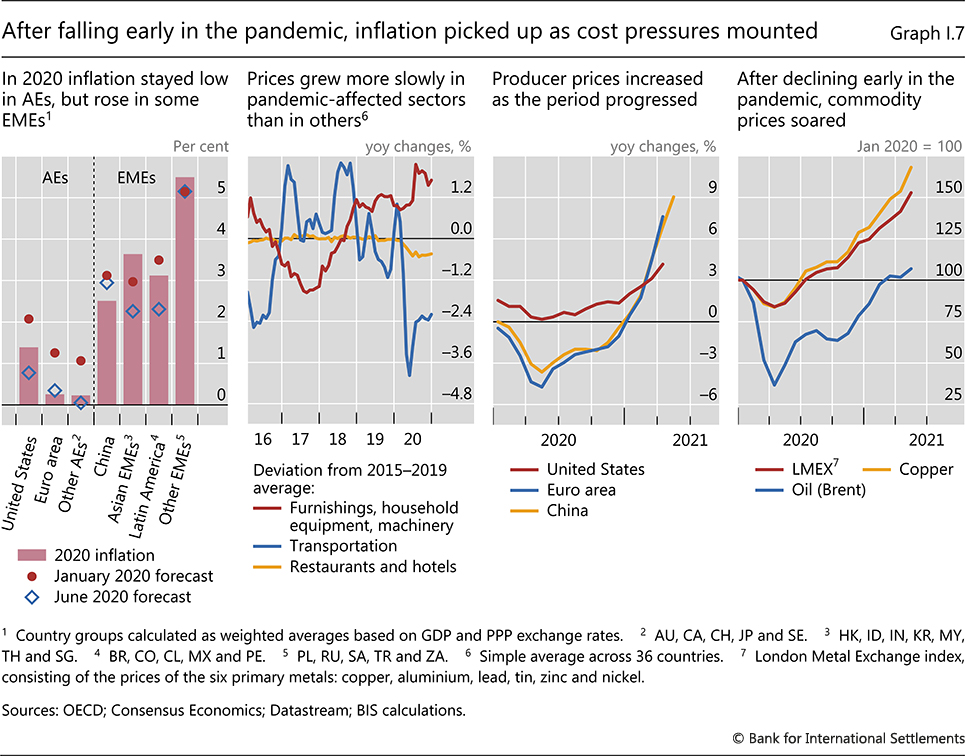
The disinflationary effects of the pandemic continued through 2020 (Graph I.7, first panel). Lower aggregate demand, weaker labour markets and firms' cost-cutting more than offset supply constraints. Slower price increases early in the pandemic in service industries, such as transport and recreation, were only partly offset by stronger ones in the durable goods sector, which actually saw higher demand during lockdowns (second panel). Low inflation in China also reverberated through other economies due to the country's large role in global trade.
As the period under review progressed, however, supply pressures strengthened substantially and inflation picked up. After declining early in the pandemic, PPI inflation trended firmly upwards in several economies, most notably China, paralleling a steady recovery in commodity prices (Graph I.7, third and fourth panels). In conjunction with exchange rate depreciations, this led to higher inflation in a number of large EMEs. Inflation also rose in most AEs and in some cases exceeded central bank targets. As well as higher commodity prices, a rebound in the prices of items such as airfares and hotels, which had fallen sharply early in the pandemic, contributed to increased inflation in these countries.
Exceptionally accommodative financial conditions
The economic recovery went hand in hand with exceptionally accommodative financial conditions. Expectations that very easy monetary policy settings would be sustained, together with unprecedented fiscal expansions that improved economic prospects and supported corporate solvency, were instrumental in reducing business funding costs and compressing risk premia. While public interventions sustained asset valuations, risky assets appeared expensive even after accounting for the level of interest rates. Starting in early 2021, rapidly improving economic forecasts led to a sharp rise in sovereign yields in AEs that then spilled over to EME yields. On balance, however, financial conditions remained very supportive from a historical perspective, including in most EMEs.
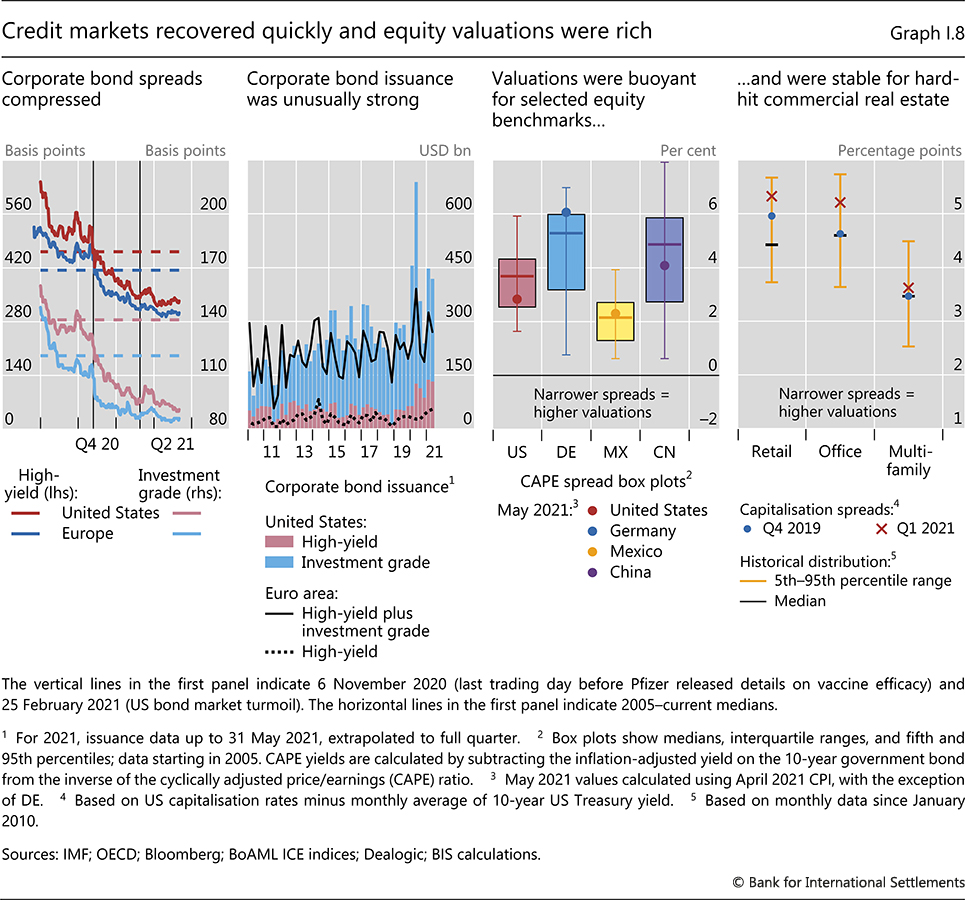
With accommodative policies in place, businesses were able to access finance on very favourable terms. Credit spreads were compressed through mid-2021, even for low-rated firms, falling well below historical averages (Graph I.8, first panel). Following a sharp increase in mid-2020, not least thanks to central banks' asset purchases and liquidity facilities, corporate bond issuance remained exceptionally buoyant into the first quarter of 2021, even reaching record highs in the US high-yield segment (second panel). The prices of funds investing in loans to small risky firms also soared in late 2020, exceeding pre-pandemic levels in early 2021.
Strong risk appetite sustained valuations in equity and real estate markets. Even after accounting for the very low level of interest rates, stocks appeared expensive in the United States and China, although less so in other markets (Graph I.8, third panel). Positive sentiment was also apparent in the steep increase in capital raised through initial public offerings and special purpose acquisition companies, which echoed the rush to public markets seen in the late 1990s tech boom. While commercial real estate (CRE) prices had fallen markedly early in the pandemic, proxies for risk premia remained low. In the United States, the difference between CRE rental yields (also known as capitalisation rates) and Treasury yields – often interpreted as a valuation measure – was at the same level in the first quarter of 2021 as it had been in late 2019, even for the pandemic-hit retail sector (fourth panel). Moreover, although office building valuations fell, they remained well above post-GFC lows. In the meantime, and unusually for a recession, house prices rose sharply in many countries (Box I.A).
Positive vaccine news and an unprecedented fiscal expansion underpinned buoyant sentiment in equity markets. Global stock prices started rising in November 2020 on favourable vaccine trial results, even though they remained sensitive to the evolution of infection rates and delays in vaccine availability. In conjunction with very accommodative monetary policy, an extraordinary increase in government expenditure, especially in the United States, provided crucial support to risky assets in 2021 (Graph I.9, first panel). As US fiscal legislation neared its approval, volatility rose alongside higher sovereign yields in late February. The rise in EME equities also lost steam at this time on concerns of negative spillovers from higher AE yields. Chinese stocks experienced particularly large losses, which they had yet to recoup by June, partly due to policy efforts aimed at curbing credit growth.
As the period unfolded, sovereign yields started to rise. The brightening economic outlook, sustained by positive vaccine news, fiscal expansion and continued monetary accommodation, bolstered a "reflation trade". At first, the steady increase in US bond yields reflected higher market-based inflation expectations (Box I.B). Subsequently, forecasts of buoyant US economic growth, supported by exceptional US fiscal stimulus and a tilt towards longer-dated sovereign issuance, lifted long-term yields (Graph I.9, second panel). The reflation trade appeared to ease somewhat in April, even as macroeconomic forecasts improved. Reportedly, increased demand from international investors was partly responsible. Indeed, by the end of March 2021 US Treasury yields hedged into euro and yen had risen to the highest levels in years, becoming particularly attractive to investors from those jurisdictions.
The reflation trade in AEs spilled over to EMEs. Starting in February 2021, local currency EME yields jumped (Graph I.9, second panel). Improving growth expectations in AEs had positive effects on EMEs thanks to rising exports and commodity prices. In many EMEs, however, higher AE yields exacerbated vulnerabilities stemming from a combination of slow vaccination rates, rising contagion rates, surging public debt levels and structural economic weakness that preceded the pandemic. The difficult predicament EMEs faced was visible in the depreciation of their currencies relative to the US dollar in the first quarter of 2021, which was unusual given soaring commodity prices (third panel).
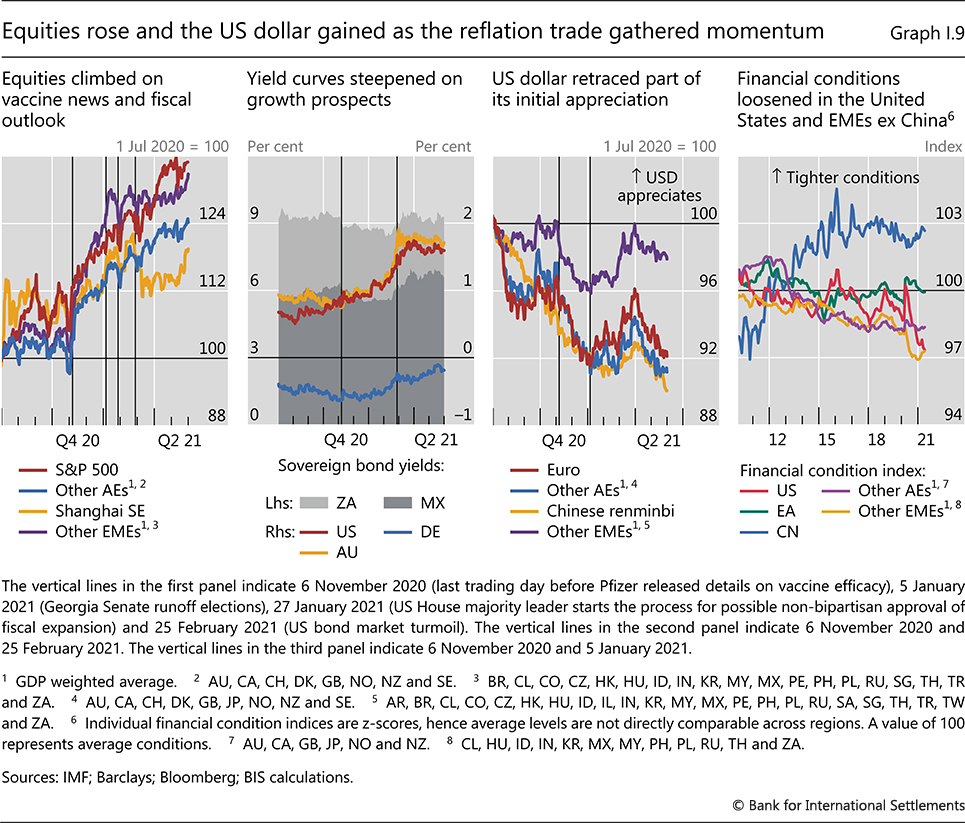
That said, financial conditions in EMEs generally tightened only moderately and remained accommodative on balance (Graph I.9, fourth panel). The tightening effect of higher long-term yields was partly offset by advancing equities. China was an exception and saw financial conditions tighten noticeably, not least due to its domestic policy stance that aimed at containing credit growth. The tightening took place despite buoyant bond fund flows driven by a search for yield and portfolio rebalancing after Chinese bonds were included in international indices.
The next stage of the pandemic
A key goal of policy in the past year was to hold the fabric of the economy together until a path out of the pandemic came into view. While policymakers could do little about the lockdowns' direct impact, wide-ranging policy support limited the fallout. In many countries, support measures were so extensive that the lasting consequences of the pandemic, including shifts in the composition of economic activity, have scarcely begun to be addressed. In this respect, the experience of the past year illustrates the limits as well as the power of stabilisation policy.
The pandemic is now entering a new stage. While the spread of the virus will still constrain economic activity, a wider set of forces will start to shape outcomes. Among the most significant are US fiscal policy, which could have global consequences through trade and financial spillovers, and the behaviour of households, whose "excess savings", if released, could provide a significant impetus to the recovery. The strength of these forces will help determine whether the wave of business insolvencies that failed to materialise last year eventually occurs. Corporate credit losses would, in turn, feed back into broader economic conditions through business investment and the health of the financial sector. Meanwhile, the pandemic's effects on corporate reallocation will become clearer.
How will the global economy evolve as these forces play out over the next year or so? A natural starting point is the central scenario embedded in current economic forecasts and financial market prices, and the corresponding assumptions and policy expectations. However, given the exceptional combination and scale of the forces at work as well as surrounding uncertainty, it is worth exploring how economic conditions could differ if the assumptions behind the central forecast are not realised. Accordingly, what follows contrasts the relatively benign central scenario with two plausible and more challenging alternatives. The range of outcomes provides insights into the considerations that could inform policy.
The central scenario
The central scenario, as embodied in Consensus Forecasts, is for the economic recovery to continue, albeit at varying speeds across countries (Graph I.10, left-hand and centre panels). The pickup in growth should go hand in hand with better labour market conditions. As slack diminishes, inflation is projected to move closer to central bank targets, and in some cases exceed them (right-hand panel). However, with the exception of a few EMEs, inflation overshoots are seen as temporary.
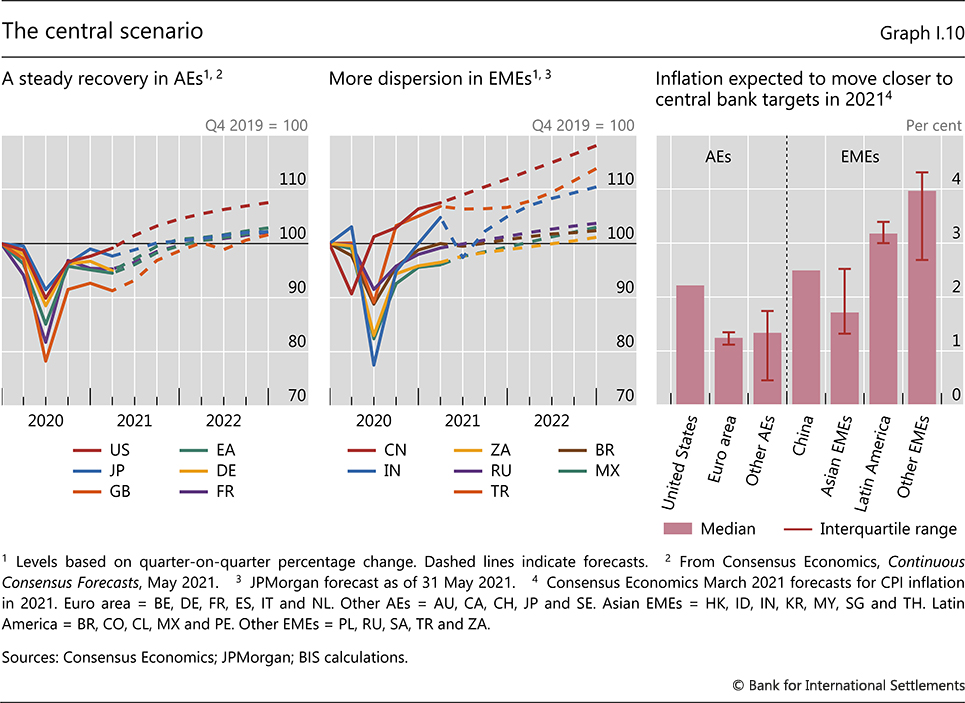
Accommodative fiscal and monetary policy are envisaged to underpin the recovery. Considerable fiscal stimulus remains to be deployed, on top of measures introduced last year, particularly in the United States. Monetary policy is also expected to remain highly expansionary in AEs, where a number of central banks have committed to maintaining their current stance until inflation reaches, or in some cases exceeds, its target. As a result, any tightening in global financial conditions is seen as moderate. However, policy rates could rise in some EMEs to dampen inflation.
Progress in controlling the virus is expected to vary across countries, contributing to the highly uneven recovery. In some AEs, the rollout of vaccines has already drastically reduced infections and mortality rates, raising hopes of a relatively smooth and early "pandexit". Achieving similar gains in countries with lower vaccination rates would require further improvements in treatment methods and more targeted prevention strategies (Box I.C). Thus, the short-term prospects for containing the virus are less bright for many EMEs, particularly outside East Asia.
Alternative scenario 1: higher inflation and tighter financial conditions
In this alternative scenario, inflation in a number of countries exceeds current expectations by enough to bring forward the expected start of monetary policy normalisation and prompt an unexpected and substantial tightening of global financial conditions. Naturally, this scenario involves stronger growth than currently projected. And it is more plausible if the pandemic is tamed more quickly than envisaged.
One reason why growth might surprise on the upside is that fiscal policy could turn out to be more stimulatory than expected. From a global perspective, the impact of the large US stimulus package passed in March 2021 is key, given its size and the United States' influence on economic and financial conditions globally. Additional fiscal stimulus, should it occur, would reinforce these effects.
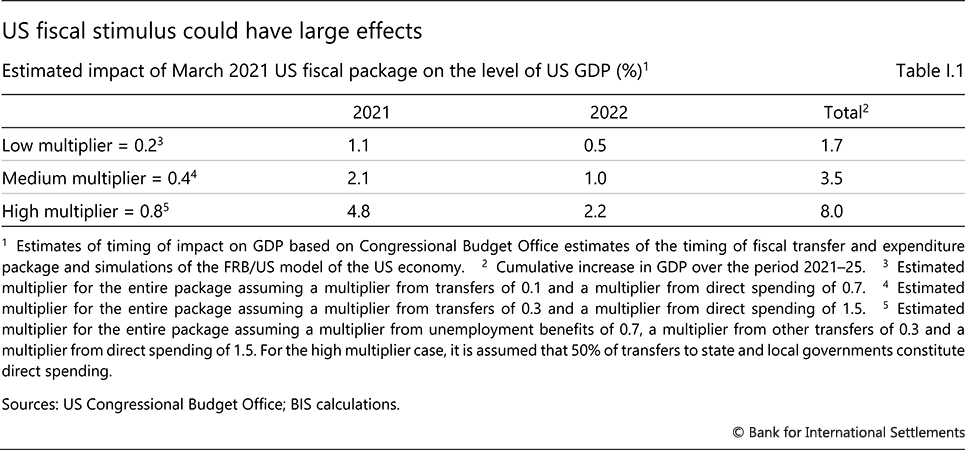
For the United States, the fiscal boost to GDP depends largely on how households respond. Estimates of fiscal multipliers – ie the overall increase in GDP from a $1 increase in stimulus – are imprecise. That said, they are generally thought to be lower for broad-based transfer payments – a large share of the most recent US fiscal package – than for spending targeted at financially constrained households, and to be larger when monetary policy is accommodative.8 To fix ideas, the middle-of-the-road multiplier estimates that inform the central scenario (eg 0.3 for transfers and 1.5 for direct expenditures) imply a boost to the level of US GDP of between 1 and 2% in each of the next two years (Table I.1). But if the multipliers turn out to be closer to the upper end of the range of the estimates, the fiscal impulse could be more than twice as large. Faster growth in the United States will, in turn, boost export demand elsewhere.
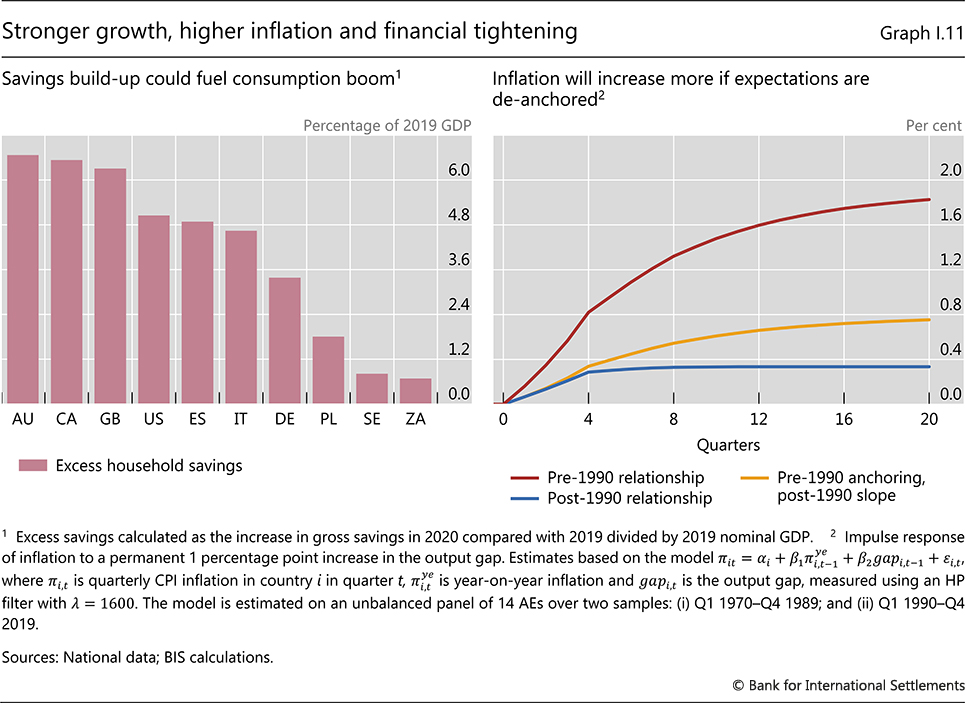
A second possible reason for surprisingly strong growth is that household saving rates in AEs, which increased sharply in 2020, could fall back more quickly than expected. The resulting push to consumption would reinforce the more stimulatory fiscal policy. A trigger for a faster reduction in saving rates could be early control of the pandemic, which would lower uncertainty and cut precautionary saving. Improved labour market conditions and rising house prices could also boost confidence and encourage households to draw down their savings more quickly. Additional saving in 2020 in some AEs was equivalent to over 5% of pre-crisis GDP. Thus, even a small drawdown could materially lift global economic activity (Graph I.11, left-hand panel).
The impact on inflation is harder to assess. There are grounds to believe that any further increase would be limited and temporary. The relationship between inflation and slack has weakened in recent decades: empirical estimates suggest that even very tight economic conditions would prompt only a modest rise (Graph I.11, right-hand panel). Inflation expectations are also better anchored, so that the "second-round" effects of an initial rise in inflation are typically small.9 Moreover, many of the structural factors that have been exerting downward pressure on inflation for a long time and have further dampened second-round effects are still at play. Foremost among these are the globalisation of product and labour markets and technological change, which have reduced the pricing power of labour and many firms.10 The pandemic-induced growth of e-commerce has worked in the same direction.
That said, given the strength of the forces at play in the scenario, one cannot rule out a larger and more sustained increase in inflation. The relationship between inflation and economic slack – the Phillips curve – could turn out to be non-linear, meaning that inflationary pressures rise substantially when spare capacity is sufficiently small.11 Such an outcome would be more likely in this scenario, as the pickup in growth would be synchronous across many countries, so that capacity would come under stronger pressure at the global level. Inflation expectations could also become less well anchored. Already this year, financial market measures of inflation expectations rose quickly in a number of countries as prospects for the US fiscal stimulus firmed (Box I.B).12 Should this foreshadow a more general unmooring, eg so that inflation became as "backward-looking" as prior to 1990, a given reduction in economic slack would deliver twice as much inflation as more recent estimates imply. This would be true even if the response of inflation to economic slack remained low (Graph I.11, right-hand panel).
Even a temporary rise in inflation could deliver a sizeable financial tightening, especially given stretched financial markets. This would be more likely if uncertainty about central banks' response caused financial markets to bring forward the anticipated start of policy normalisation. Such a scenario could lead to a rapid and disorderly unwinding of positions taken on the assumption of persistently easy monetary conditions.
This scenario would play out differently across the world. Jurisdictions where inflation has persistently been below target would welcome its rise as long as financial conditions there did not tighten excessively. By contrast, a tightening could be particularly challenging for EMEs, which are seeing a slower recovery than most AEs. The financial tightening in those economies would be all the more severe should the US dollar appreciate – a likely outcome given that the US economy would be the main source of the growth surprise.
Alternative scenario 2: the recovery stalls, business insolvencies rise
In this scenario, the recovery stalls. As growth slows, business insolvencies, which were remarkably low in 2020 given the state of the global economy, start to rise substantially. The resulting corporate loan losses weaken the financial position of banks, sapping their lending capacity.
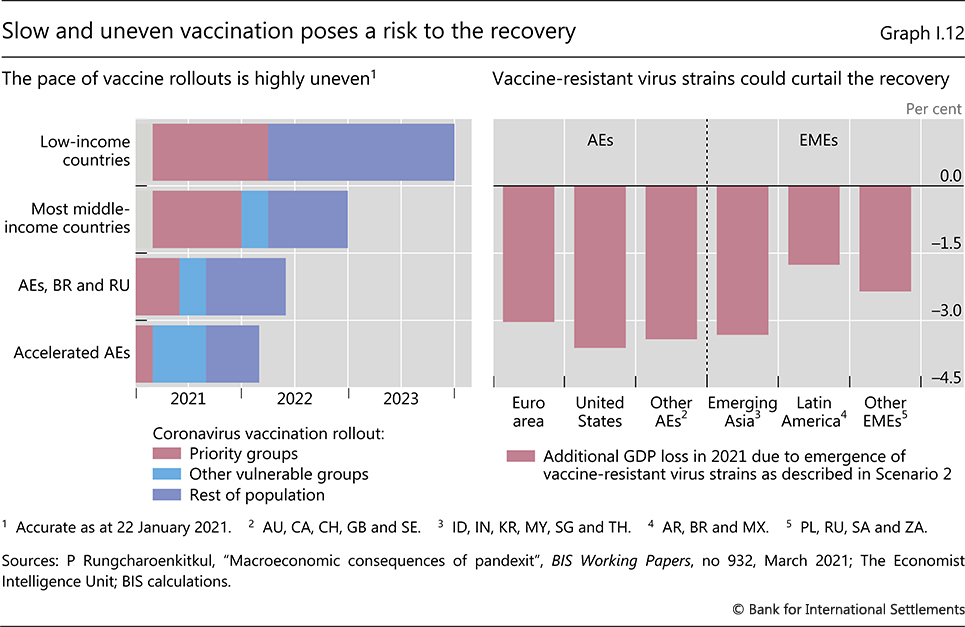
An adverse turn in the pandemic is an obvious trigger for this scenario. A particular risk comes from the emergence and spread of new vaccine-resistant virus strains from countries with high infection rates and slow progress in vaccination (Graph I.12, left-hand panel). Modifying vaccines to cope with these strains would take time, and renewed lockdowns could be required. Based on the historical relationship between infection rates, lockdowns and GDP, the emergence of a vaccine-resistant virus strain could lower GDP by between 1.5% and 3.5% in the second half of 2021, with regions where vaccination has progressed most experiencing the biggest hit to growth (right-hand panel).
Consumption would naturally be lower in this scenario. Renewed lockdowns, weaker labour market conditions and possibly a rise in precautionary saving because of heightened uncertainty would all take their toll.
The boost to growth from fiscal policy could be smaller as well. Subdued consumption would translate into less spending out of fiscal transfers. In the United States, for example, the fiscal impulse would be only half as large as in the central scenario if fiscal multipliers turned out to be near the bottom of the range of estimates. In some countries, investors could start to question fiscal sustainability, which would lower growth further.
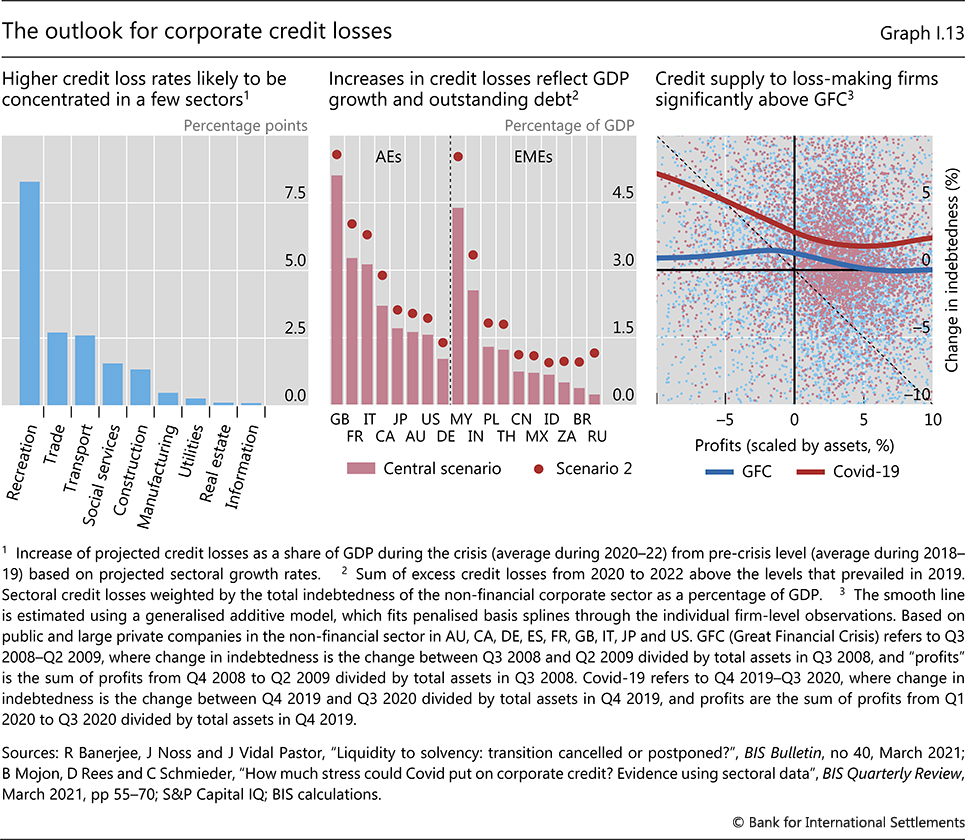
But it is the business sector that would feel the brunt of the damage. Even in the central scenario, credit losses would probably pick up in pandemic-affected sectors from the extremely low 2020 levels (Graph I.13, left-hand panel). In some industries, such as bricks-and-mortar retailing and commercial property, persistent shifts in customer behaviour and work practices could exacerbate losses (Box I.D). That said, so long as the recovery retains some momentum, credit losses seem to be manageable (Box I.E). A renewed downturn, however, would put further pressure on business finances (Graph I.13, centre panel). Corporate balance sheets are more exposed than at the start of the pandemic because of a substantial increase in borrowing, particularly by the least profitable firms (right-hand panel). While ample credit supply helped compensate for rising losses in the early stages of the pandemic and some firms have built sizeable cash reserves, it is unclear whether additional credit would be forthcoming should economic conditions worsen once again.
The adverse effects of rising corporate insolvencies would be magnified through their impact on banks and other financial institutions. Recent stress tests suggest that most banks hold sufficient capital to meet their regulatory requirements even in the face of a severe downturn, at least in AEs.13 However, they also point to a significant hit to capital buffers, which could constrain the supply of credit to healthy firms and dampen business investment. Low bank profitability in an environment of low-for-long interest rates heightens the challenges and could hinder banks' ability to build buffers and raise new capital.14
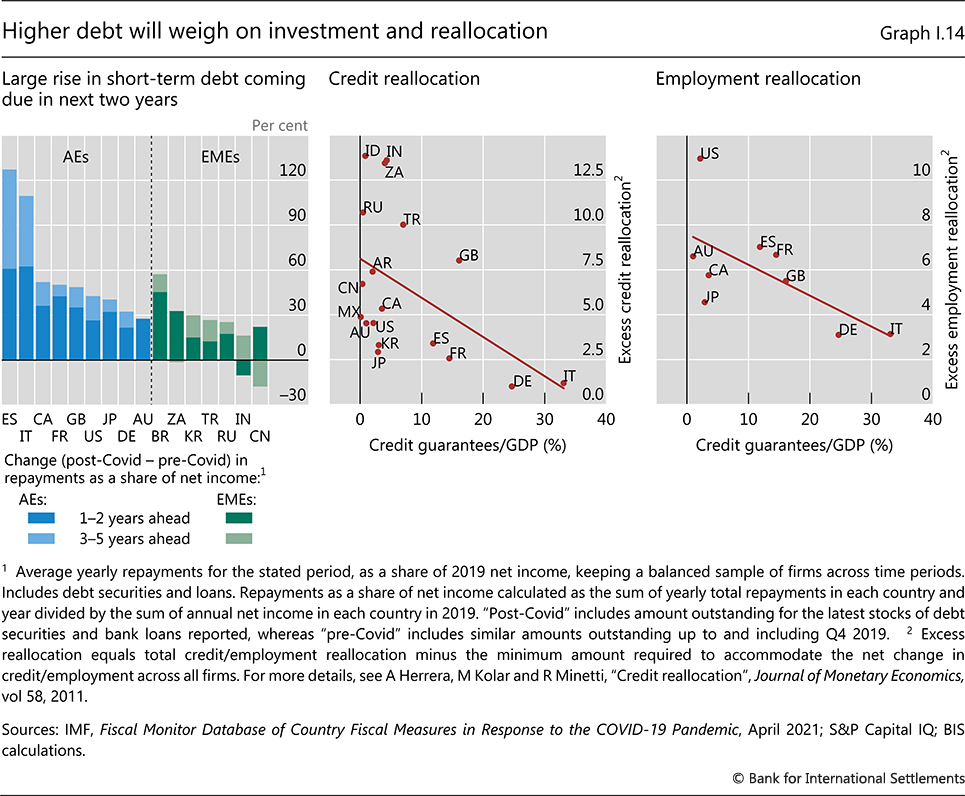
Even if an upsurge in insolvencies does not materialise, firms will have to contend with increased repayment obligations due to the large rise in borrowing early in the pandemic. The value of debt repayments due in the next two years has increased significantly since the start of the pandemic in many AEs and some large EMEs. In some countries it exceeds 50% of firms' net income (Graph I.14, left-hand panel). If debts cannot be rolled over, meeting these repayments will require firms to find ways to lower their costs or cut back on capital investment.15
Constrained financial institutions and highly indebted firms could also delay the required reallocation of resources. Such a reallocation would be more pressing in this scenario, given the persistent changes in consumer behaviour and increased risk of "zombie" firms linked to the sustained downturn. Another factor potentially holding back resource reallocation is blanket business support programmes. Over the past year, countries with larger credit guarantee schemes have seen less reallocation of credit across firms (Graph I.14, centre panel). Larger guarantee schemes have also gone hand in hand with less labour reallocation across firms (right-hand panel). If they constrain resource reallocation to more productive firms, these developments could hold back growth prospects even after lockdowns ease and consumption growth recovers.
This scenario would be more challenging in many respects than the previous one, particularly for EMEs. While global financial conditions would probably remain supportive, policy space in these economies would be stretched if weaker domestic economies and pre-existing vulnerabilities heightened international investors' risk aversion.
General considerations
The scenarios described above point to a number of considerations. First, it is important to limit the spread of Covid-19 globally. Large virus outbreaks are associated with the most adverse economic outcomes, particularly if the solvency of financial institutions comes into question. This speaks to the value of international cooperation in the provision of vaccines and support to health systems when they come under pressure. Second, for some countries economic and financial turbulence could arise despite strong global economic growth. This highlights the need for policymakers to monitor emerging risks closely. Finally, for most countries the legacy of the pandemic will probably be felt long after the virus is brought under control. Corporate and private debt levels will remain high for years to come, and reallocation of capital and labour has barely started. Policymakers will need to take account of these developments when planning their response to evolving economic conditions.
Macroeconomic policy challenges
In the near term, the key macroeconomic policy task is to support the economy through the recovery. The specific policy configuration will depend on the path of economic activity, taking into account the uncertainties involved. In contrast to the early phase of the crisis, large differences in economic conditions across countries will call for a more differentiated approach, which will challenge countries where economic conditions are weaker.
In the longer term, there are two policy prerogatives. The first is to gradually normalise, once conditions allow, to regain space for both monetary and fiscal policy. The second is to manage the relationship between the two policies in an environment in which their implementation would be less interdependent than during the early stages of the pandemic.
Near-term challenges
In the central scenario, the policy challenges would be a natural evolution of those faced over the past year.16 Although the economic recovery has proved stronger than expected, constraints on certain activities persist, and considerable uncertainty surrounds the evolution of the pandemic and its long-term legacy. As a result, following a risk management approach, authorities will need to continue to provide the necessary support while facilitating the required reallocation of resources, even while its extent and precise contours remain unclear. Ensuring that the inevitable policy adjustments in the light of evolving economic conditions are not misinterpreted poses a complex communication challenge.
The recovery, together with the need to preserve precious policy space, suggests that fiscal policy will need to become more targeted. Indeed, in some countries blanket stimulus is already being phased out. In Canada, for example, broad-based wage subsidies have been replaced with hiring subsidies reserved for firms whose revenues have yet to fully recover. As the crisis transitions from its liquidity to its solvency phase, governments are also adjusting policies to better distinguish viable from non-viable businesses in order to facilitate restructuring. In Singapore, for instance, firms are now obliged to resume principal repayments on loans covered by debt moratoriums and give banks more information about their viability.17 At the same time, the high degree of uncertainty rewards flexibility. Trade-offs arise here too. Experience suggests that quickly addressing the debt overhang and cutting any sectoral excess capacity supports sounder recoveries than a gradual approach.18 That said, a surge in firm closures could overwhelm countries' restructuring capacity.
Monetary policy will also need to remain accommodative but, as the recovery progresses, central banks will face a delicate communication challenge. On the one hand, there is the need to provide sufficient reassurance to avoid a market-driven pre-emptive tightening of financial conditions. On the other, emphasising policy predictability poses the risk of constraining central banks, making them unable to adjust promptly if the economy surprises on the upside. In the trade-off, the potential side effects of prolonged and extraordinary monetary accommodation would play a role. Indeed, the continued exceptionally easy financial conditions and unusual buoyancy of house prices have already raised some concerns. In recent months, central banks in Australia, Canada and Switzerland, among others, have highlighted the risks from soaring house prices in statements accompanying their monetary policy decisions, while the Reserve Bank of New Zealand has been tasked with considering the impact of its decisions on house prices when setting policy.19 Central banks have tried to address this dilemma by modifying their forward guidance, playing down the calendar-based aspects and emphasising its dependence on economic conditions.20
Some central banks, however, may have little choice but to tighten. Already in 2021, higher inflation has prompted central banks in Brazil, Russia and Turkey to hike interest rates. Should commodity prices continue to rise or global bond yields resume their climb, other EME central banks could feel compelled to follow suit (Box I.F). That said, not all EMEs are equally exposed to developments abroad. In some East Asian countries, subdued inflation and ample foreign exchange reserves could give central banks more scope to keep policy settings tailored to domestic economic conditions.
Prudential policy faces two challenges. The first is ensuring that banks are sufficiently well capitalised to absorb potential losses. Risks remain, although to date banks have predicated their provisioning decisions on a smooth central scenario, with some banks actually reducing loss provisions in the second half of 2020.21 Hence the active use of heightened monitoring to ensure that banks recognise all impairments and price credit risks correctly. Authorities have also used stress tests to gauge the financial system's sensitivity to tough scenarios, such as a renewed wave of strict lockdowns. The second challenge is helping to contain the build-up of financial imbalances, particularly in housing markets. For instance, in recent months prudential authorities in Canada, the Netherlands and New Zealand have introduced macroprudential measures aimed at cooling the housing market, including tighter loan-to-value limits and higher floors on the interest rates banks use to evaluate mortgage affordability.
One limitation prudential policy will face in addressing the build-up of vulnerabilities is that the current toolkit is not fully fit for purpose. The prudential tools at the command of authorities do not cover many non-bank financial institutions.22 The post-GFC financial reforms targeted primarily banks, insurance companies and market infrastructures, in particular central counterparties (CCPs), but large swathes of the financial system have not seen significant reforms. The asset management industry – the territory of both leveraged and unleveraged players – is the most notable example. It is these institutions that were at the epicentre of the tremors in March 2020 and among which the most recent signs of stress have emerged, including in the cryptocurrency segments.23 A prolonged period of aggressive risk-taking suggests that substantial leverage and liquidity mismatches may hide below the surface. Work is under way in the international community to tackle some of the structural vulnerabilities in this area.24 In the near term, the challenge will be to monitor developments closely and to make sure that the core of the financial system, notably banks and CCPs, remains resilient.
In the first alternative scenario, where growth and inflation exceed expectations and financial conditions tighten, policies may need to be recalibrated. Fiscal authorities could afford to phase out accommodation more quickly, although there is considerable inertia built in to some of the announced initiatives. Prudential policy, meanwhile, could ensure that prudential buffers return to pre-crisis levels faster.
Monetary policy would face the trickiest challenges. A tightening of financial conditions in response to an inflation surprise – most likely in the United States – would put central banks in a delicate position. If a central bank disagreed with the market assessment, it could remain committed to a more accommodative stance and attempt to shape expectations of the economic outlook and its reaction function. This would not necessarily be a smooth process, and bouts of market volatility would be likely so long as investors continued to doubt the central bank's economic projections or commitment to its stated policy trajectory. Communication would be tested even more than in the central scenario. The final outcome would depend on the actual inflation trajectory and the speed with which market expectations adapt.
Spillovers to the rest of the world would raise different issues. Where higher inflation would be welcome given past undershoots of targets, central banks could afford to remain patient. By contrast, more EME central banks than in the central scenario would be under pressure to tighten, especially where currencies dropped and fuelled inflation above tolerable levels. This would further widen the divergence in economic conditions around the world.
In the second alternative scenario, where growth disappoints, even more accommodative policies may be called for. In hindsight, many economies entered the pandemic with more room to provide policy accommodation than had previously been realised, in the case of EMEs facilitated by monetary and financial easing in AEs. However, providing additional stimulus could test policy space in a number of countries. Some may need to reintroduce emergency measures used early last year, such as liquidity provision to financial institutions and support for corporate bond markets, particularly if financial markets seized up. Additional support for businesses may be also required. Again, EMEs would be particularly vulnerable, not least because they have already depleted much of their conventional policy space and the use of unconventional measures there is subject to more constraints – of an economic and political economy nature – than in AEs.
This scenario would also exacerbate the intertemporal trade-offs. By prolonging the duration of exceptionally accommodative monetary policy, it would risk further stoking imbalances in asset prices, particularly in housing markets. A further narrowing of interest rate margins would challenge bank profitability and make it more difficult to rebuild capital. The combination of weak banks, easy financial conditions and low business profitability could see the emergence of more zombie firms, leaving a legacy of lower productivity growth.
Longer-term challenges
Peering further into the future, once the pandemic is left behind and the economy is restored to health, a key challenge will be to reorient policy back towards longer-term objectives. This will involve fostering a sustainable path to stronger growth while at the same time gradually normalising monetary and fiscal policies and dealing effectively with any tension that might arise between the two along that path. In doing so, policymakers will have to contend with the legacy of the pandemic, including much higher public debt, lower interest rates and larger central bank balance sheets.
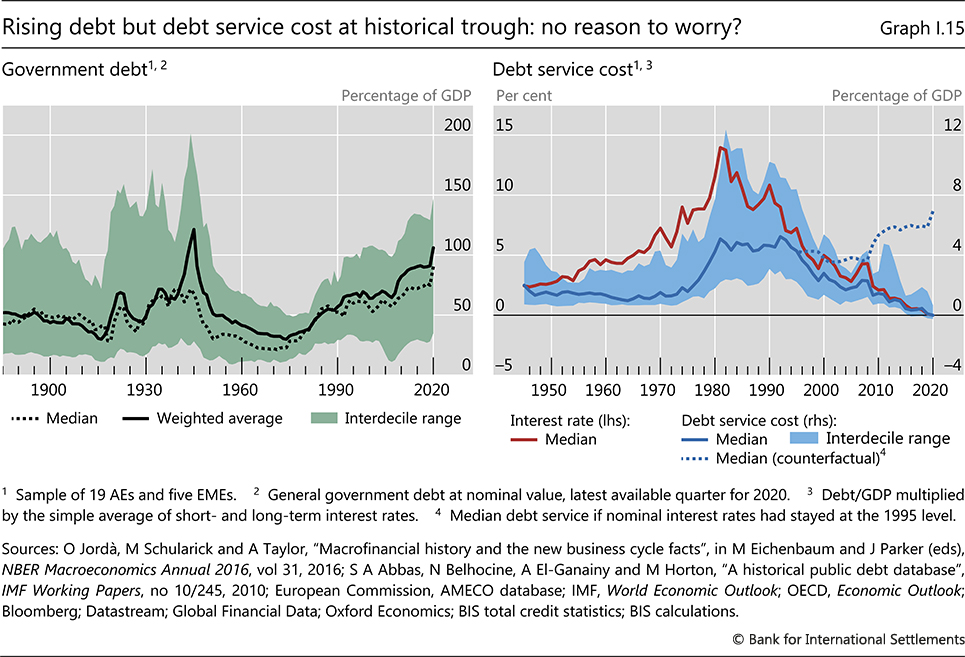
Normalising monetary and fiscal policy over the longer term would provide safety margins to cope with both unexpected and unwelcome developments, such as the current pandemic and inevitable future recessions. The starting point is unprecedented. On the one hand, fiscal expansion has pushed government debttoGDP ratios to levels on a par with, or higher than, those in the aftermath of World War II (Graph I.15, left-hand panel). On the other hand, according to historical records, nominal interest rates have never been so low (right-hand panel). In fact, they are so low that, despite the exceptionally high debt ratios, debt service costs are at historical troughs. The debt burden has never felt so light.
Policy normalisation cannot be taken for granted. The years leading up to the Covid-19 pandemic illustrate the challenges. Pre-pandemic, few central banks had managed to raise policy interest rates from the levels prevailing in the immediate aftermath of the GFC, even in countries that saw a long economic expansion and low unemployment rates. In many AEs, central bank balance sheets grew further, to peacetime highs. Public debt levels generally rose too, before the pandemic pushed them higher still.
One reason why normalisation is so hard is because it involves intertemporal trade-offs. The costs of normalisation, such as generally lower growth and higher unemployment, are immediate and concrete. Its benefits, such as having more room to combat economic downturns, are less tangible and accrue only in the future. Paradoxically, these difficulties are felt most keenly in AEs, where policymakers have greater freedom to delay normalisation to avoid its contractionary effects. In EMEs, where financial markets are typically less tolerant of narrowing policy headroom, the greater risk may be a premature tightening despite a weak economy.
A second reason reflects economic conditions. Ideally, faster growth and a pickup in inflation would support normalisation. But generating sustained inflation has proved surprisingly difficult, especially in AEs, where it has remained stubbornly below targets. While the large fiscal stimulus programmes under way in a number of countries could boost inflation in the years ahead, the evidence indicates that this is more likely in EMEs (Box I.G). Normalisation could be easier for central banks that pay greater attention to output and financial imbalances and that are more willing to tolerate inflation shortfalls providing that longer-run expectations remain anchored. Even so, if inflation fails to pick up, there is a limit to how far central banks can normalise without threatening the credibility of their current inflation objectives. How much inflation will rise on a sustainable basis remains an open question, not least because the longer-term effects of the pandemic on structural forces such as globalisation and technology have yet to play out.
A third reason is that postponing normalisation beyond a certain point may actually make it harder. Keeping monetary policy accommodative to support fiscal consolidation could encourage a further build-up of financial imbalances in the private sector. Given the exceptionally low service burdens, it could also induce further increases in government debt. In both cases, the economy's sensitivity to higher interest rates would rise.
The joint need to normalise monetary and fiscal policies poses specific challenges. Along the path, normalisation in one area could complicate normalisation in the other. Fiscal consolidation would act as a drag on economic activity and inflation, hindering prospects for monetary policy normalisation. Conversely, given increased debt burdens, higher interest rates would increase the size of the required fiscal adjustment. In fact, the interest sensitivity of service costs is already very high. For example, should interest rates return to the levels prevailing in the mid-1990s, when inflation had already been conquered, median service costs would exceed the previous wartime peaks (Graph I.15, right-hand panel).
From this perspective, large-scale central bank purchases of government debt can heighten the interest rate sensitivity of borrowing costs. Considering the consolidated public sector balance sheet, these operations retire long-term government debt from the market and replace it with overnight debt – interest-bearing central bank reserves. Indeed, despite the general tendency for governments to issue at longer maturities, central bank purchases have shortened the effective maturity of public debt. Where central banks have used such purchases more extensively, some 15–45% of public debt in the large AE jurisdictions is in effect overnight.25
One cause for optimism concerning fiscal policy normalisation prospects is that interest rates have been generally below growth rates for some time. Such a favourable configuration sets a ceiling on the ratio of debt to GDP for a given fiscal deficit and means that the ratio will start to decline when deficits are sufficiently small. It can also facilitate an increase in the average duration of public debt, lowering rollover risk in countries where fiscal sustainability is a concern. And indeed, interest rate-growth differentials are very favourable from a longer-term perspective (Graph I.16, left-hand panel), in part because real interest rates have been negative for an exceptionally long time.
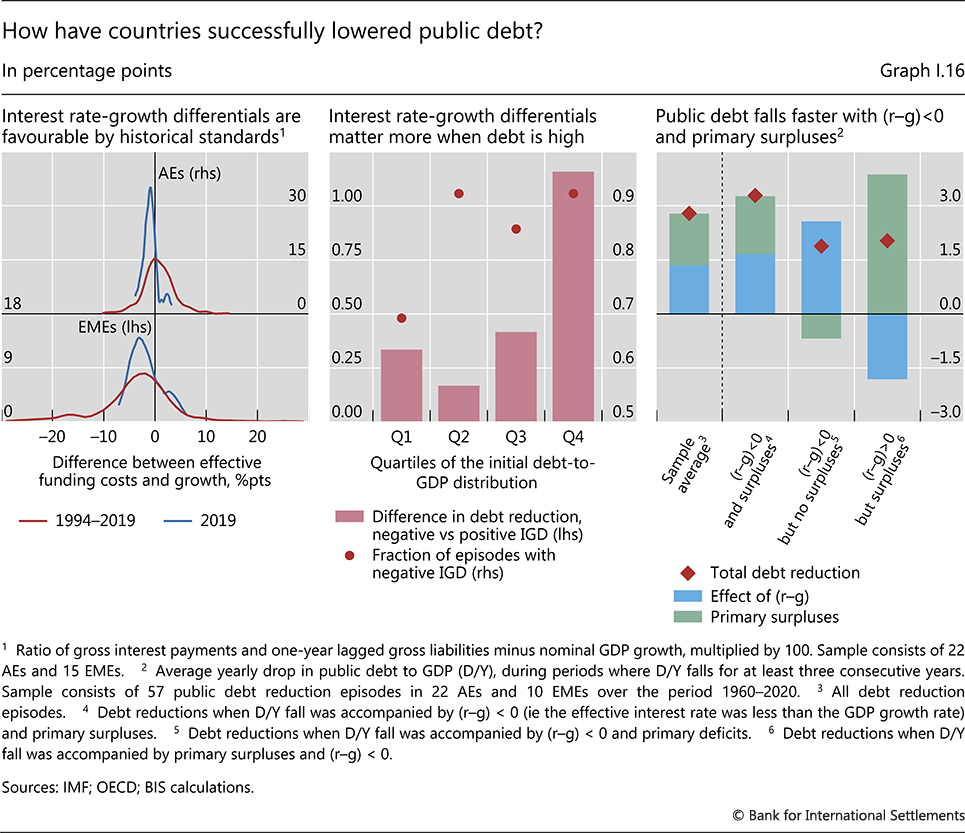
However, the history of successful episodes of consolidation raises a note of caution. Successful debt-to-GDP reductions have relied exclusively on a favourable interest rate-growth differential only in a small fraction (22%) of cases. Primary surpluses alone have hardly ever succeeded (only 15% of cases), particularly when public debt is high (Graph I.16, centre panel). Instead, a combination of surpluses and favourable interest rate-growth differentials has generally been necessary (64% of cases). Such a combination naturally also increases the speed of adjustment, by some 50% (right-hand panel). Thus, the window of opportunity provided by favourable interest rate-growth differentials should not be missed.
The fact that, along the normalisation path, the objectives of fiscal and monetary policy could give rise to tensions raises the spectre of fiscal dominance.26 Fiscal dominance denotes a situation in which monetary policy is unable to tighten as a result of fiscal constraints. The mechanism operates through the sensitivity of debt service costs to higher interest rates.
Fiscal dominance can arise for two reasons: economic conditions and political economy pressures. In the case of fiscal dominance related to economic conditions, higher interest rates cause major economic damage, forcing the central bank to refrain from tightening even when it would otherwise be desirable to do so. An archetypal example in EMEs is when the higher interest rates necessary to counter inflation undermine the government's creditworthiness, triggering a disruptive capital outflow, a sharp currency depreciation and even higher inflation. In the case of political economy pressures, the government forces the central bank to deviate from its objectives in order to limit the rise in its borrowing costs. All this suggests that the risk of fiscal dominance depends on institutional and economic factors, and is generally higher where the creditworthiness of the sovereign is weaker.
The remedies for fiscal dominance depend on the type. Addressing political economy pressures puts a premium on strong institutional arrangements to buttress the central bank's autonomy. But when the origin is purely economic constraints, even an independent central bank may have little choice but to keep interest rates low. In this case, the only remedy is fiscal consolidation.
Given the scale of the challenges involved, a key imperative is to adopt policies that strengthen sustainable growth without seeking to achieve it simply through easy monetary policy or fiscal stimulus. Structural reforms that promote a vibrant, flexible and competitive economy are essential. At the current juncture, those facilitating a reallocation of resources in the light of the pandemic-induced changes in demand patterns have a specific role to play. In addition, besides a supportive tax regime, the allocation of government expenditure matters. The necessary large increases in government transfers to households and firms during the pandemic seem to have come at the cost of lower public investment. Shifting the composition of spending back towards investment as economic conditions improve would provide welcome support. That said, as history indicates, the political economy obstacles to the implementation of growth-friendly policies should not be underestimated.
Securing a durable recovery
After the travails of the past 18 months, global economic activity is expanding vigorously. But, as this chapter has emphasised, the recovery has been very uneven, with its speed and extent varying substantially across countries and sectors. Even in the central scenario, countries' economic conditions could diverge further in the coming year, given differences in vaccination rates and policy stimulus. The more challenging scenarios described above would exacerbate these differences, with many EMEs being among the most vulnerable. The recovery's unevenness also heightens the near-term policy challenges, particularly in countries where tighter global financial conditions could go hand in hand with sluggish domestic recoveries.
In addition to meeting these near-term challenges, securing a durable recovery will require addressing the more enduring consequences of the pandemic. A sustainable expansion cannot rely on policy stimulus alone. Even if the sectoral composition of economic activity reverts to its pre-pandemic pattern as constraints ease, changes such as the unprecedented adoption of remote work and expansion of online retailing are unlikely to be fully reversed. How these developments play out will have widespread implications, including for individual firms, asset classes (not least commercial property) and financial services, such as the digitisation of payments (Chapter III). In some sectors, pandemic-induced shifts in business practices could accelerate innovation and investment. Policymakers can encourage this process, with a leading example being incentives to adopt green energy, as included in several countries' fiscal recovery packages.
While presenting new opportunities, the pandemic-induced structural changes will not benefit everyone. As the economic landscape evolves, some firms will close and some workers will lose their jobs. This process could pose a number of social challenges, including by raising inequality. Many branches of economic policy have a role to play in addressing them, including monetary policy (Chapter II).
Endnotes
1 See BIS, "A global sudden stop", Annual Economic Report 2020, June, Chapter I.
2 See BIS, "A monetary lifeline: central banks' crisis response", Annual Economic Report 2020, June, Chapter II.
3 For a review of central bank responses to the pandemic, see C Cantú, P Cavallino, F De Fiore and J Yetman, "A global database on central bank's monetary responses to Covid-19", BIS Working Papers, no 934, March 2021.
4 See R Banerjee, J Noss and J-M Vidal Pastor, "Liquidity to solvency: transition cancelled or postponed?", BIS Bulletin, no 40, March 2021.
5 See The Economist, "Relapse and recovery", 16 January 2021.
6 See UN World Tourism Organization, 2020: A year in review.
7 See also Chapter II.
8 For a review of the recent literature on fiscal multipliers, see V Ramey, "Ten years after the financial crisis: what have we learned from the renaissance in fiscal research", Journal of Economic Perspectives, vol 33, Spring 2019; and D Wilson, "The Covid-19 fiscal multiplier: lessons from the Great Recession", FRBSF Economic Letter, no 2020-13, May 2020.
9 For a recent exploration of the anchoring of inflation expectations in AEs and EMEs, see R Moessner and E Takáts, "How well-anchored are long-term inflation expectations?", BIS Working Papers, no 869, June 2020.
10 For a discussion of the role of globalisation and other long-term structural factors in flattening the Phillips curve, see R Auer, C Borio and A Filardo, "The globalisation of inflation: the growing importance of global value chains", BIS Working Papers, no 602, January 2017; and K Forbes, "Has globalization changed the inflation process?", BIS Working Papers, no 791, July 2019.
11 See K Forbes, J Gagnon and C Collins, "Low inflation bends the Phillips curve", Peterson Institute for International Economics Working Paper, no 20-6, April 2019.
12 See S Aramonte and F Avalos, "What drove the recent increase in the US inflation break-even rate?", BIS Quarterly Review, March 2021, pp 12–13.
13 See Board of Governors of the Federal Reserve System, "December 2020 stress test results", December 2020; and Bank of Japan, Financial System Report, April 2021.
14 See S Claessens, N Coleman and M Donnelly, "'Low-for-long' interest rates and banks' interest margins and profitability: Cross-country evidence", Journal of Financial Intermediation, vol 35, July 2018.
15 See S Kalemli-Ӧzcan, L Laeven and D Moreno, "Debt overhang, rollover risk, and corporate investment: evidence from the European crisis", NBER Working Papers, no 24555, August 2020.
16 See BIS, "A global sudden stop", Annual Economic Report 2020, June, Chapter I.
17 See Financial Stability Board, "Covid-19 support measures: Extending, amending and ending", April 2021.
18 See C Borio, B Vale and G von Peter, "Resolving the financial crisis: are we heeding the lessons from the Nordics?", BIS Working Papers, no 311, June 2010.
19 See Swiss National Bank, "Monetary policy assessment of 25 March 2021", March 2021; T Macklem, "Monetary Policy Report press conference opening statement", April 2021; and Reserve Bank of Australia, "Statement by Philip Lowe, Governor: Monetary Policy Decision", April 2021.
20 See G Debelle, "Monetary policy during COVID", Shann Memorial Lecture, May 2021.
21 See D Araujo, B Cohen and P Pogliani, "Bank loan loss provisioning during the Covid crisis", BIS Quarterly Review, March 2021, pp 9–10.
22 See C Borio, M Farag and N Tarashev, "Post-crisis international financial regulatory reforms: a primer", BIS Working Papers, no 859, April 2020.
23 See Financial Stability Board, Holistic Review of the March Market Turmoil, November 2020.
24 See Financial Stability Board, FSB Work Programme for 2021, January 2021.
25 See the updates of S Arslanalp and T Tsuda, "Tracking global demand for advanced economy sovereign debt", IMF Economic Review, vol 62, October 2014.
26 For more discussion of these issues, see C Borio and P Disyatat, "Monetary and fiscal policy: privileged powers, entwined responsibilities", SUERF Policy Note, no 238, May 2021.