Annual Economic Report 2021 - Statistics associated with the graphs
Download all statistics (zipped XLSX, 665 KB)
Graphs |
||
| Chapter I: data behind the graphs (xlsx) | ||
| I.1 | A large recession, but macroeconomic policy support limited the fallout | p 2 |
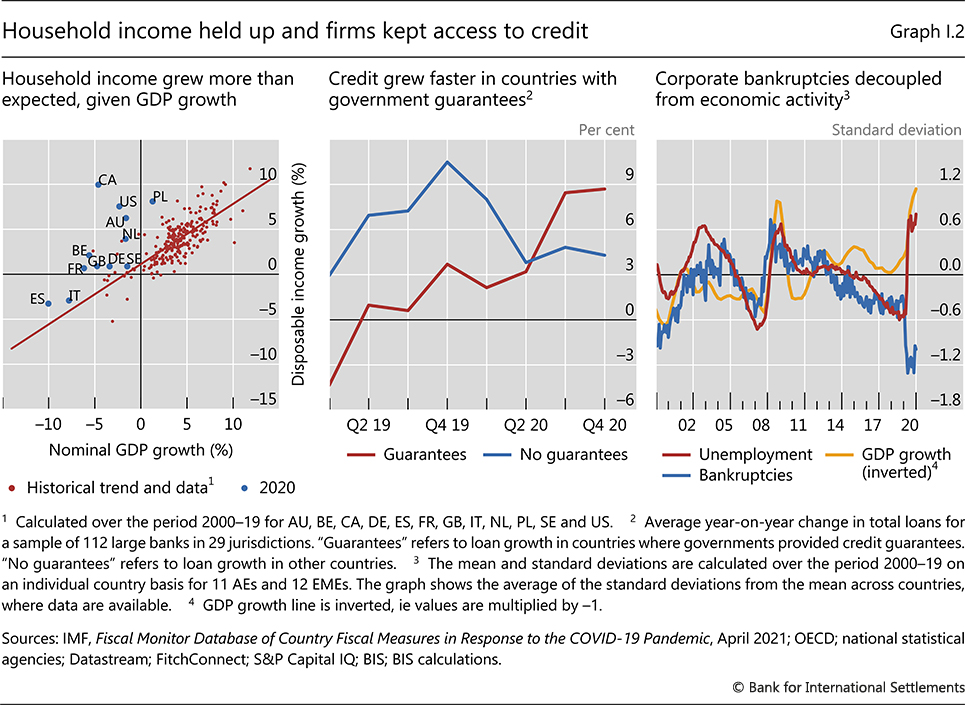
| I.2 | Household income held up and firms kept access to credit | p 3 |
| I.3 | Scarring was not as large as initially feared | p 4 |
| I.4 | Banks' profitability declined but capital ratios rose | p 5 |
| I.5 | Economic conditions remain weaker than before the pandemic | p 6 |
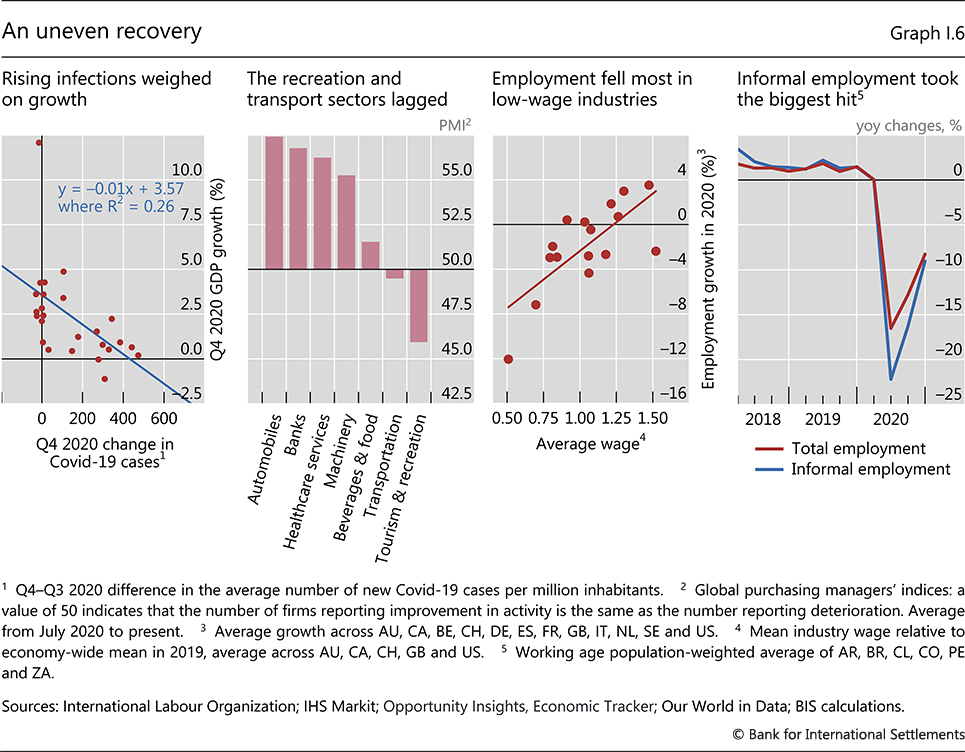
| I.6 | An uneven recovery | p 7 |
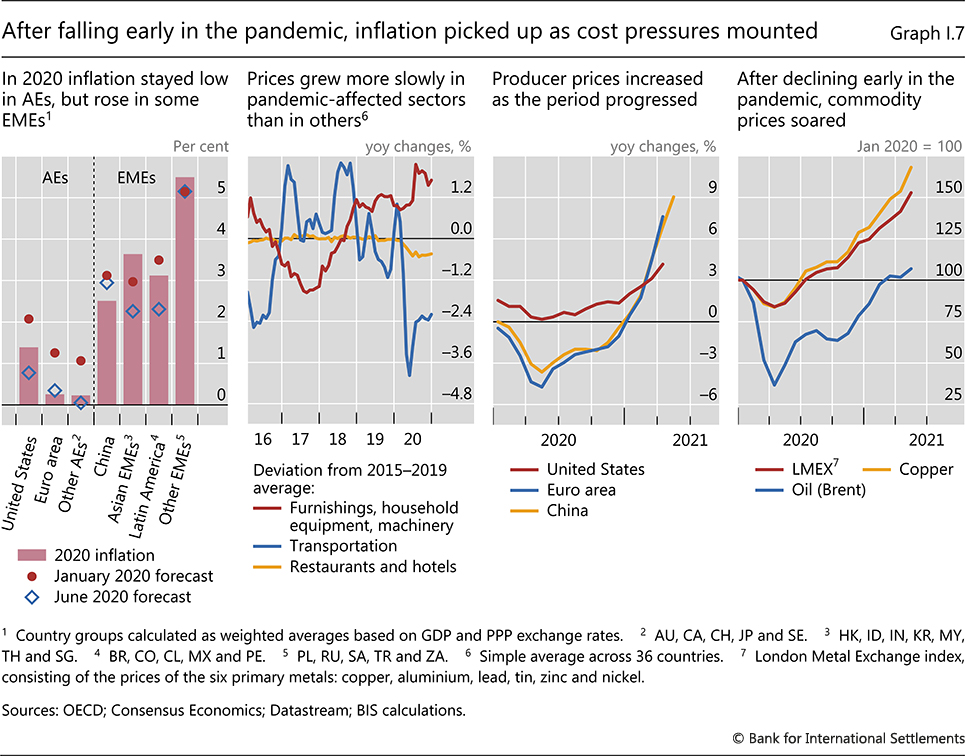
| I.7 | After falling early in the pandemic, inflation picked up as cost pressures mounted | p 8 |
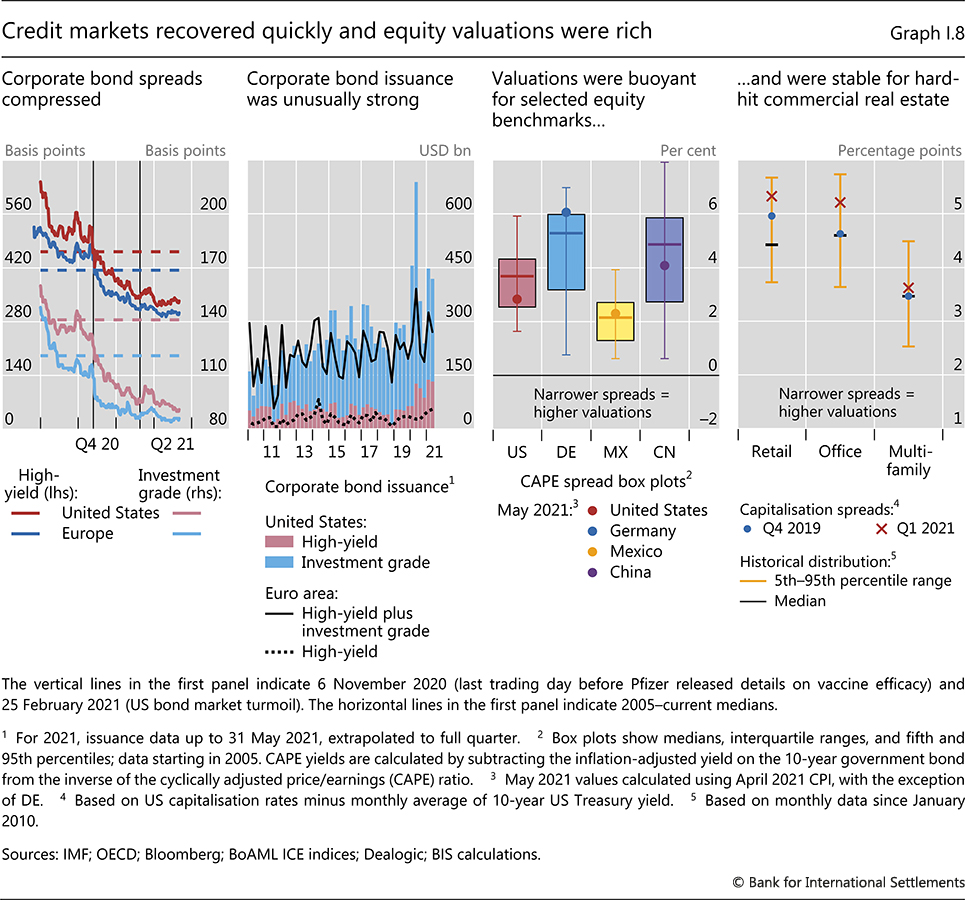
| I.8 | Credit markets recovered quickly and equity valuations were rich | p 9 |
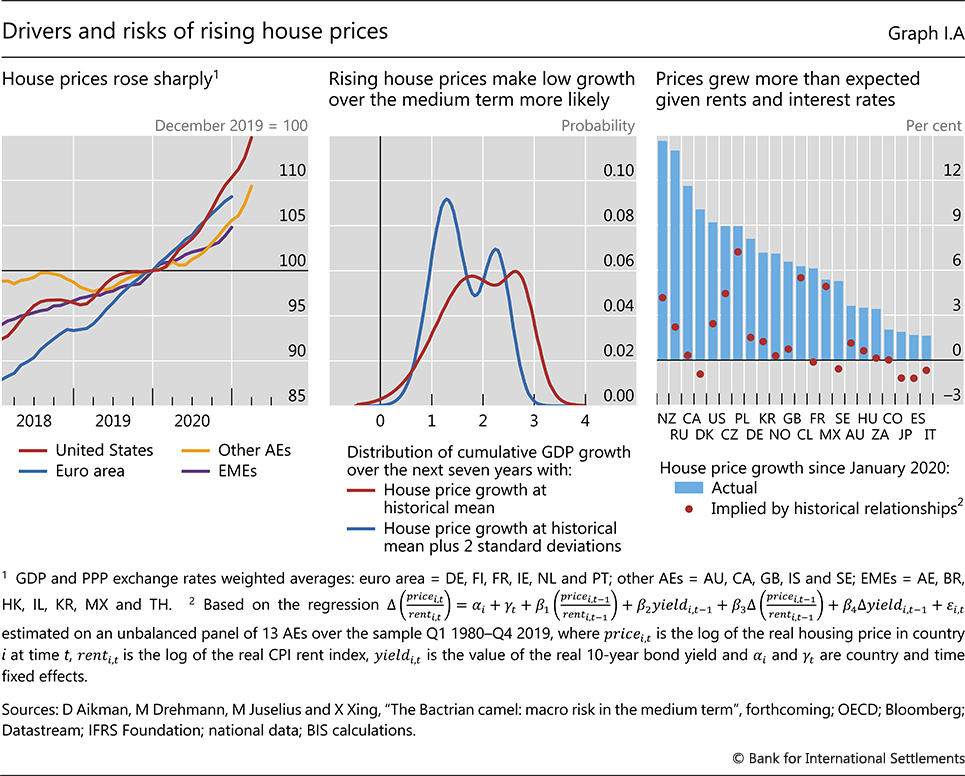
| I.A | Drivers and risks of rising house prices | p 10 |
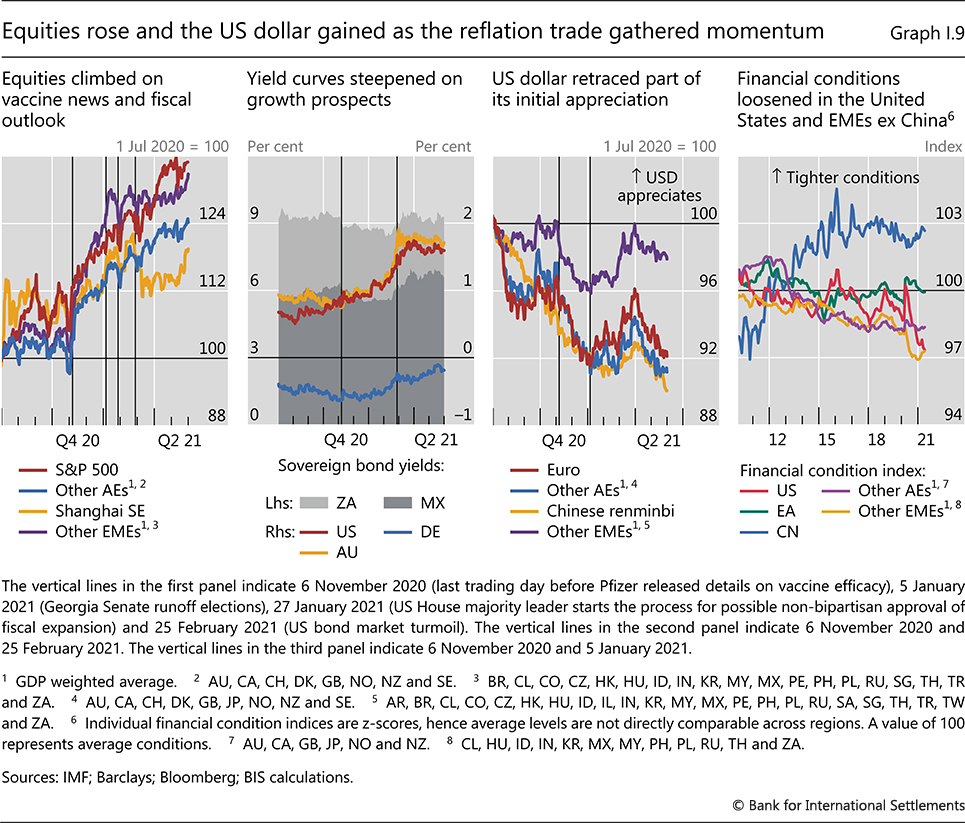
| I.9 | Equities rose and the US dollar gained as the reflation trade gathered momentum | p 12 |
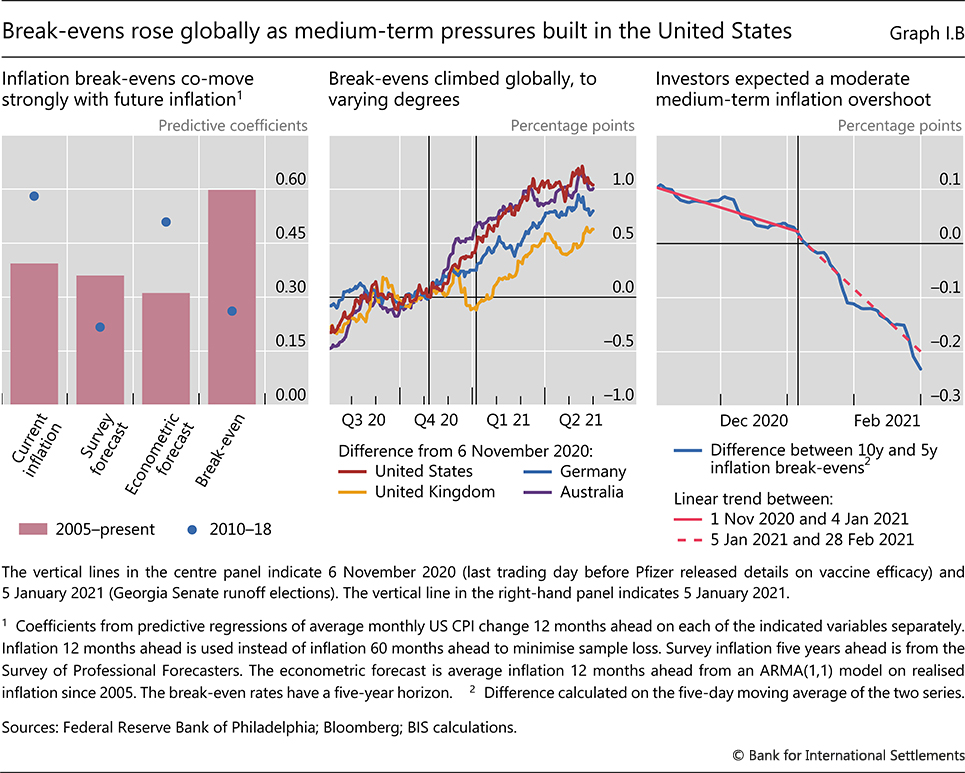
| I.B | Break-evens rose globally as medium-term pressures built in the United States | p 13 |
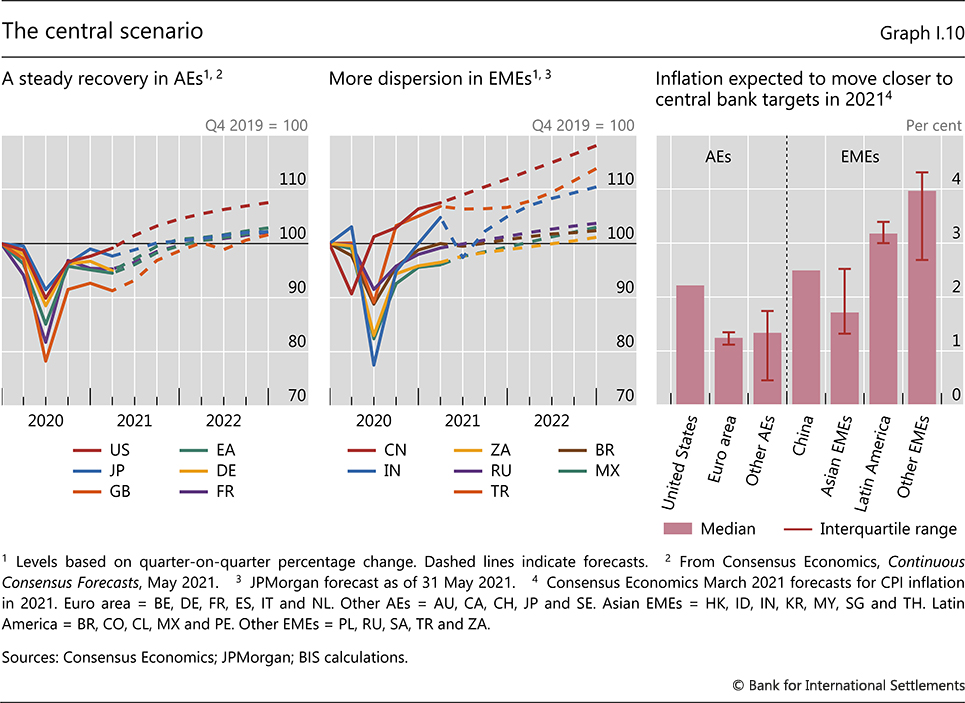
| I.10 | The central scenario | p 14 |
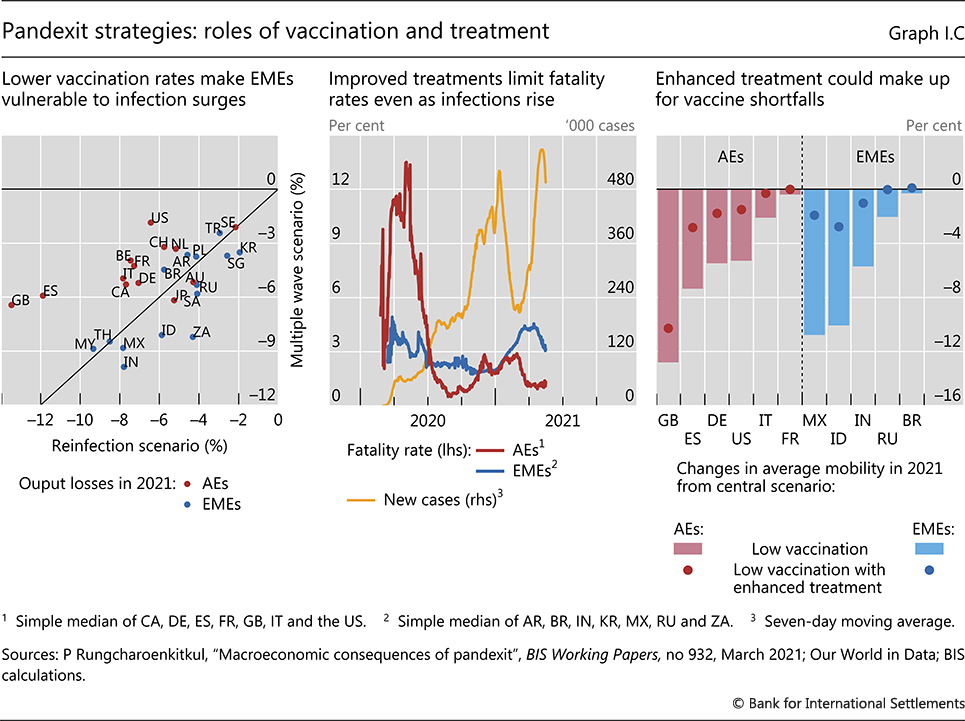
| I.C | Pandexit strategies: roles of vaccination and treatment | p 15 |
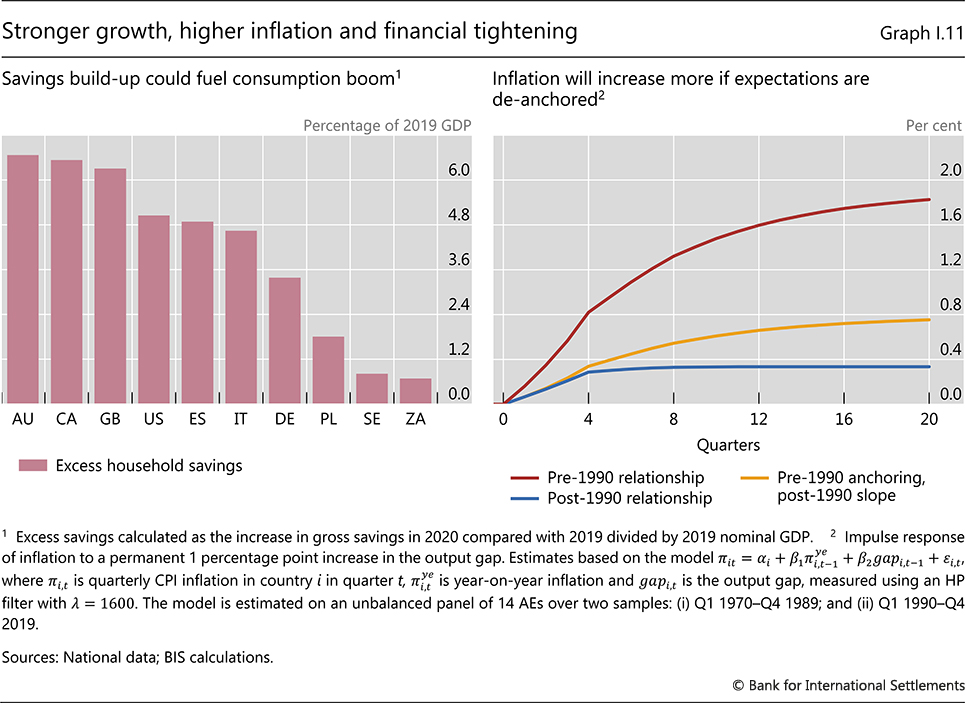
| I.11 | Stronger growth, higher inflation and financial tightening | p 18 |
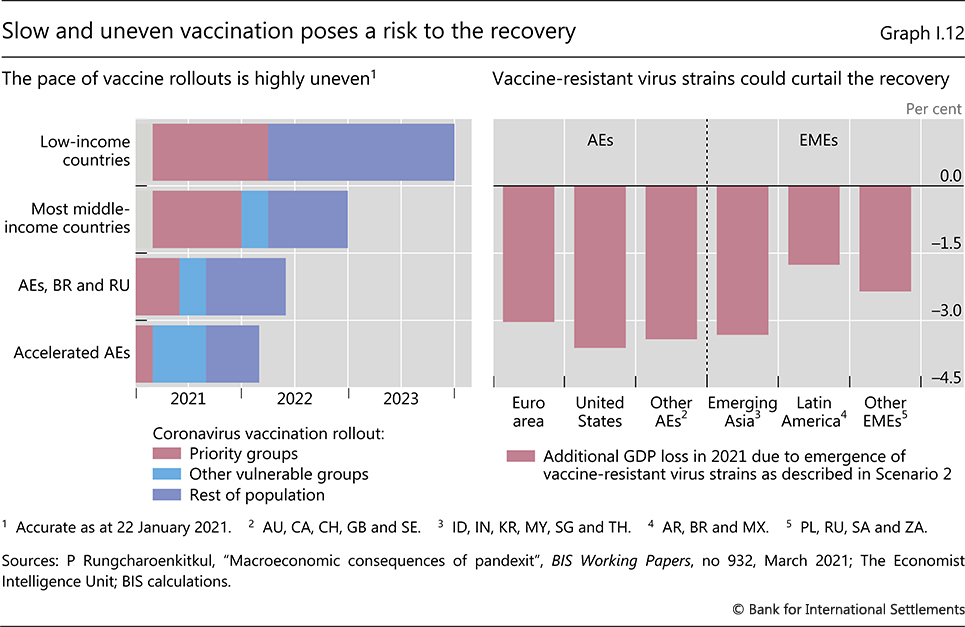
| I.12 | Slow and uneven vaccination poses a risk to the recovery | p 19 |
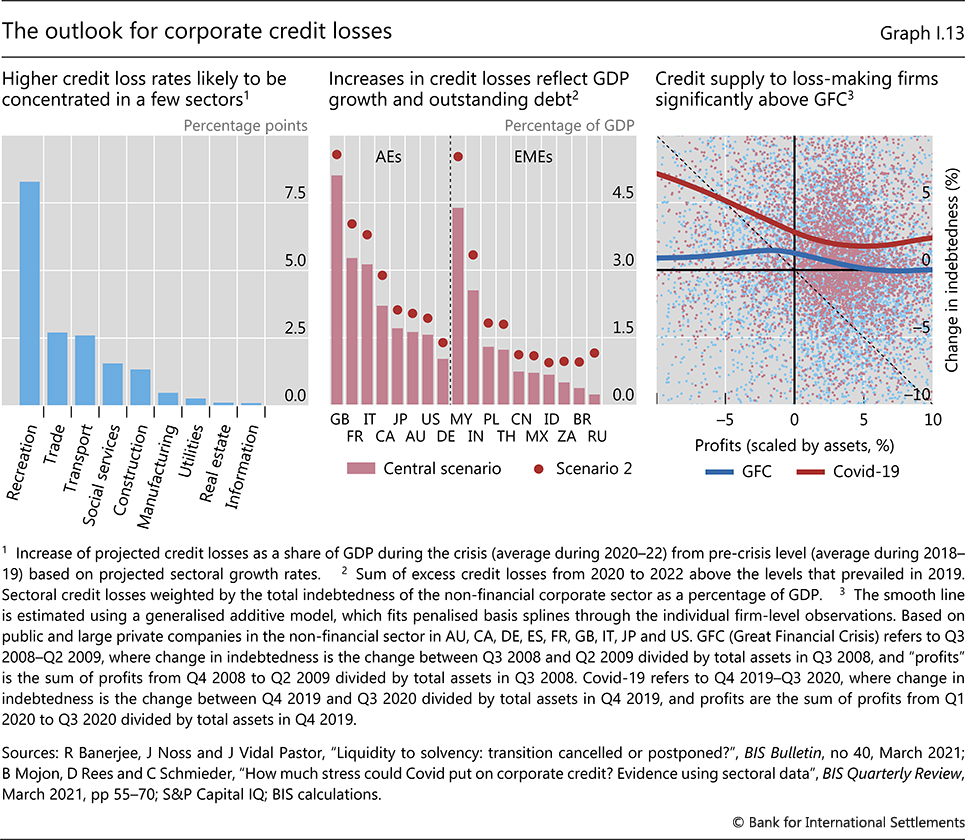
| I.13 | The outlook for corporate credit losses | p 20 |
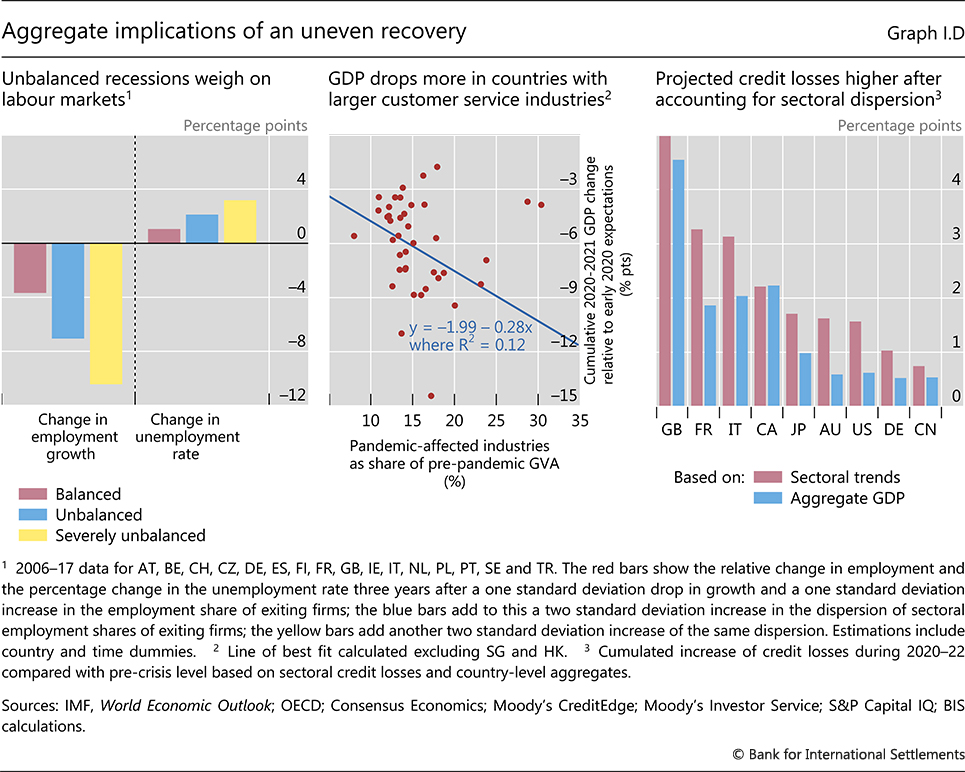
| I.D | Aggregate implications of an uneven recovery | p 21 |
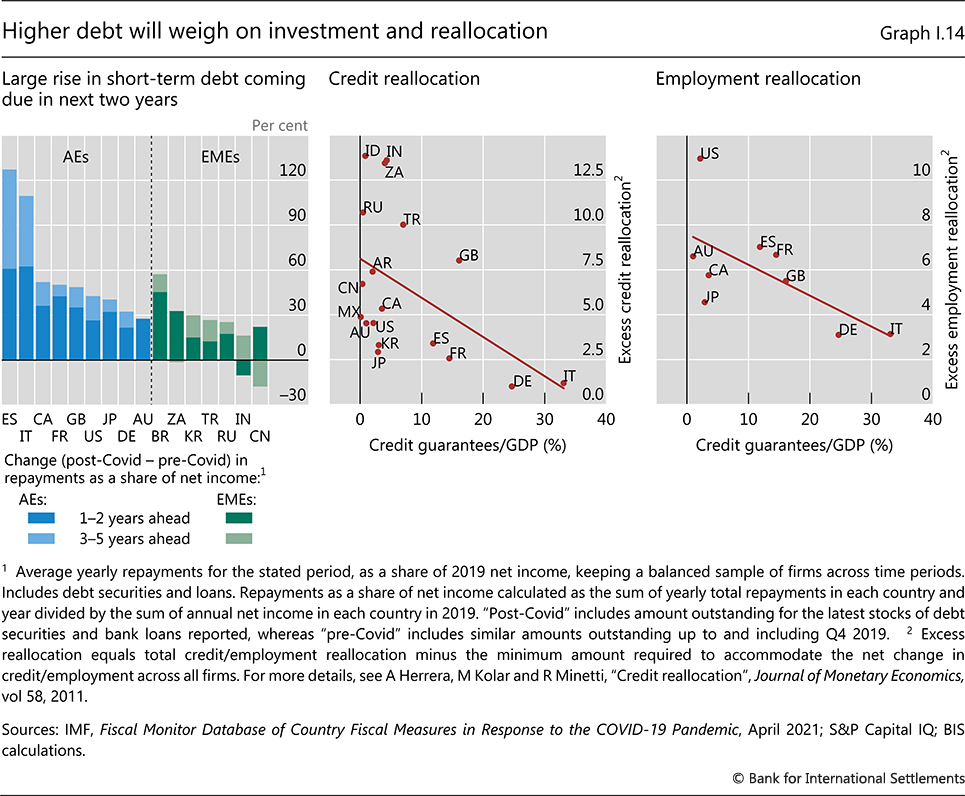
| I.14 | Higher debt will weigh on investment and reallocation | p 22 |
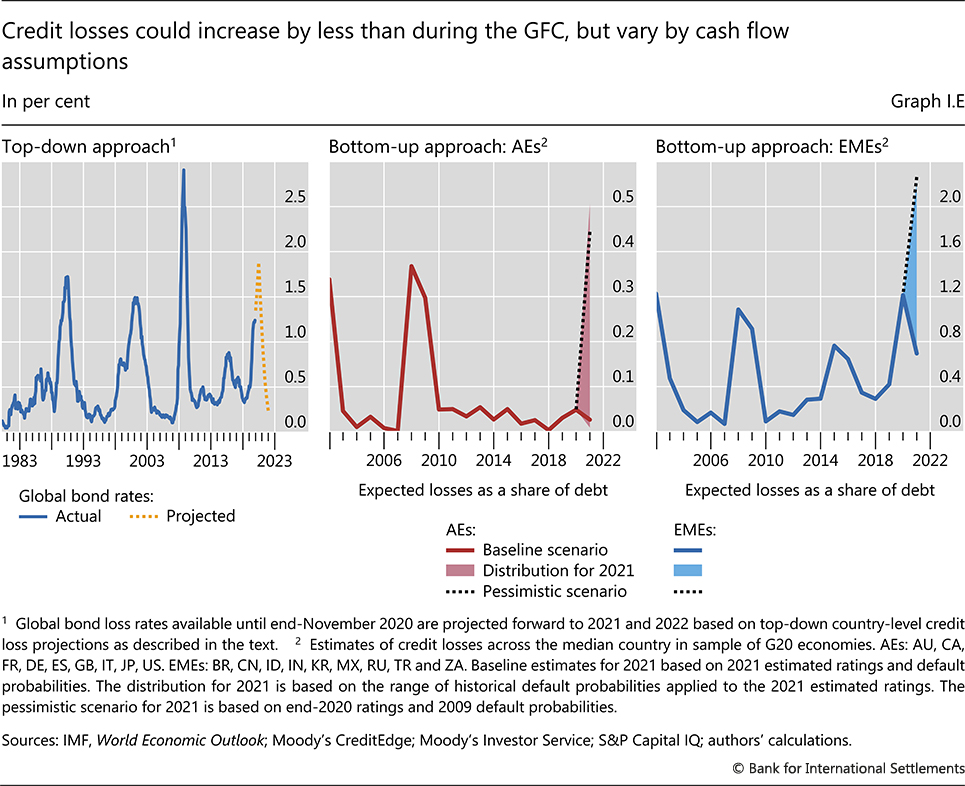
| I.E | Credit losses could increase by less than during the GFC, but vary by cash flow assumptions | p 24 |
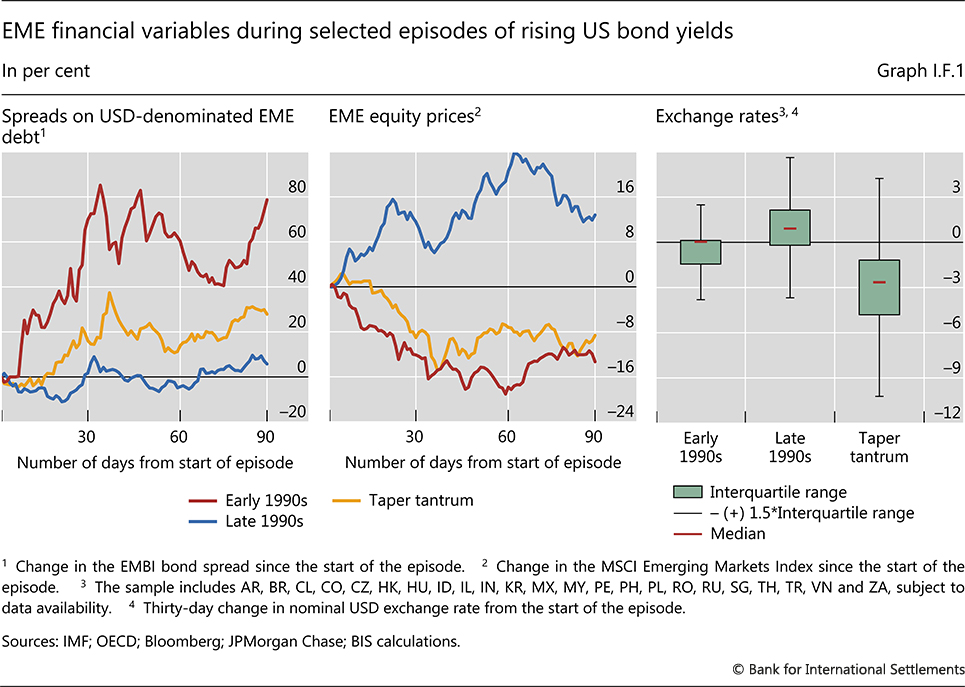
| I.F.1 | EME financial variables during selected episodes of rising US bond yields | p 47 |
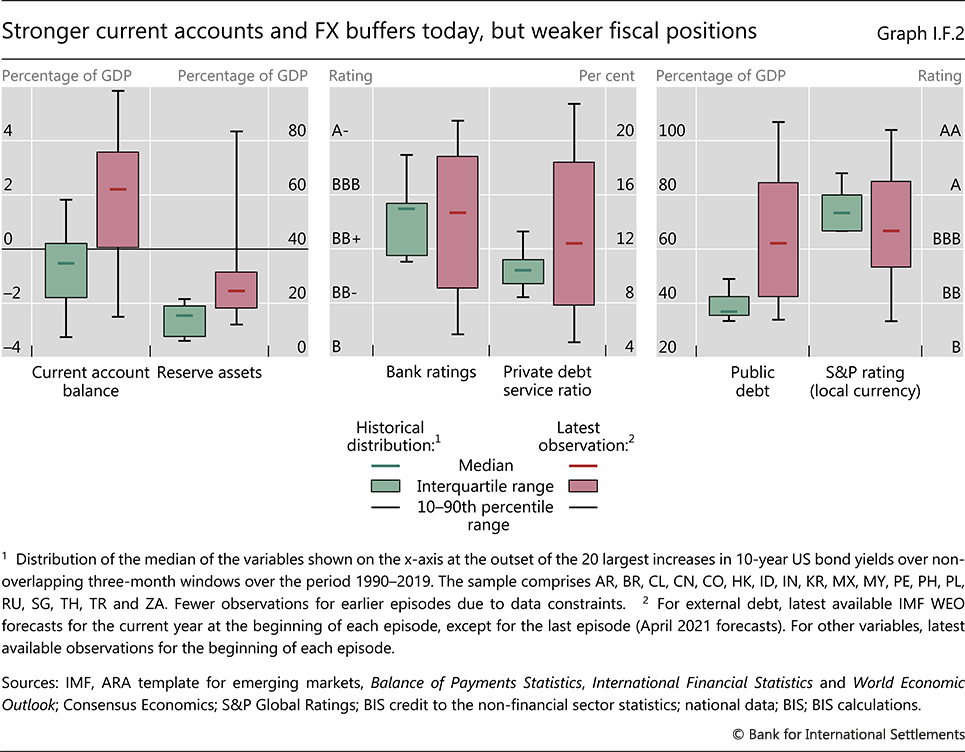
| I.F.2 | Stronger current accounts and FX buffers today, but weaker fiscal positions | p 28 |
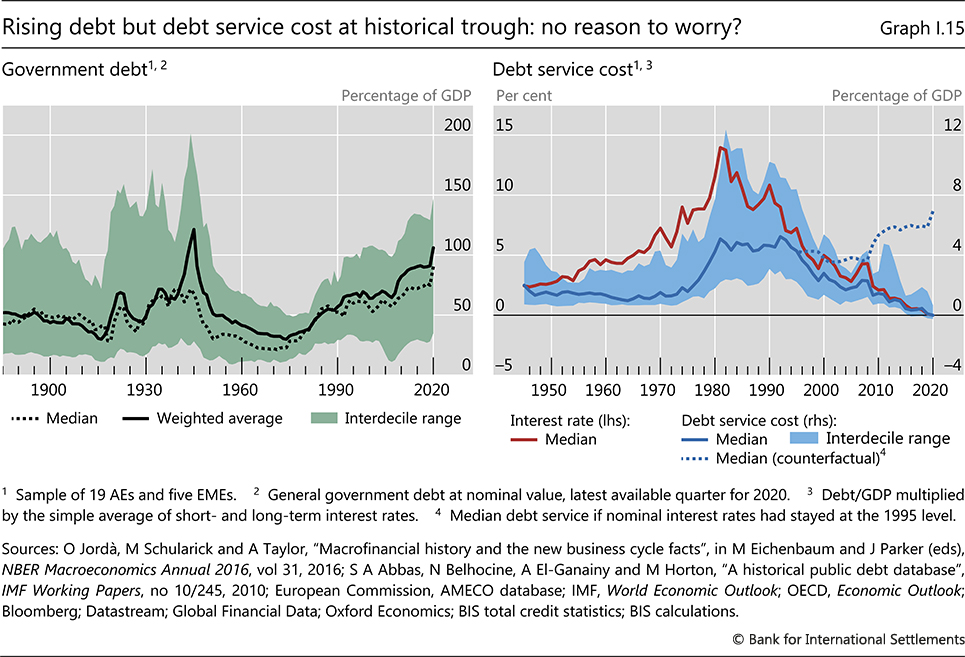
| I.15 | Rising debt but debt service cost at historical trough: no reason to worry? | p 31 |
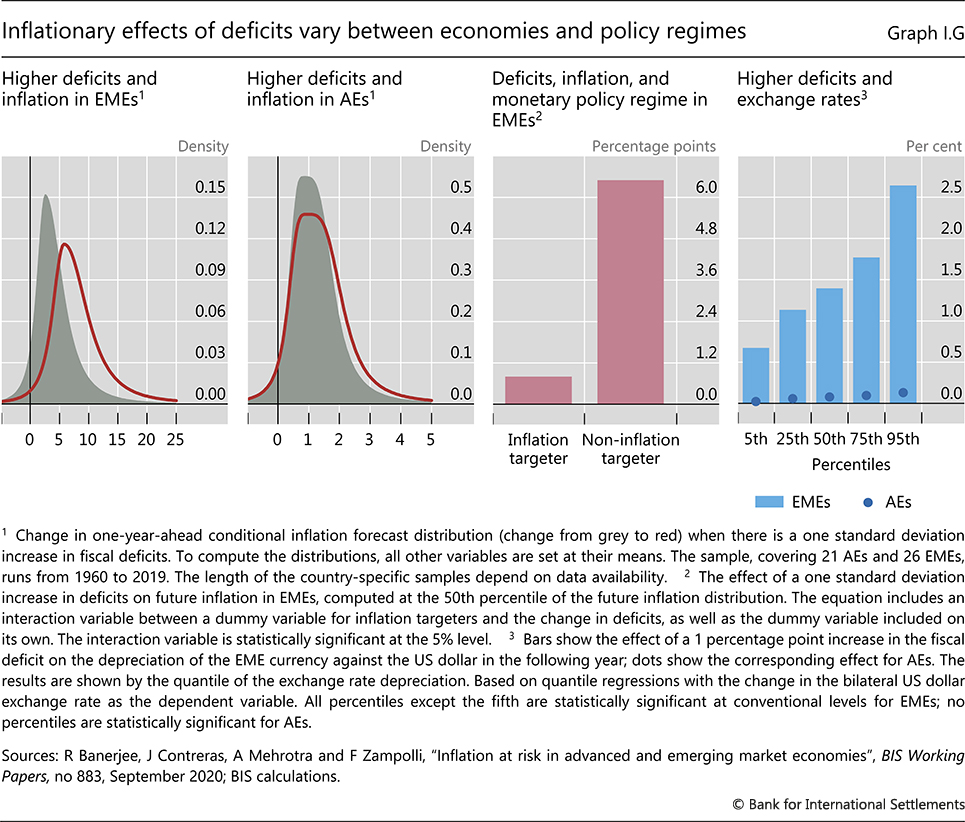
| I.G | Inflationary effects of deficits vary between economies andpolicy regimes | p 32 |
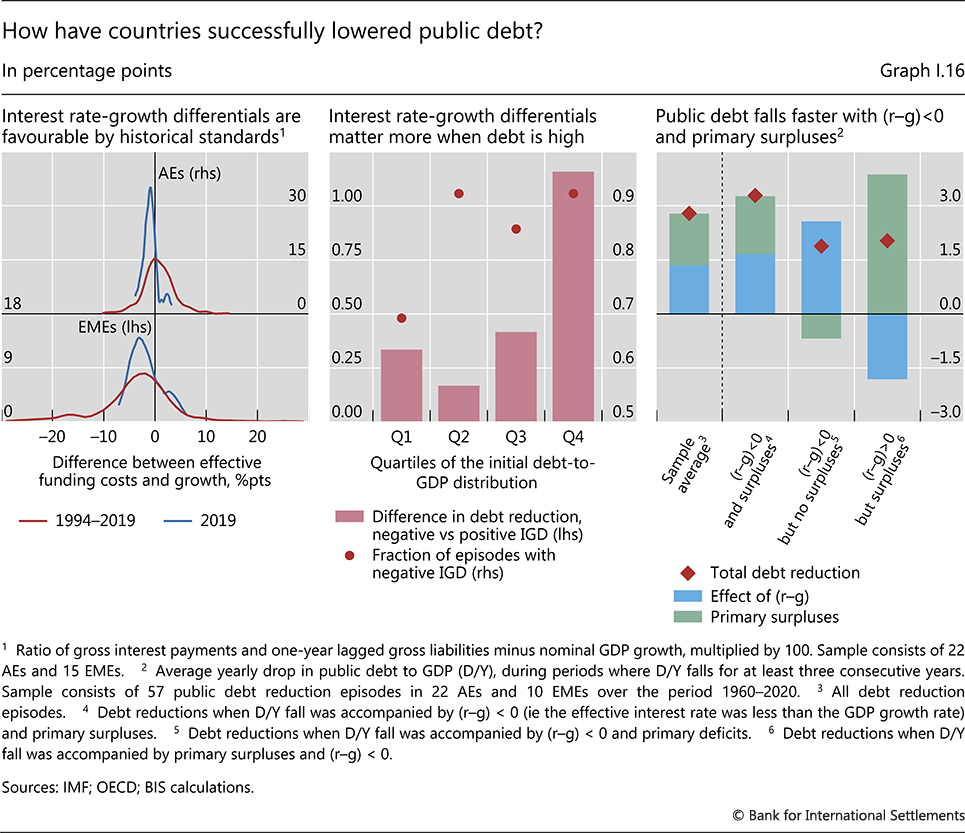
| I.16 | How have countries successfully lowered public debt? | p 34 |
| Chapter II: data behind the graphs (xlsx) | ||
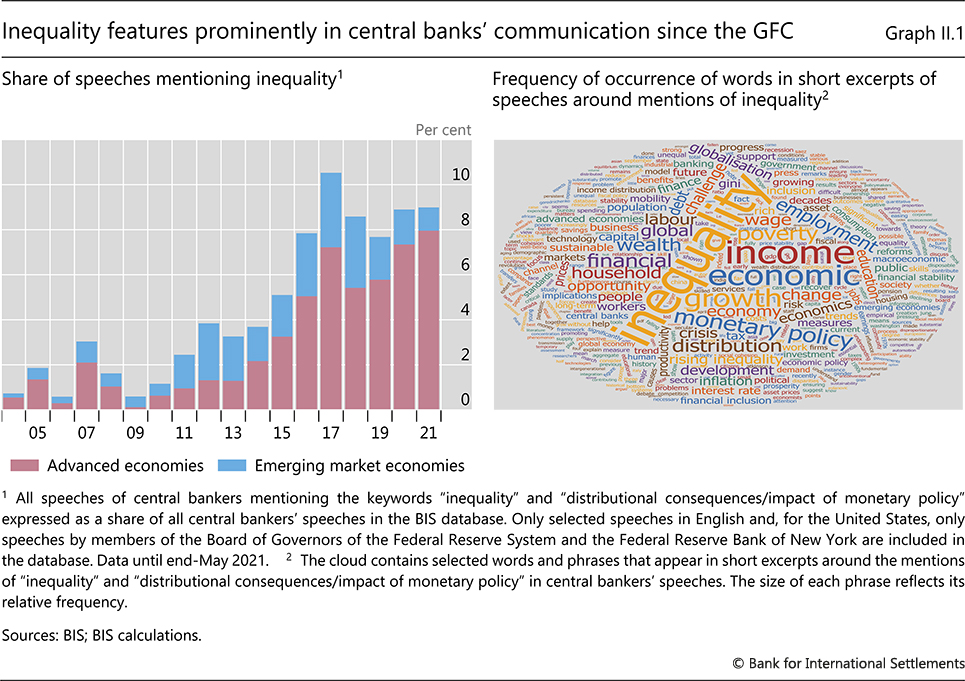
| II.1 | Inequality features prominently in central banks' communication since the GFC | p 40 |
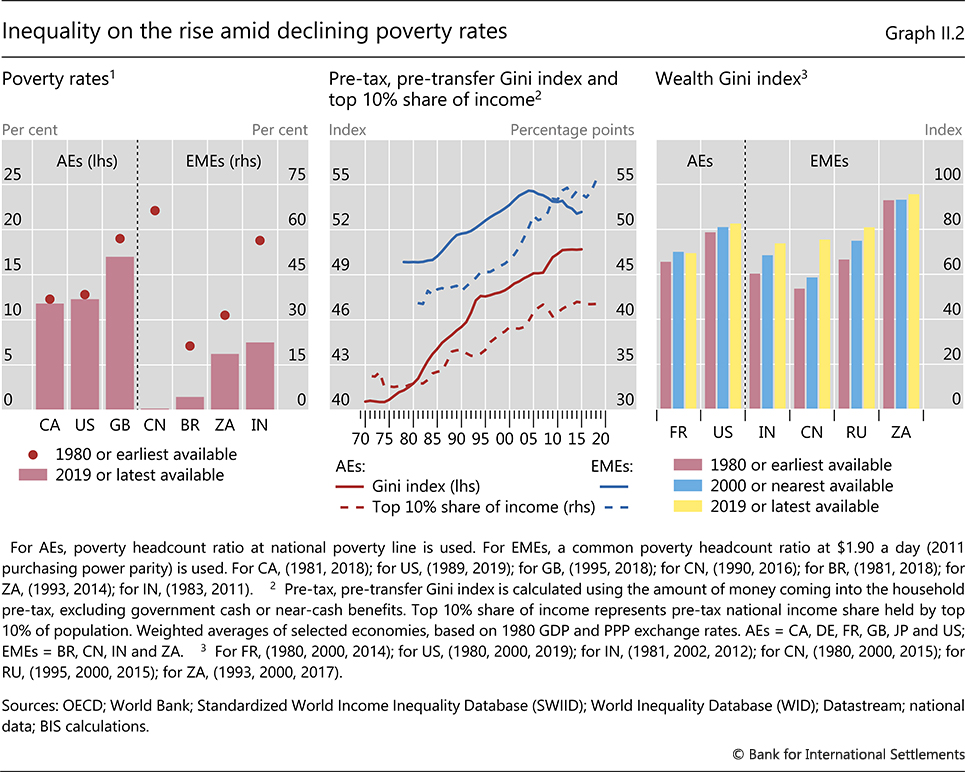
| II.2 | Inequality on the rise amid declining poverty rates | p 41 |
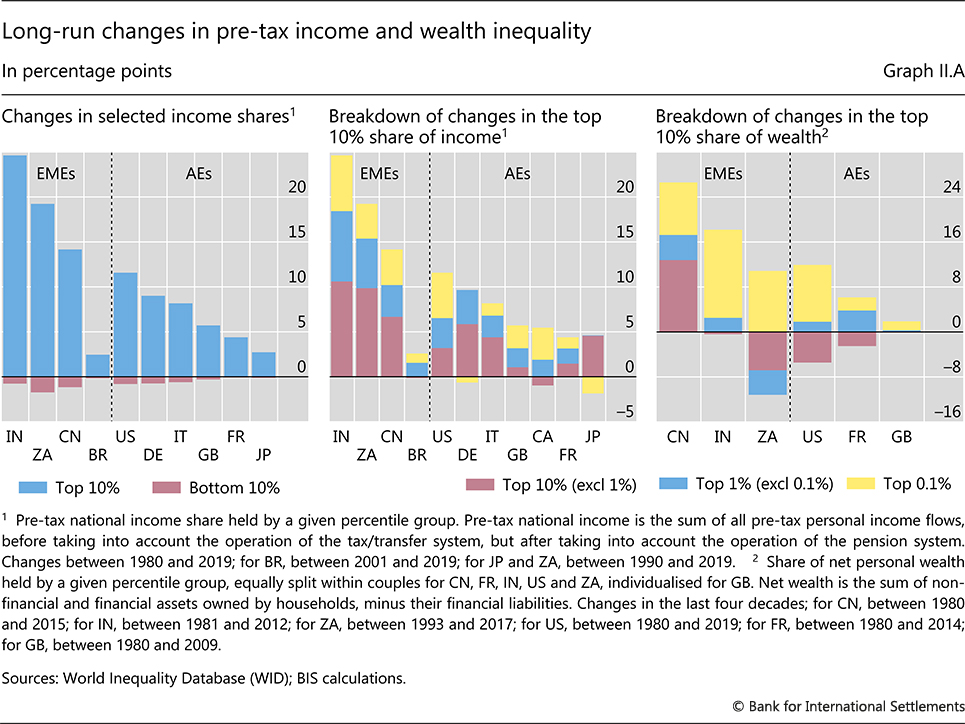
| II.A | Long-run changes in pre-tax income and wealth inequality | p 42 |
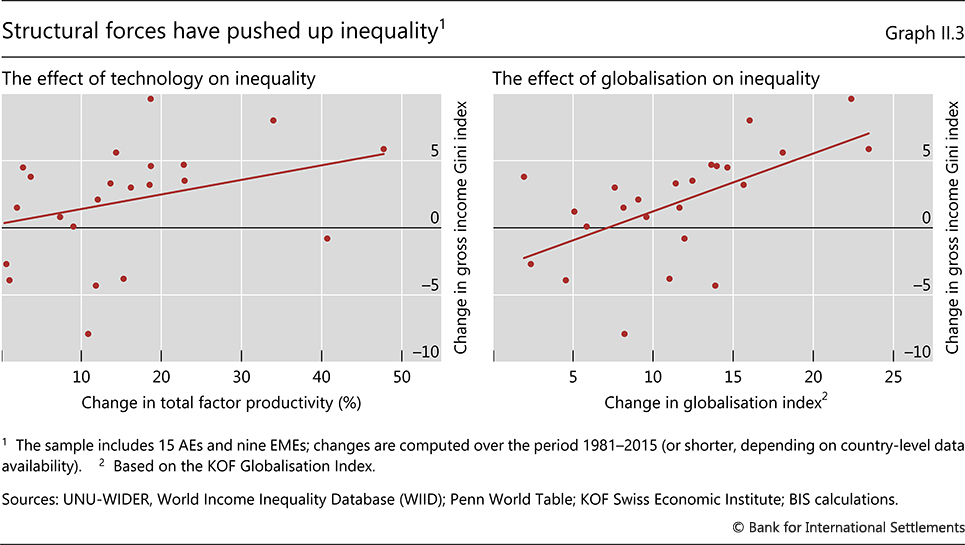
| II.3 | Structural forces have pushed up inequality | p 43 |
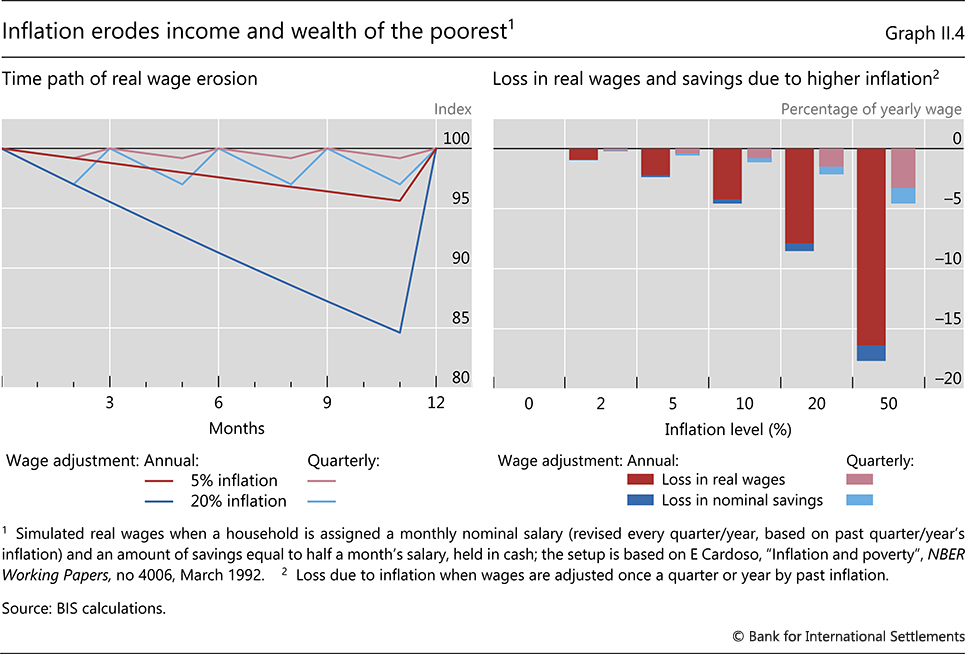
| II.4 | Inflation erodes income and wealth of the poorest | p 45 |
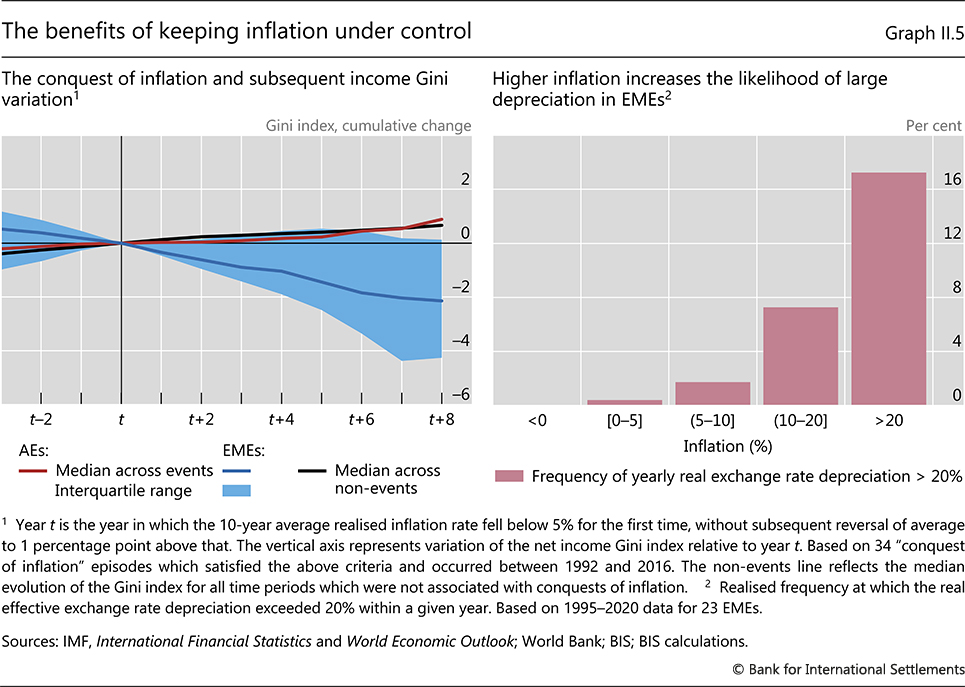
| II.5 | The benefits of keeping inflation under control | p 46 |
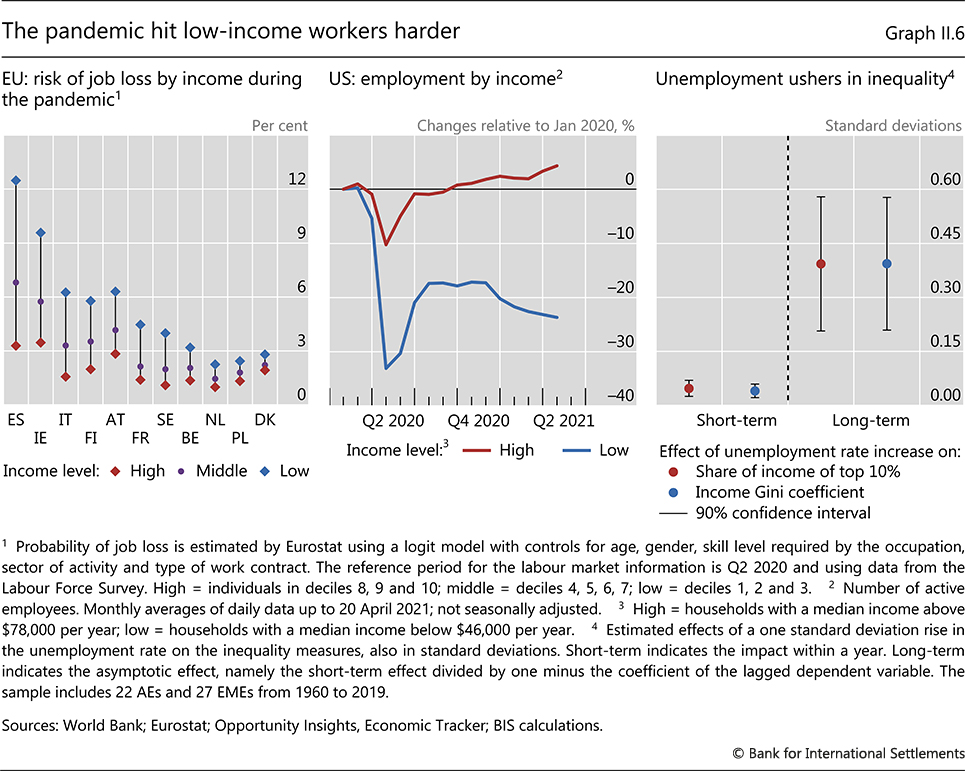
| II.6 | The pandemic hit low-income workers harder | p 47 |
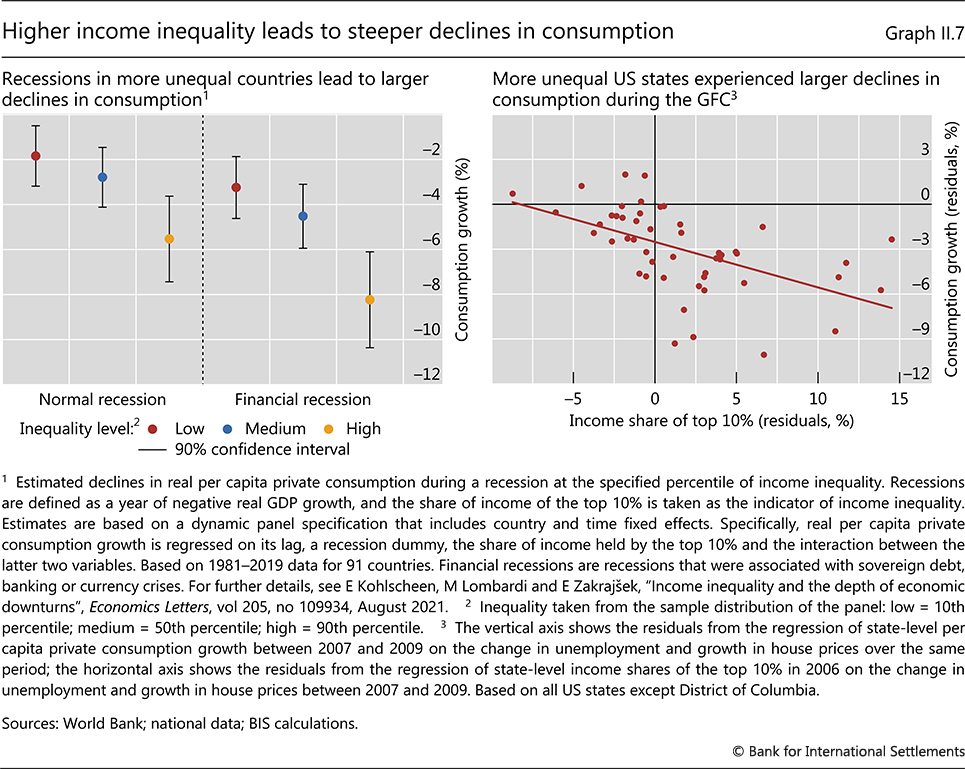
| II.7 | Higher income inequality leads to steeper declines in consumption | p 48 |
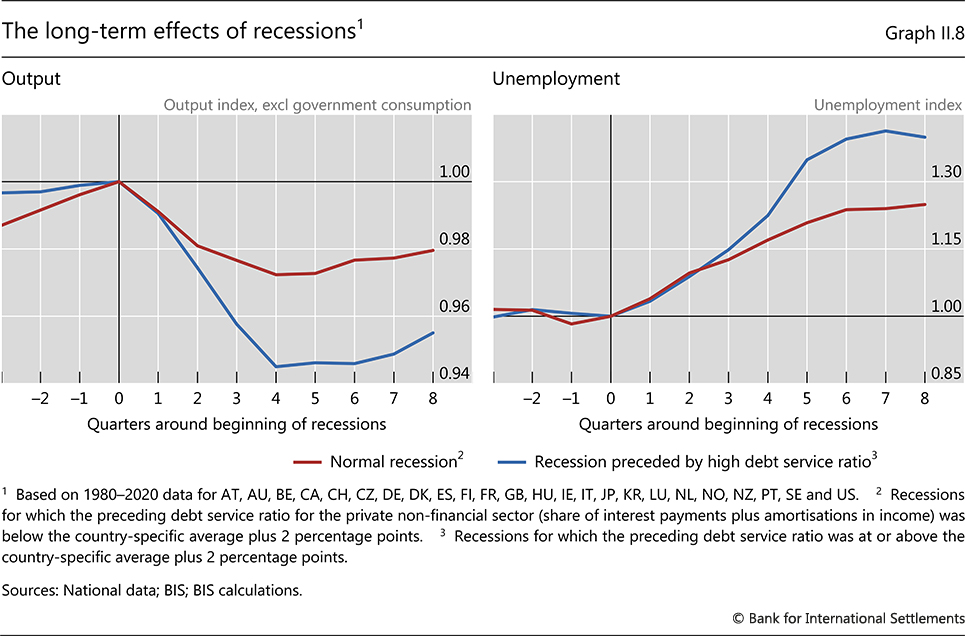
| II.8 | The long-term effects of recessions | p 49 |
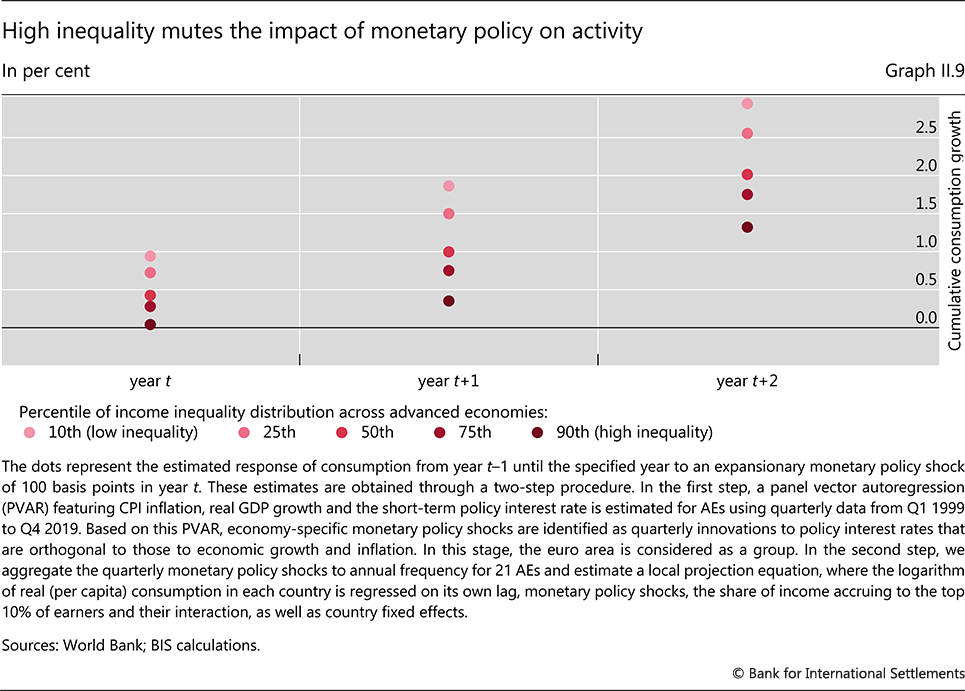
| II.9 | High inequality mutes the impact of monetary policy on activity | p 50 |
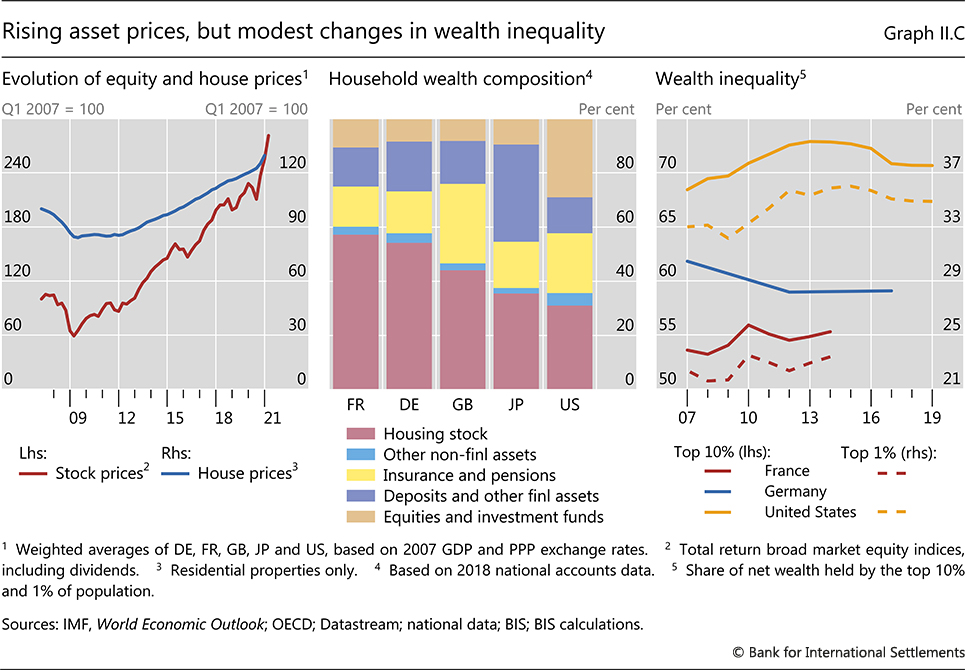
| II.C | Rising asset prices, but modest changes in wealth inequality | p 52 |
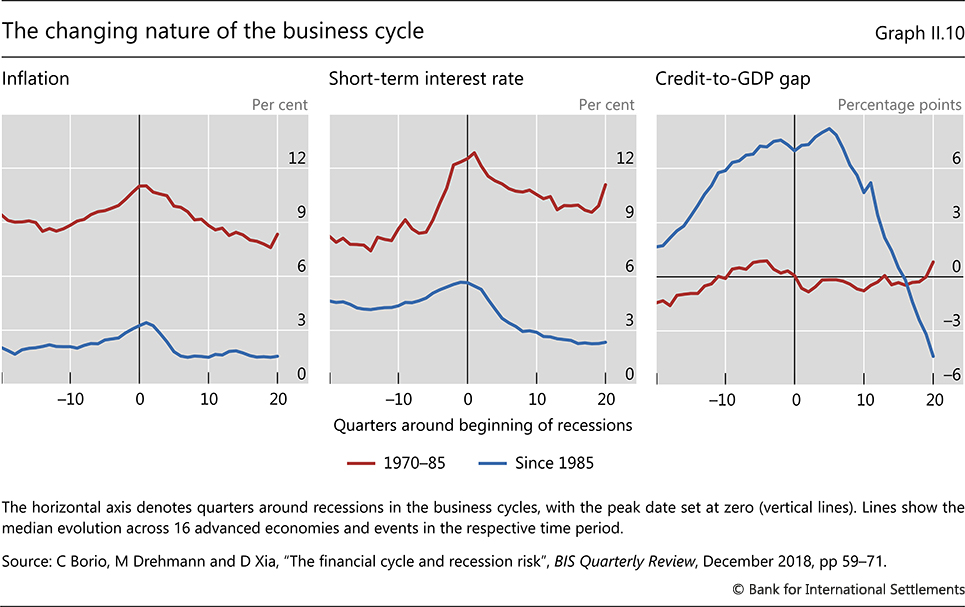
| II.10 | The changing nature of the business cycle | p 54 |
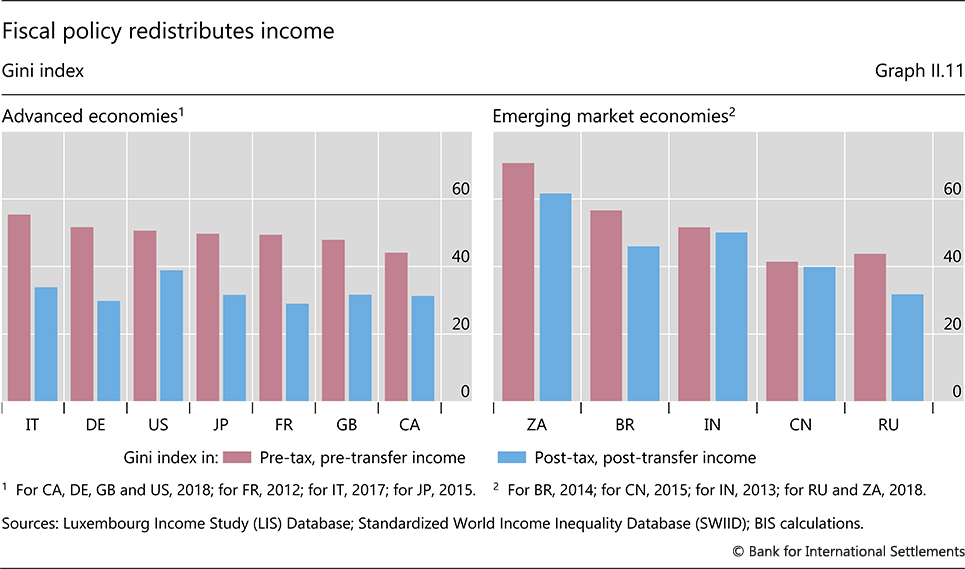
| II.11 | Fiscal policy redistributes income | p 58 |
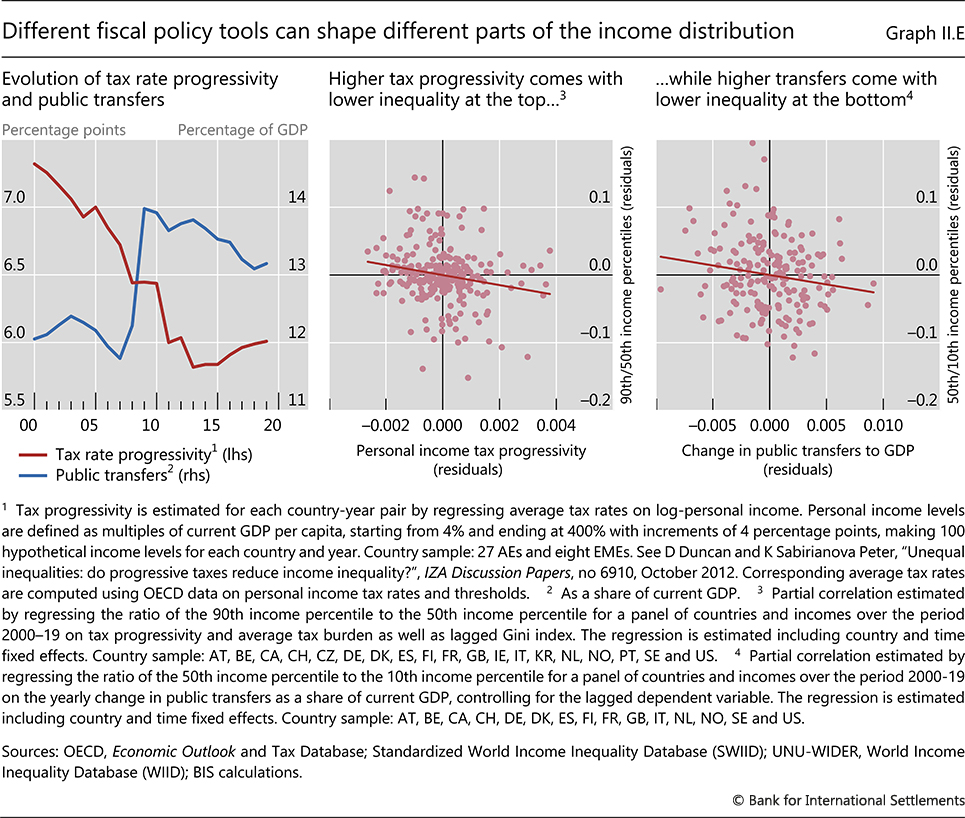
| II.E | Different fiscal policy tools can shape different parts of the income distribution | p 59 |
| Chapter III: data behind the graphs (xlsx) | ||
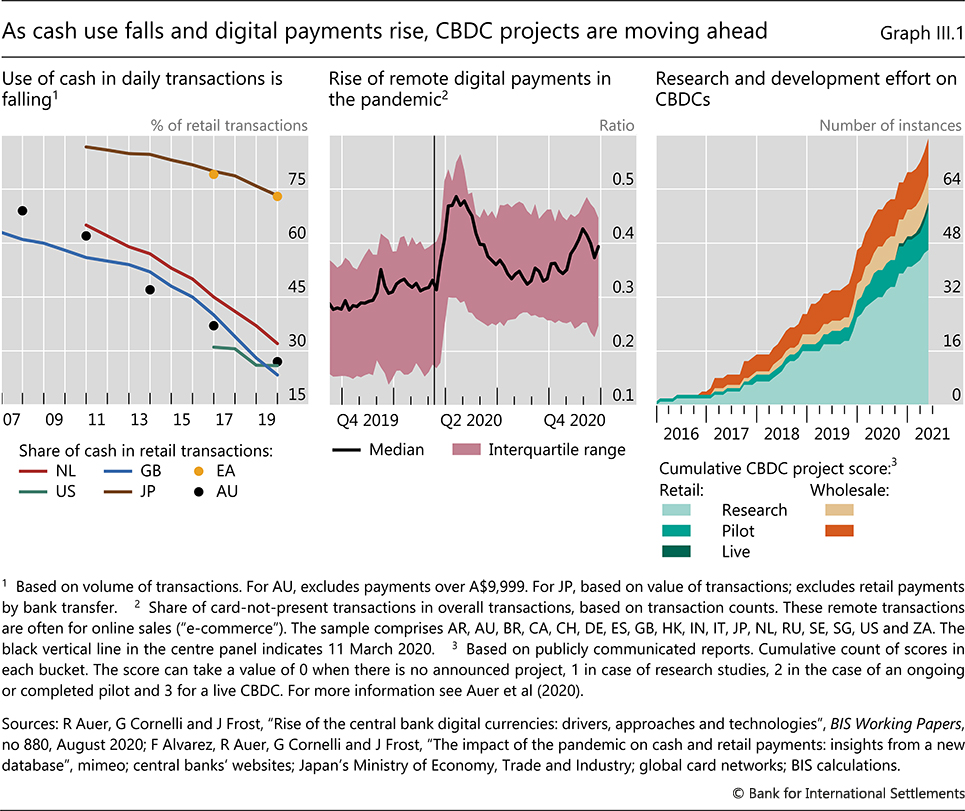
| III.1 | As cash use falls and digital payments rise, CBDC projects are moving ahead | p 67 |
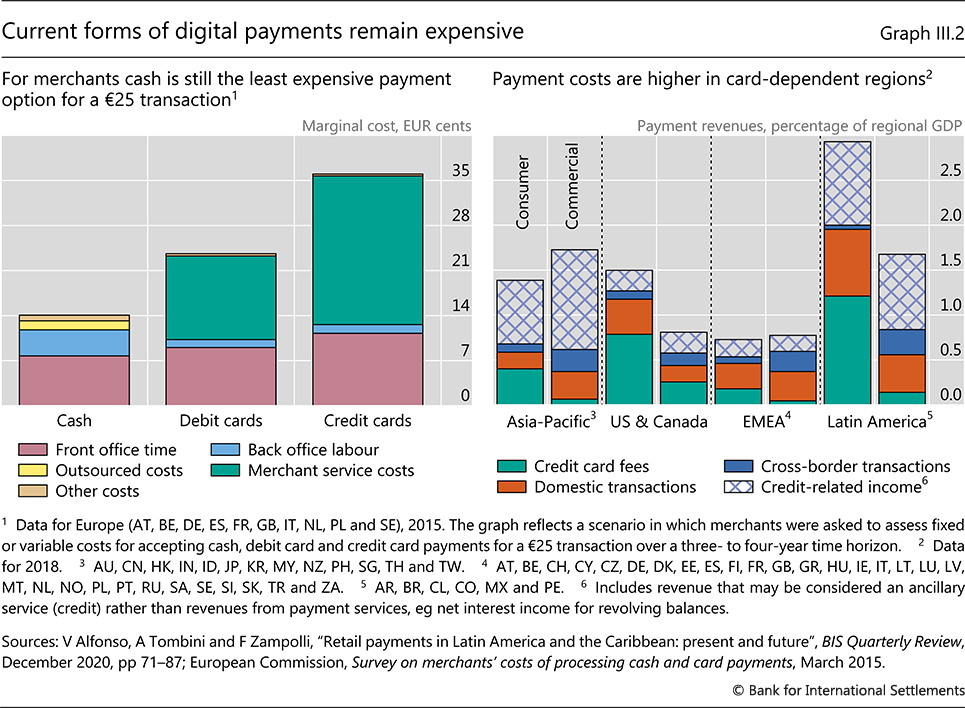
| III.2 | Current forms of digital payments remain expensive | p 68 |
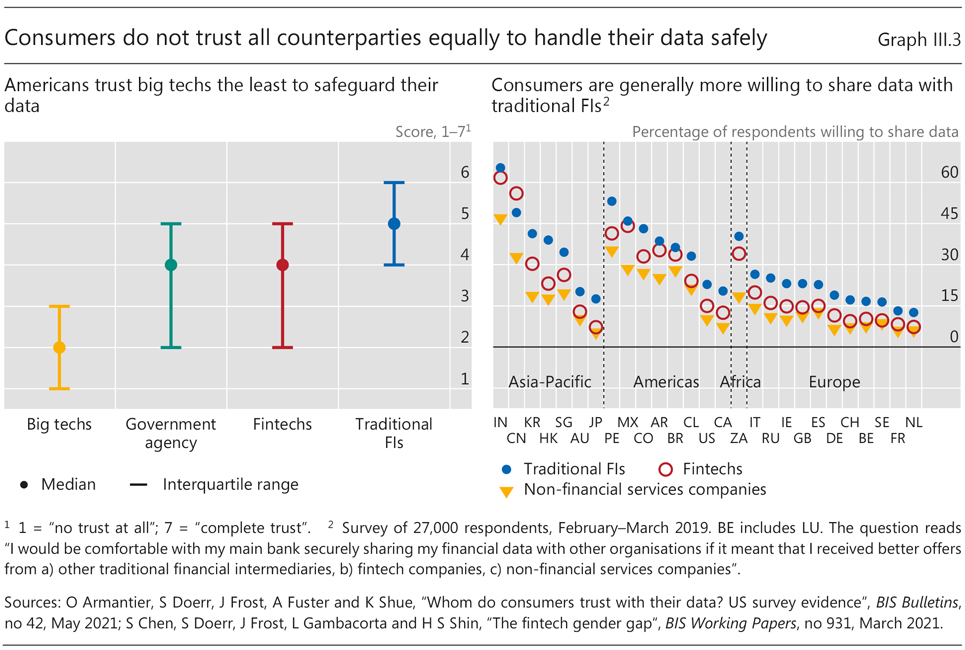
| III.3 | Consumers do not trust all counterparties equally to handle their data safely | p 69 |
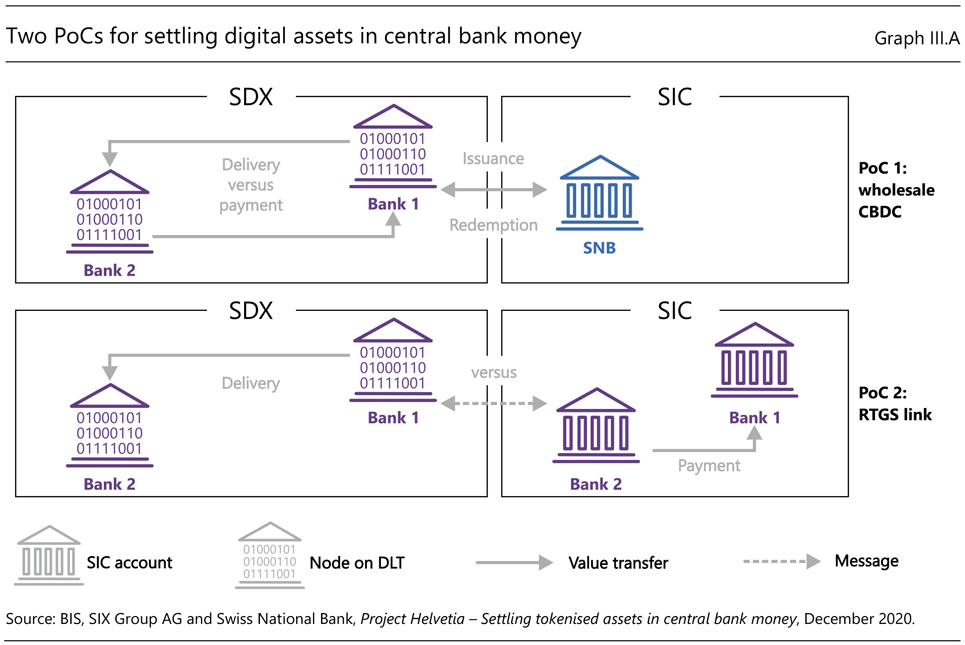
| III.A | Two PoCs for settling digital assets in central bank money | p 71 |
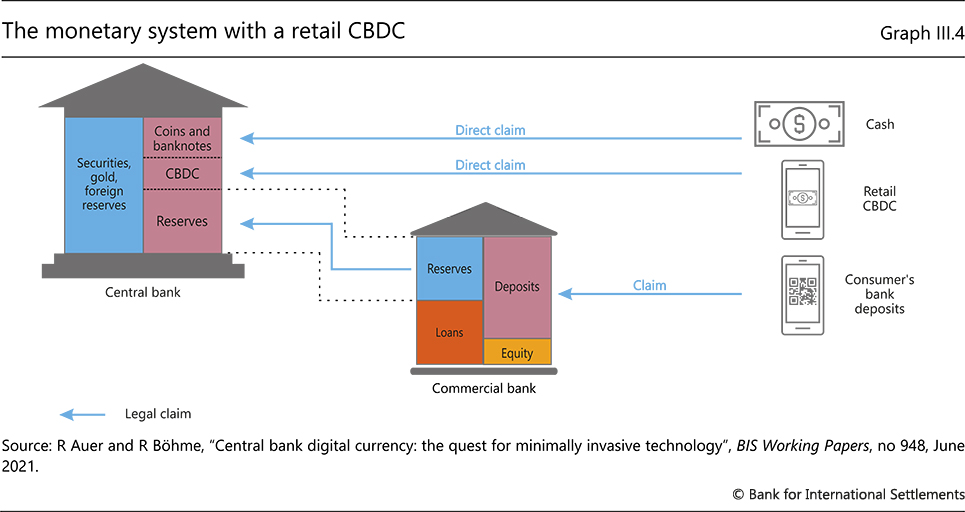
| III.4 | The monetary system with a retail CBDC | p 72 |
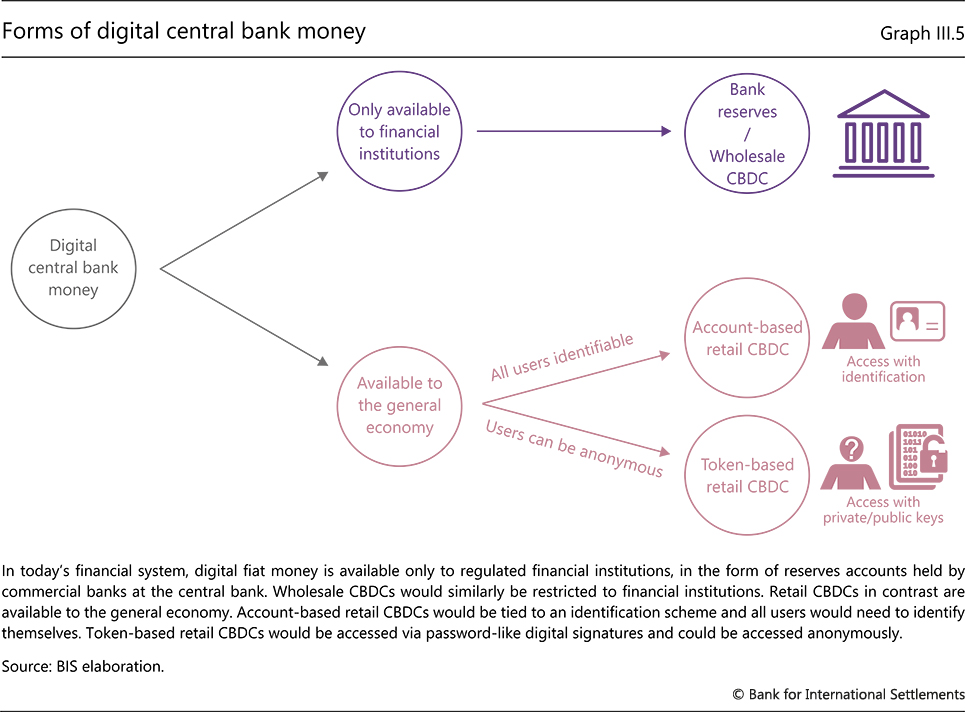
| III.5 | Forms of digital central bank money | p 73 |
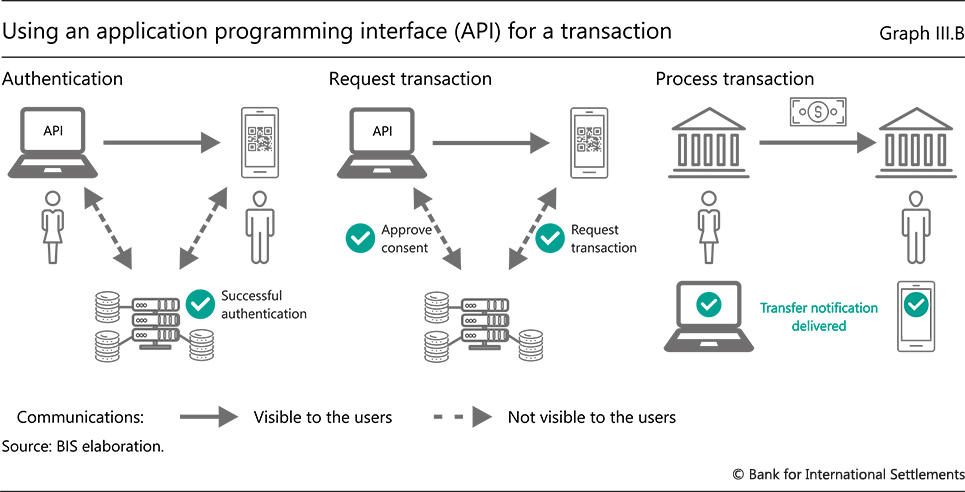
| III.B | Using an application programming interface (API) for a transaction | p 74 |
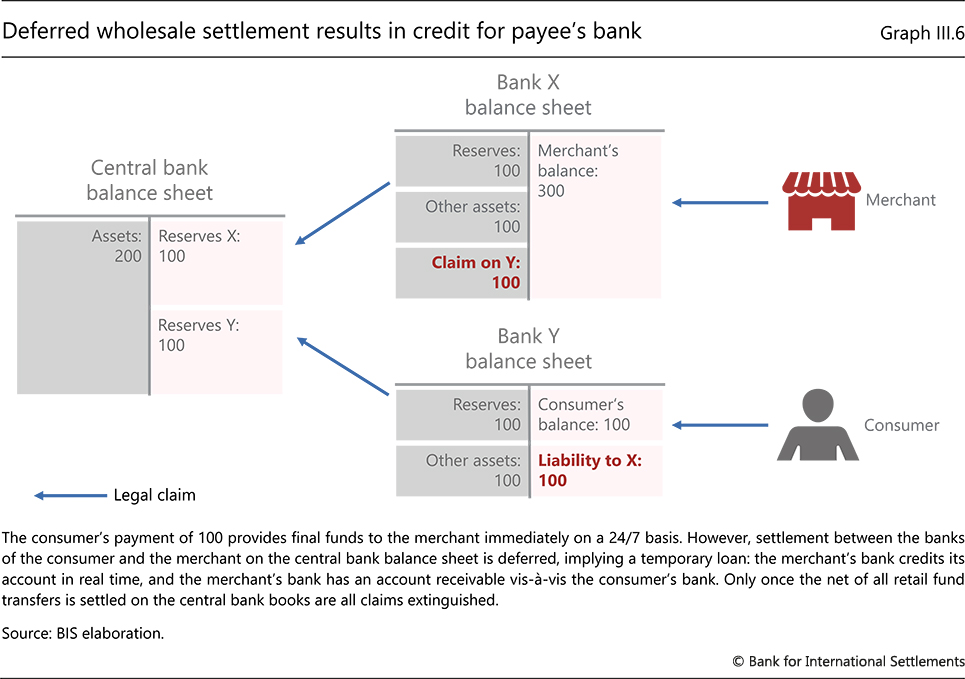
| III.6 | Deferred wholesale settlement results in credit for payee's bank | p 77 |
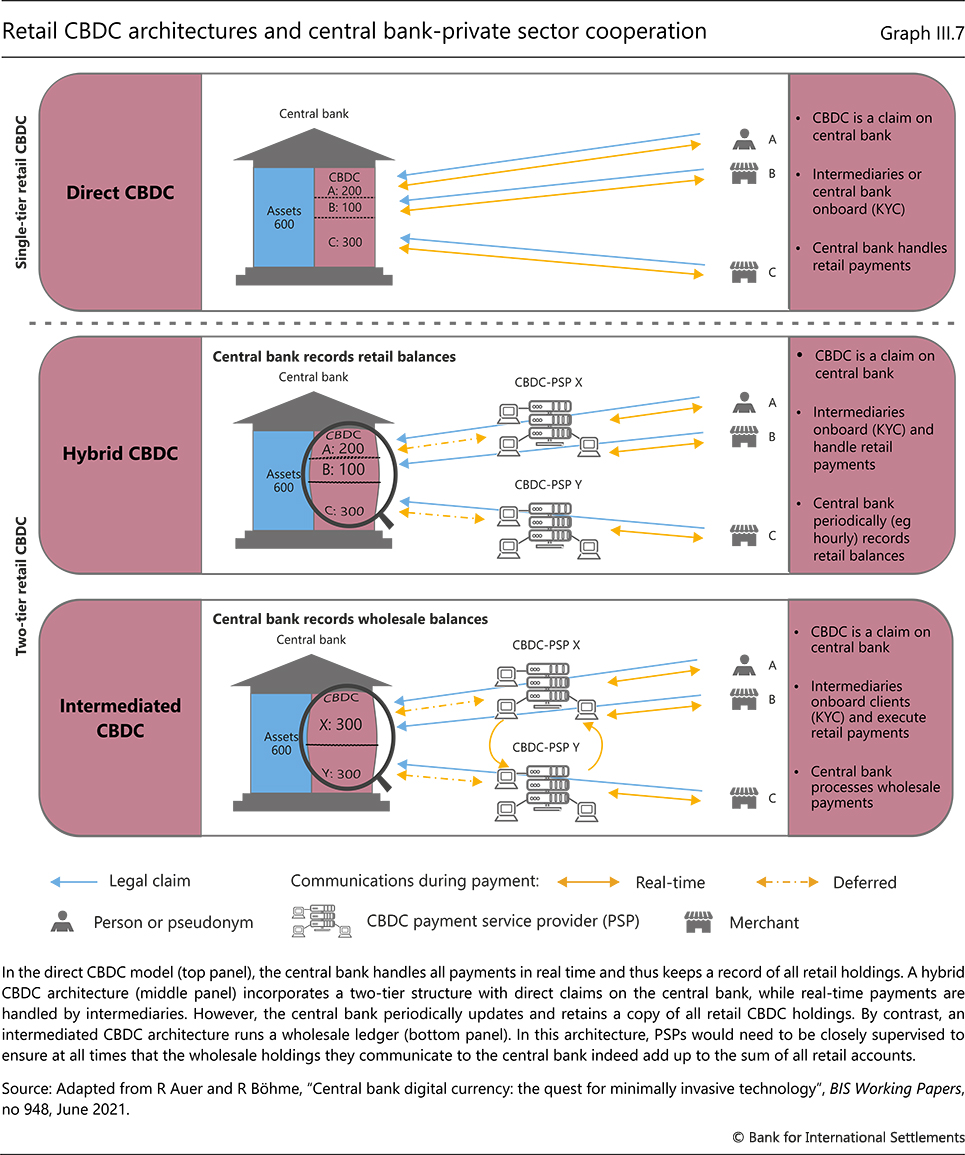
| III.7 | Retail CBDC architectures and central bank-private sector cooperation | p 78 |
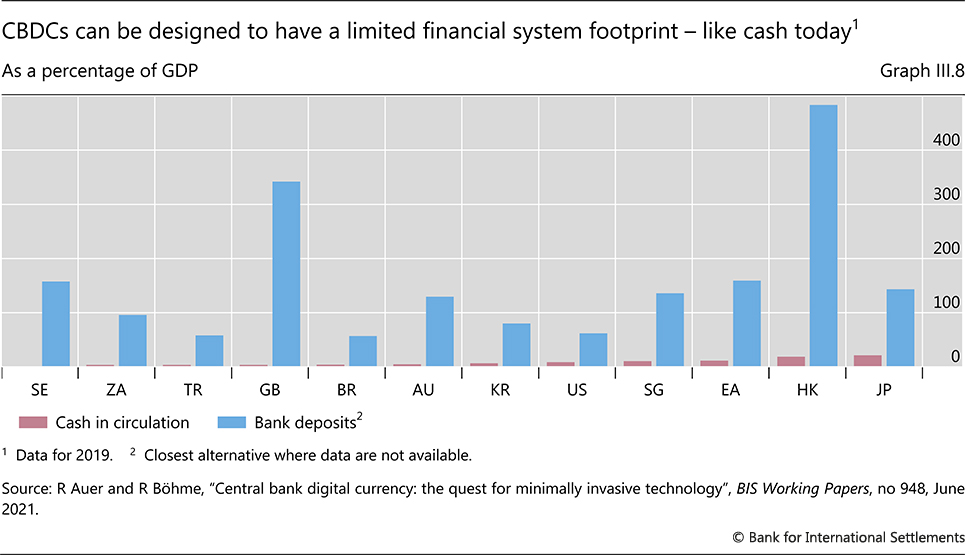
| III.8 | CBDCs can be designed to have a limited financial system footprint – like cash today | p 81 |
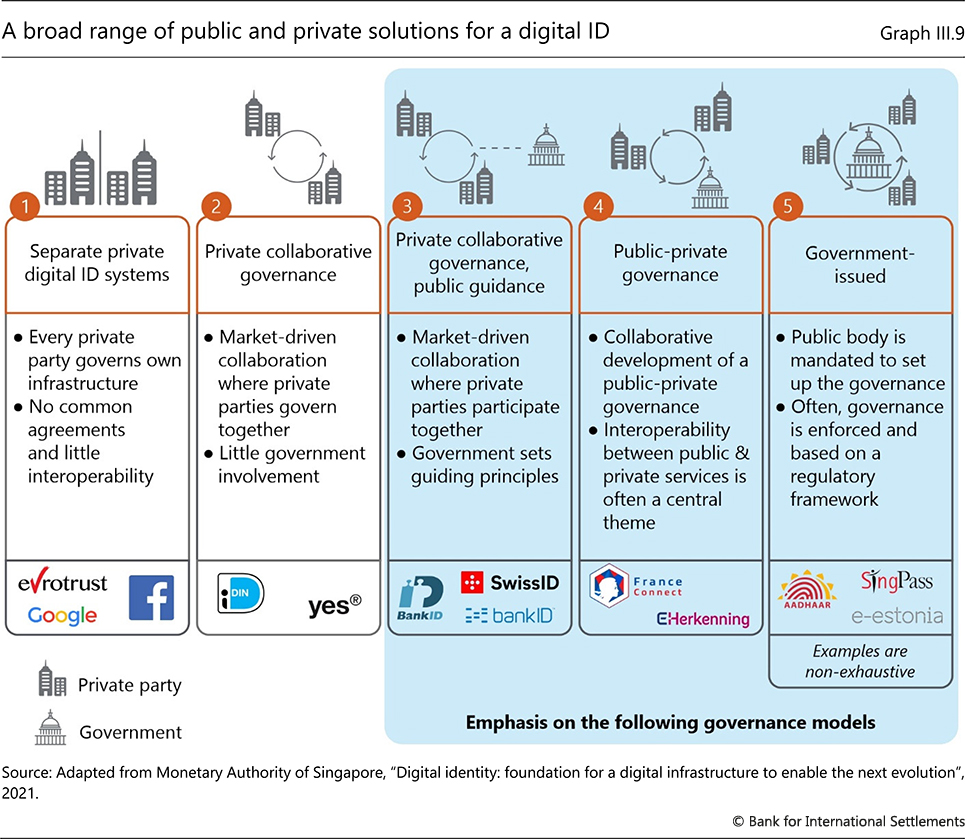
| III.9 | A broad range of public and private solutions for a digital ID | p 83 |
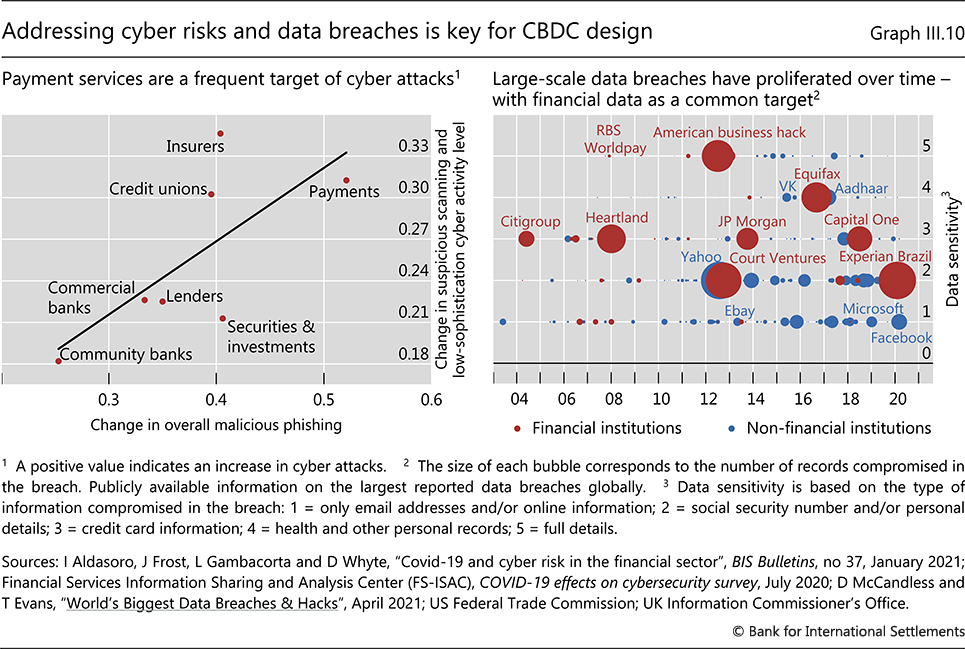
| III.10 | Addressing cyber risks and data breaches is key for CBDC design | p 84 |
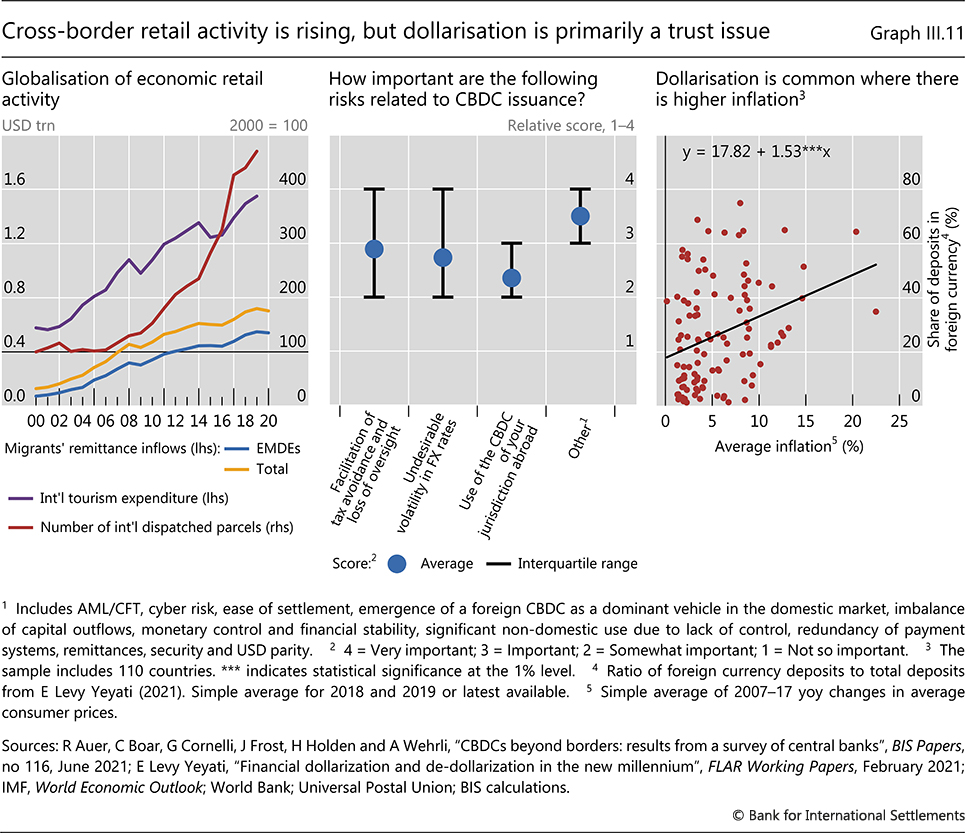
| III.11 | Cross-border retail activity is rising, but dollarisation is primarily a trust issue | p 86 |
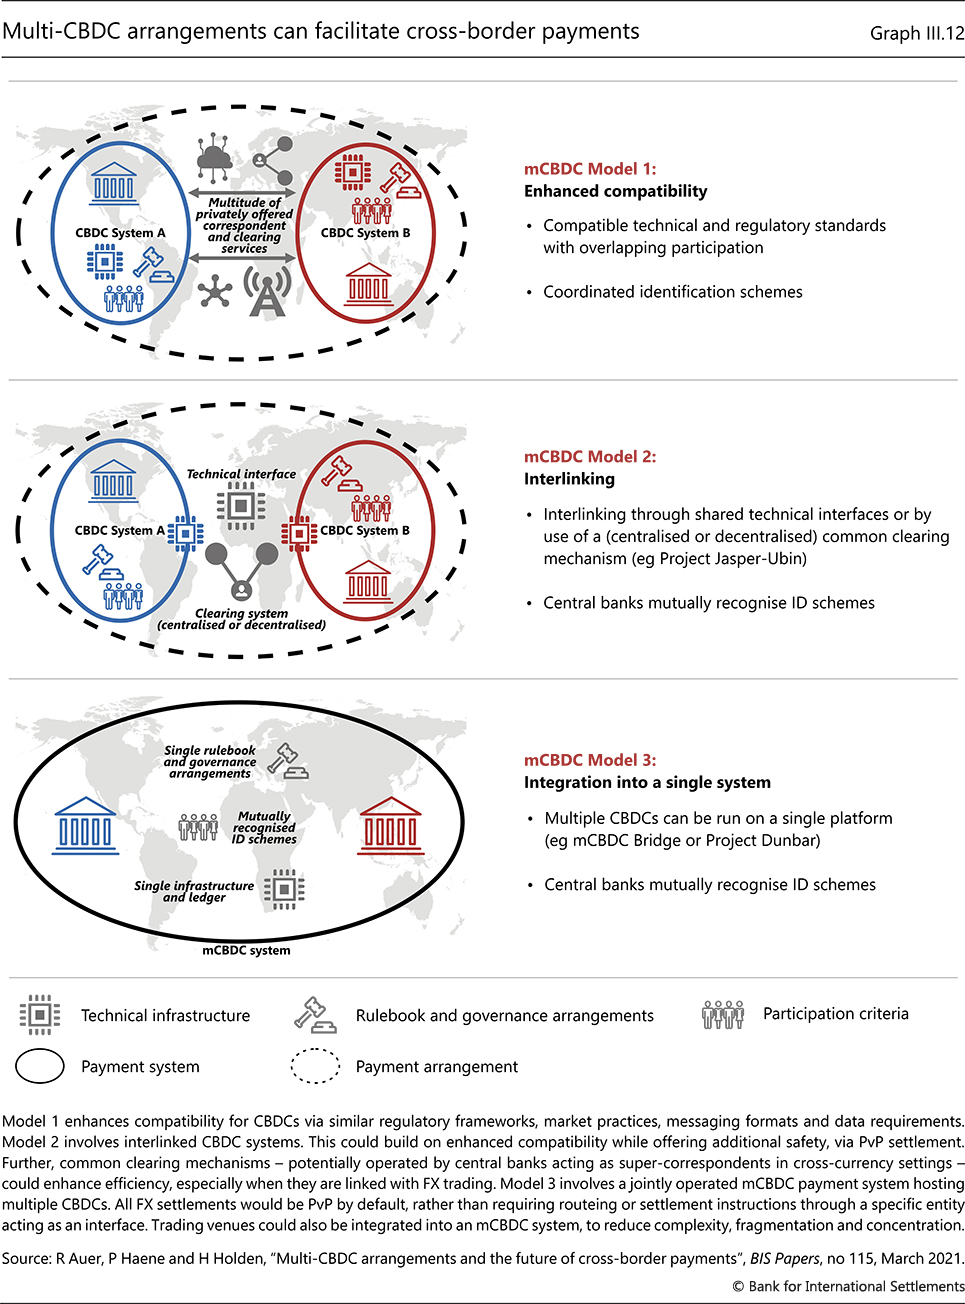
| III.12 | Multi-CBDC arrangements can facilitate cross-border payments | p 88 |
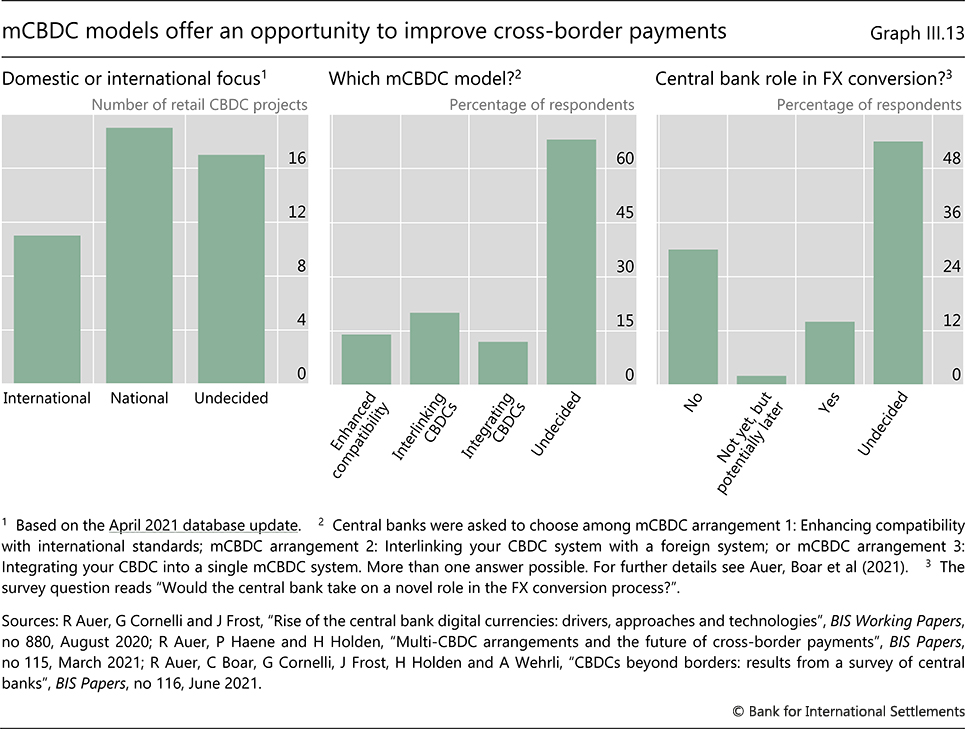
| III.13 | mCBDC models offer an opportunity to improve cross-border payments | p 89 |