I. A global sudden stop
![]() Watch the video (00:02:19)
Watch the video (00:02:19)
with Agustín Carstens, General Manager, and Claudio Borio, Head of the Monetary and Economic Department
Listen to the podcast (00:21:23)
with Agustín Carstens and Claudio Borio
Key takeaways
- This is not a normal recession but a sudden stop in order to prevent a public health disaster. The policy response therefore had to be different too. Monetary and fiscal policies cushioned the blow mainly by providing financial assistance to companies and workers. The purpose is to limit social distress and avert unnecessary bankruptcies that could hold back the recovery.
- Financial amplification threatened to turn a deep but hopefully short-lived contraction into a calamity as investors ran for safety. A massive and unprecedented response by central banks and other authorities prevented a financial collapse from compounding the drop in output.
- Emerging market economies faced a perfect storm. In addition to the health toll, they had to deal with the losses in activity from domestic containment measures, plummeting foreign demand, collapsing commodity prices and a sudden stop in capital flows.
- The strength of the recovery will depend on how the outbreak evolves and how much economic damage it leaves in its wake. Debt restructuring will be required as resources shift from shrinking to growing sectors.
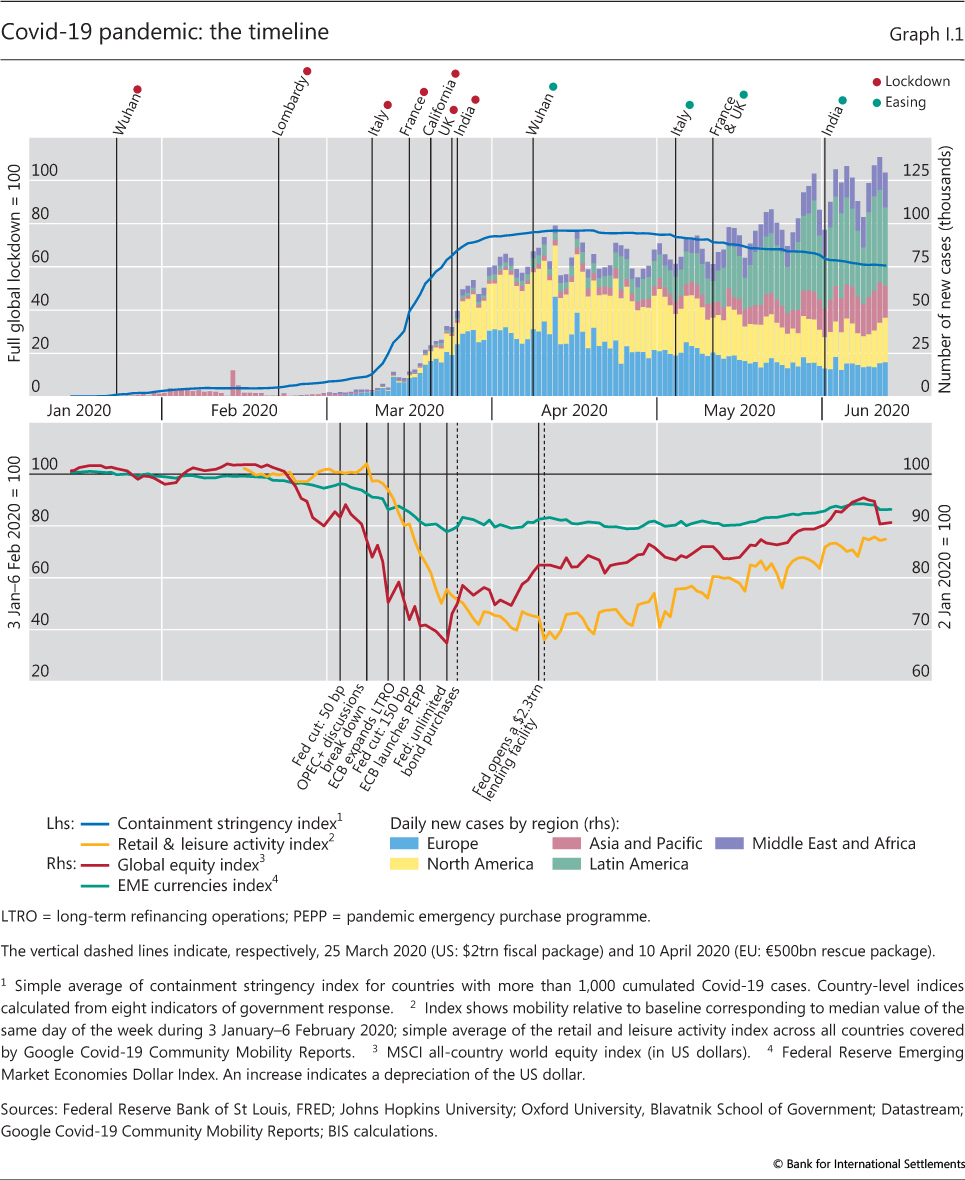
The Covid-19 pandemic is the most devastating shock to hit the global economy since the Second World War (Graph I.1). Policies to contain the virus have deeply undercut economic activity. The recession's unique character poses unfamiliar policy challenges. On the demand side, lockdowns and social distancing measures have not only triggered a sudden stop in spending but have also made it highly insensitive to policy stimulus. On the supply side, containment measures have directly hindered production, with the repercussions spreading through local and global supply chains. The overall damage could leave permanent scars if persistent unemployment and bankruptcies follow.
Financial markets were profoundly shaken by the pandemic. Heavy sell-offs across a wide range of assets and an abrupt tightening of financial conditions threatened to derail the economy further. Key funding markets seized up as market participants became unwilling or unable to take on risk. Financial amplification and disorderly global market dynamics returned with a vengeance, as in 2007-09. It took a global swift and broad-based central bank response on an unprecedented scale to stabilise the situation.
There is no parallel for this cocktail of economic forces. The economic damage is much greater than in previous epidemics. Except for the "Spanish flu" of 1918-19, these were locally confined, and even then containment measures were nowhere as comprehensive as the current ones. Past financial crises, disruptive as they were, yielded to known remedies. By contrast, tackling the 2020 recession has involved a balance between averting a healthcare disaster and maintaining a functional economy (Box I.A).
This chapter reviews the economic disruptions wrought by the pandemic. It begins by discussing the various mechanisms through which the outbreak caused a collapse in economic activity. It then looks at the financial system's ability to provide bridge financing to firms and households and identifies possible pressure points. The subsequent section focuses on the policy response. The final one looks forward and discusses possible near- and medium-term scenarios. Chapter II of this report investigates the response of central banks to the Covid-19 disruptions in more detail.
Box I.A
The Covid-19 pandemic and the policy trade-offs
A key question policymakers face in the midst of the pandemic is how to balance public health and economic considerations. Epidemiological research suggests that, without a vaccine or effective treatment, restrictions on social interactions are necessary to prevent the spread of Covid-19 from overwhelming public health systems and to save lives. But shutting down large parts of the economy has major costs as well.
Economists have sought to evaluate this trade-off in two ways. One is to convert health and economic outcomes into a common unit of analysis so that costs and benefits can be compared. One such study estimates that three to four months of moderate social distancing measures could save about 1.7 million lives in the United States, mostly the elderly, who are at greatest risk from the virus. Using the government's age-specific Value of Statistical Life (VSL) estimates (ie how much people are willing to pay for small reductions in their risks of dying from adverse health conditions), the study values the lives saved at over one third of US annual GDP. That said, VSL estimates can be much lower in other countries, tilting the balance in favour of less stringent measures.
The second approach to quantifying the benefits and costs of containment policy is to take account of epidemic and macroeconomic interactions using structural models. This approach combines a classic mathematical model of epidemics, the Susceptible-Infected-Removed (SIR) model, with a standard macroeconomic model that takes into account the death-associated probability (SIR-macro). A key insight is that, even in the absence of containment measures, households have an incentive to cut back social interactions and economic activities to avoid being infected. But these actions tend to be too minor because households do not internalise the effect of their behaviour on the overall epidemic and the health of others. This creates an externality and provides a rationale for containment policy.
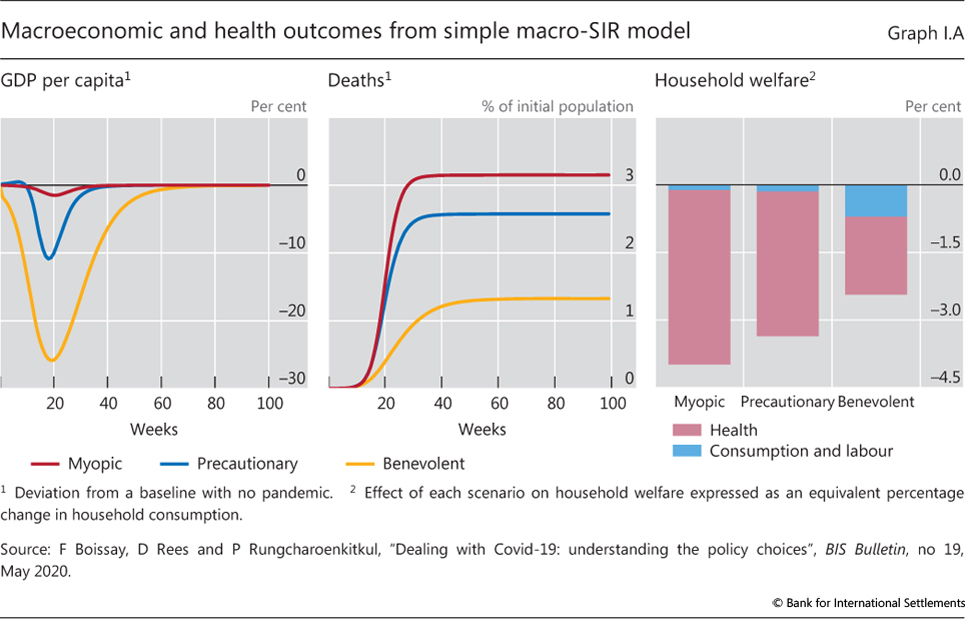
Calibrated SIR-macro models typically favour a containment policy that substantially restricts economic activity over milder voluntary social distancing - Graph I.A illustrates the simulations and welfare calculations of a simple calibrated SIR-macro model. The left-hand and centre panels show, respectively, the evolution of GDP per capita and mortality rates during a hypothetical pandemic. The "myopic" case (red lines) is where households do not change behaviour to avoid becoming infected. A relatively small decline in economic activity occurs largely because some of those infected are too sick to work. But the infection spreads unchecked and stretches the healthcare system so that eventually more than 3% of the population die. The "precautionary" case (blue lines) is where households consciously avoid being infected through voluntary social distancing, by working and consuming less around the peak of the epidemic. This lowers GDP, but also the number of infections and the death toll. The "benevolent" case (yellow lines) shows a socially optimal policy response, which takes all externalities into account. This involves a larger and earlier suppression of economic activity, slowing the spread of the virus and reducing the number of deaths even further. Household welfare is highest because the gains from less illness and mortality outweigh the short-term costs of lower consumption (right-hand panel).
The high degree of externalities differentiates the present pandemic from public health challenges such as limiting the costs of smoking or car accidents. There is little middle ground between effectively containing the virus and experiencing an uncontrolled outbreak. The benefits of stringent containment may be highly non-linear - they are substantial only when containment is implemented decisively enough. Without public coordination, individual actions are likely to be suboptimally small and to last too long.
At the same time, the macroeconomic costs of containment are likely grow with time and become more persistent the longer a lockdown remains in place, a possibility assumed away in most SIR-macro models. The destruction of organisational and human capital, from bankruptcies and layoffs, may inflict long-lasting damage on the economy and society. Keeping corporate bankruptcies to a minimum and averting a protracted slump is thus a key element in the overall evaluation. In countries with weaker social safety nets, the costs of prolonged lockdowns in terms of people's lives and livelihoods are likely to be much higher. These considerations, which highlight the complexity of the decisions facing policymakers, have yet to be incorporated into a coherent economic framework to inform the potential trade-offs between public health and economic activity.
This box is based on F Boissay, D Rees and P Rungcharoenkitkul, "Dealing with Covid-19: understanding the policy choices", BIS Bulletin, no 19, May 2020. See N Ferguson, "Impact of non-pharmaceutical interventions (NPIs) to reduce Covid-19 mortality and healthcare demand", Imperial College Covid Response Team, Report 9, 16 March 2020. See M Greenstone and V Nigram, "Does social distancing matter?", BFI Working Papers, March 2020. Moderate social distancing involves quarantine of symptomatic individuals and their households as well as stringent social distancing for those above 70 years of age. An SIR model captures the joint evolution of susceptible and infected population as well as the rest who have recovered from the disease. Recent papers incorporating an SIR model into macroeconomic settings include M Eichenbaum, S Rebelo and M Trabandt, "The macroeconomics of epidemics", mimeo, 2020; C Jones, T Philippon and V Venkateswaran, "Optimal mitigation policies in a pandemic", mimeo, 2020; and F Alvarez, D Argente and F Lippi, "Simple planning problem for Covid-19 lockdown", mimeo, 2020. The model is a modified version of Jones et al (2020), op cit. The calibration of epidemiological and macroeconomic parameters mirrors that in the literature. The cost of one death in an average household is conservatively set at five years' worth of consumption, compared with the 10 years' worth implied by the VSL analysis of Greenstone and Nigram (2020), op cit.
Economic activity plunged
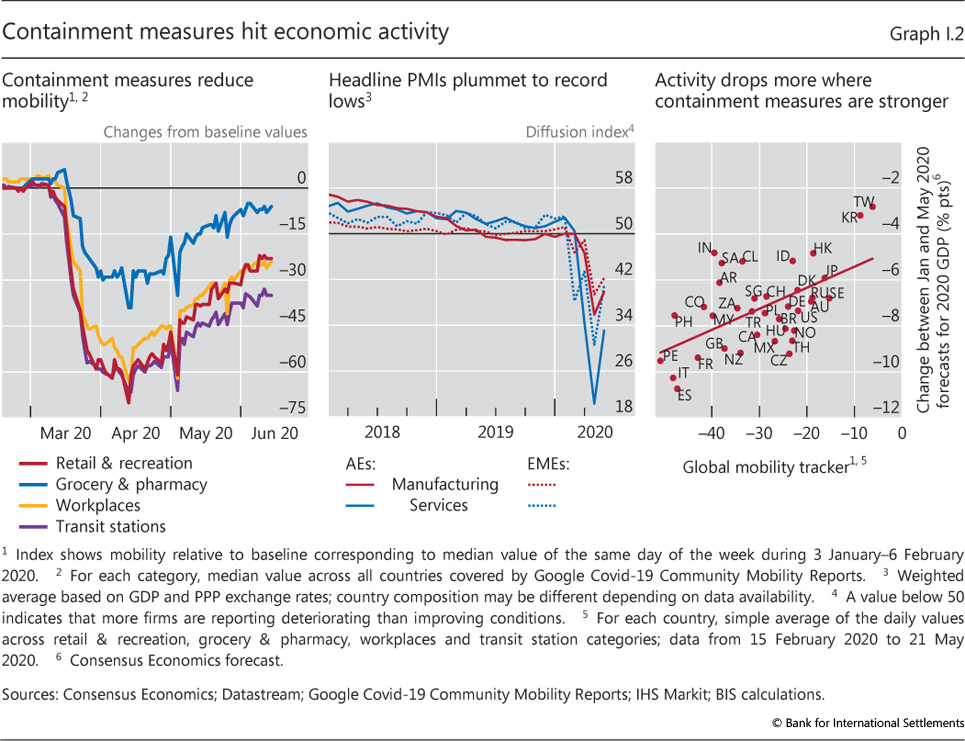
Global economic activity contracted sharply in March and April as policymakers forced an economic sudden stop. To contain the spread of the virus, authorities around the globe shut down some activities, mostly services that involve either large crowds or close human contact, such as entertainment, tourism, restaurants, retailing (other than necessities) and personal care (Graph I.2, left-hand panel). In addition, social distancing measures disrupted production in other sectors that require a high degree of collective activity on-site, such as manufacturing and construction. In manufacturing, disruptions also percolated along the (local and global) supply chain. Output may also have suffered if working from home reduced productivity.
Economic activity indicators plummeted. Purchasing managers' indices (PMIs) recorded new lows. The decline was steeper for the indices covering services, which are directly affected by social distancing (Graph I.2, centre panel).
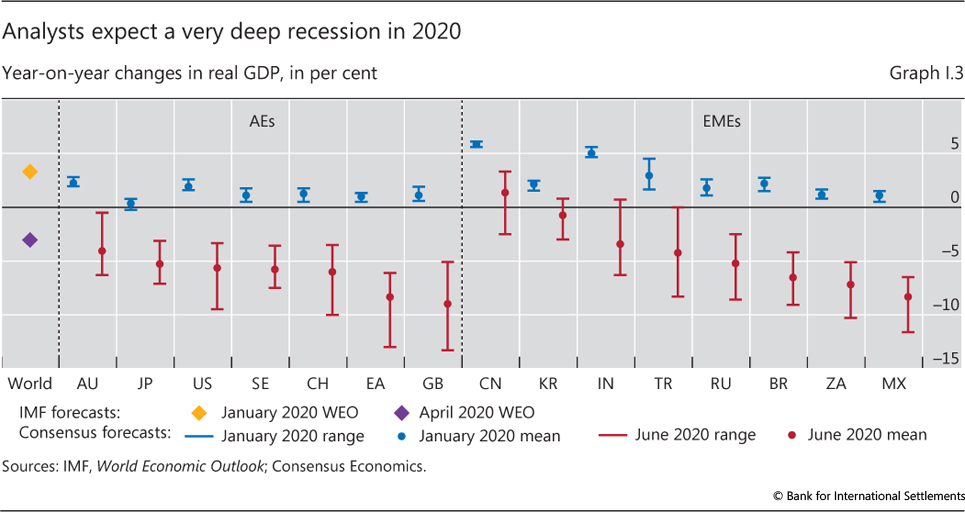
In many countries, the ensuing contraction was the largest swing in economic activity in living memory. Global GDP contracted by more than 10% in the first quarter of 2020, even though most countries imposed containment measures only towards the end of the quarter; forecasters expect a much larger drop in almost all economies during the second. The April 2020 IMF forecasts saw the global economy shrinking by 3% for the year as a whole, a downward revision of 6.4 percentage points from assessments made at the beginning of the year (Graph I.3) and far deeper than the slight contraction of 0.1% in 2009. Consensus forecasts for all major economies were also revised down substantially in the first months of 2020, in almost all cases to well below zero. The downturn also hit many more countries than in the wake of the Great Financial Crisis (GFC) of 2007-09. Revisions were larger in economies that put in place more stringent containment measures (Graph I.2, right-hand panel). Emerging market economies (EMEs) were particularly hard hit, given their typically less well resourced health systems and the constellation of economic forces (see below).1
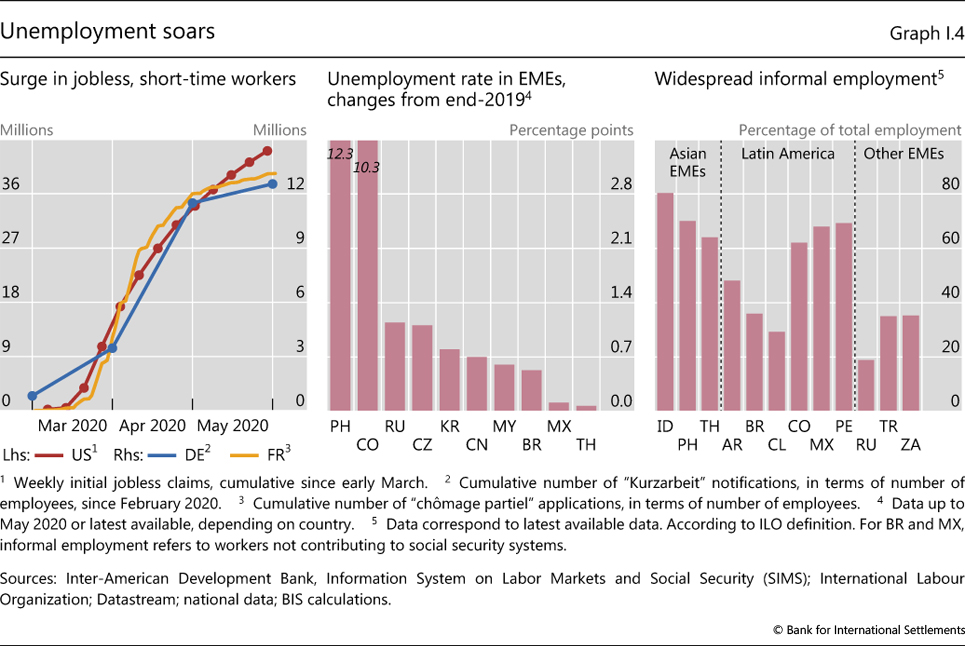
Consumption collapsed as the range of expenditure opportunities narrowed and economic prospects darkened. Many households saved more in response to high uncertainty about future income. Layoffs and wage cuts took their toll, with the blow amplified by the labour-intensive character of many of the services most affected. In the United States, for instance, over 40 million workers claimed unemployment benefits between March and June (Graph I.4, left-hand panel). In Europe, unemployment increased much less, although it would have been higher had it not been for special government schemes subsidising workers in employment.
In many EMEs, the large informal economy hid the true extent of the rise in unemployment. The moderate rise in the official unemployment rate in many EMEs since end-2019 (Graph I.4, centre panel) does not cover the informal sector, which accounts for a significant share of employment in many economies, especially in Latin America and South Asia (right-hand panel). These informal workers are vulnerable to losing their jobs, as they tend to concentrate in small firms or in some of the hardest-hit services. The International Labour Organization estimates that, in the absence of income support measures, the earnings of informal workers in the first month of the crisis would have declined by up to 81% in Latin America and 69% in Europe and Central Asia.2 In India, a local think tank estimates that some 90 million Indian workers, most of them employed in the informal sector as small traders and wage labourers, lost their jobs in just one month during the lockdown that began in late March.3
Depressed demand and high uncertainty also curtailed investment. Many firms cut capital expenditure and dividend payments to preserve cash holdings. Even so, simulations using firm-level data show that many firms have insufficient buffers to survive an extended shortfall in revenues without external support (Box I.B).
Box I.B
Covid-19 and the quest for lost revenues
The sudden stop in economic activity has sharply undercut corporate revenues, placing firms at the epicentre of the pandemic's economic fallout. Many firms face revenue reductions far beyond those typically experienced in recessions. Revenues have all but evaporated for some firms in the most shutdown-affected sectors - for example, air travel, restaurants, hotels and entertainment. Firms may not survive even if they use all possible levers to offset the drop, including drawing down liquid assets, rolling over debts coming due, borrowing new funds and cutting costs, particularly if the lockdowns persist for an extended period or activity recovers only very slowly.
The evidence suggests that the funding shortfalls - the additional funding needed to cover operating costs and interest expense - can be sizeable, up to about half a year's worth of revenues. This is the result based on simulations on firm-level balance sheets and financial statements for 33,150 firms from 19 major advanced and emerging market economies. Rolling over maturing debt and new borrowing can provide some relief. But even so, funding gaps remain. In many countries, government support equivalent to about two months of revenues would be needed to close the gap.
Gauging firms' funding gaps requires information about revenues and operating costs. The simulations are based on the assumption that firms' 2020 revenues either remain unchanged from 2019 or decline by 25% or fall by 50%, depending on how strongly the outbreak affects the sector. Revenues in the entertainment sector, for example, are assumed to fall by 50% and those in the utilities sector to remain constant. The cost impact is estimated for each industry based on the average relationship between changes in revenues and costs using data for firms over 2016-19. Unsurprisingly, these elasticities tend to be significantly below one, implying that lower revenues cause profit margins to shrink.
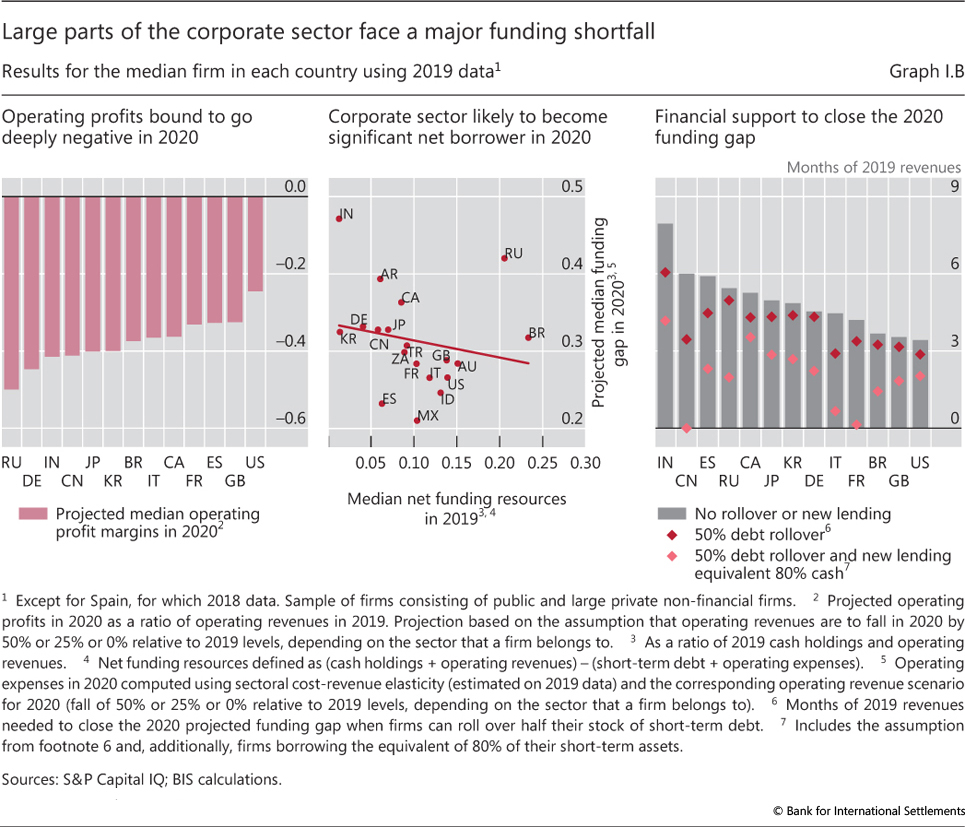
Based on these inputs, simulations show that a large number of firms are likely to face operating losses in 2020 (Graph I.B, left-hand panel). In all countries, the median firm would swing from comfortable profits (above 5% of revenues) in 2019 to losses well in excess of 20% of its 2019 revenues. Unsurprisingly, firms in countries with larger 2019 profit margins would face lower losses. But in some cases, this result could flip because of the sectoral composition of output. For instance, a severe revenue shock could drive Brazilian or Canadian firms deeply into the red, despite strong 2019 profits, mainly reflecting deep contractions in commodity sectors and, in Canada, transport equipment manufacturing. In Russia, oil looms large. In spite of strong profits in 2019, Russian firms could face losses in 2020 in excess of 40% of their 2019 revenues, reflecting the Russian economy's large exposure to oil.
Firms also need to continue serving their financial liabilities in addition to covering operational expenses. Given the extent of projected losses, liquid asset holdings could fall short of operating losses and debt service costs (Graph I.B, centre panel). Simulations suggest that the funding shortfall for the median firm could amount to 20% of the sum of operating expenses and debt service costs. In some countries, it could even reach 40%.
Large funding shortfalls suggest that firms will need financial support. This could take several forms. First, firms could ask for maturing debt to be rolled over. Second, they could borrow against their assets, even if these are temporarily illiquid. Lastly, they could benefit from grants, loan guarantees, direct loans or schemes such as furlough programmes, which reduce operating costs by covering part of the wage bill.
Such measures could make a big difference. For instance, in a scenario where firms cannot borrow and have to repay their maturing debt, the median firm in many countries would need public support equivalent to about six months of revenues (Graph I.B, right-hand panel). This would fall to an average across countries of two months of revenues if firms could roll over half the debt coming due in 2020 and borrow to the tune of 80% of their short-term assets.
These averages hide a large variation across countries. In some, such as China and France, rolling over debt and borrowing against short-term assets would allow the median firm to close the funding gap entirely. In others, such as Canada or India, where many firms belong to hard-hit sectors or where profitability in 2019 was low, firms would need significant additional fund injections - equivalent to four months of revenues - even if they rolled over debt and obtained new loans.
Trade credits/payables are assumed to be broadly balanced in the simulations.
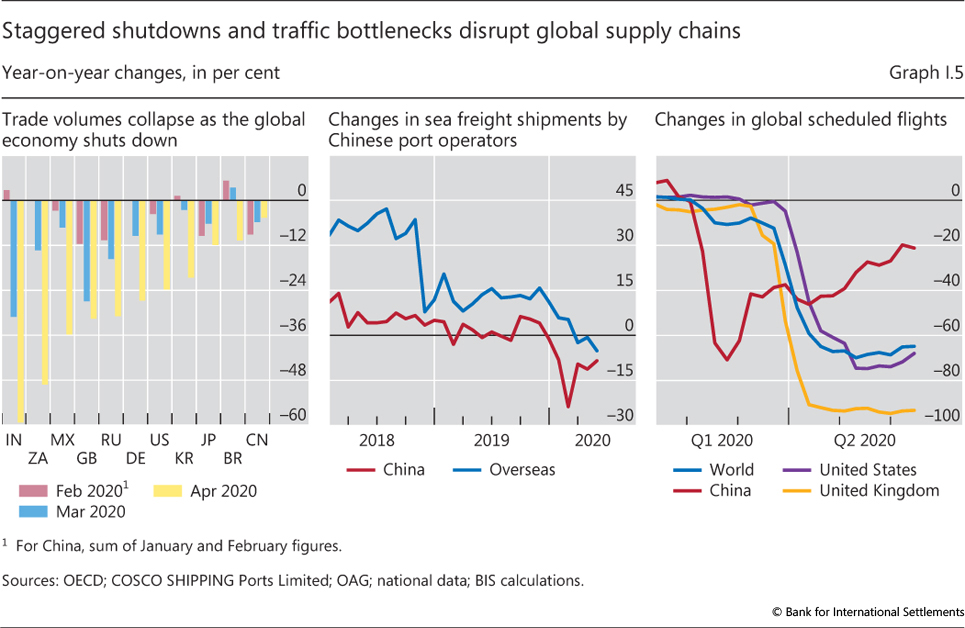
International spillovers from the various supply and demand disruptions worsened the blow. Global trade volumes fell sharply in early 2020 (Graph I.5, left-hand panel).4 The automotive industry was hit especially hard, given the large number of suppliers in production networks spanning several countries. As early as February, shortages of parts produced in China forced car manufacturers in Japan and Korea to temporarily shut down plants. And just when production of Chinese auto parts resumed in early March, containment measures in Europe and the United States forced many manufacturers to halt production and cancel orders placed with EMEs. Mexican parts manufacturers felt the full force of plant shutdowns in the United States, as over 85% of Mexican parts exports were US-bound in 2019.
Restrictions on international cargo and passenger transport were another source of disruption. Port closures and revised customs clearance procedures created bottlenecks in international sea freight. Major port terminals in China reported a 24% year-on-year decline in containerised sea freight in February 2020 (Graph I.5, centre panel). Bans on international travel depressed air passenger traffic. By mid-May, scheduled flights had seen a year-on-year decline of more than 60% globally (right-hand panel), with many routes completely shut down. This crippled air freight capacity.
The fear of contagion and travel bans depressed tourism. Popular new-year destinations for Chinese tourists, such as Thailand, were hit first, but within a couple of months global tourism came to a halt. Inbound tourism accounts for over 10% of GDP in Greece, Iceland and Thailand. Its share in employment is even larger. The United Nations World Tourism Organization predicts international tourism could contract by 60-80% in 2020.5
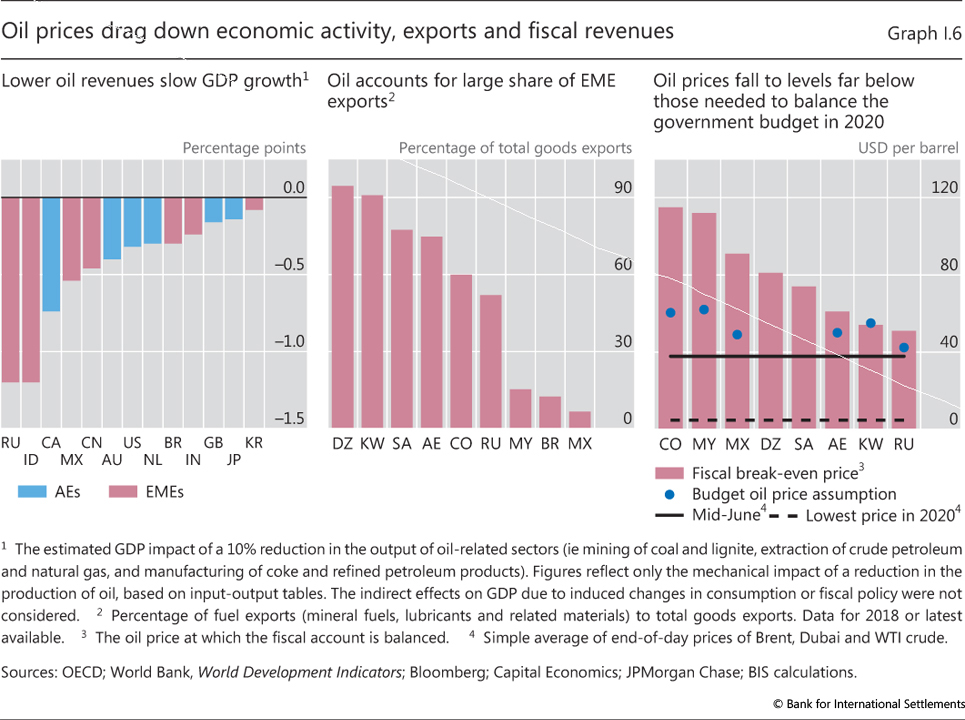
Commodity prices, especially the oil price, were another transmission channel. Lockdowns in China triggered a sharp drop in metals and energy prices in early 2020. A price war between two of the largest oil producers exacerbated the fall in early March, driving prices to a 20-year trough. An agreement in early April brought some respite. Limited storage capacity at a key petroleum hub in the United States even temporarily pushed the prices of some near-term futures contracts into deeply negative territory as investors refused to take physical delivery. Lower oil prices crippled economic activity, export and fiscal revenues in a number of oil-exporting advanced economies (AEs) and EMEs. For each 10% reduction in oil sector production, GDP growth can slow by up to 1.2 percentage points. The decline in oil prices will also lead to a sharp drop in the export revenues of oil producers and, in some cases, their fiscal revenues too (Graph I.6).6
Many low- and middle-income economies are also likely to be hit by a drop in remittances. The World Bank expects remittances to decline by around 20% in 2020. This can cause large economic and social costs.7 In addition, many migrant workers who lose their job may return home, adding pressure to local labour markets.
A financial sudden stop
The economic contraction conspired with the darkening outlook and high uncertainty to sharply tighten global financial conditions, threatening to further depress output. An early lockdown in China barely moved global markets. But as a new infection cluster emerged in Italy in late February, financial markets were rudely awakened. A tumultuous March followed as the virus spread rapidly around the world. Equity prices dived and spreads soared (Graph I.7, left-hand panel). Implied volatilities, already elevated, surged even higher, in some cases to all-time peaks.
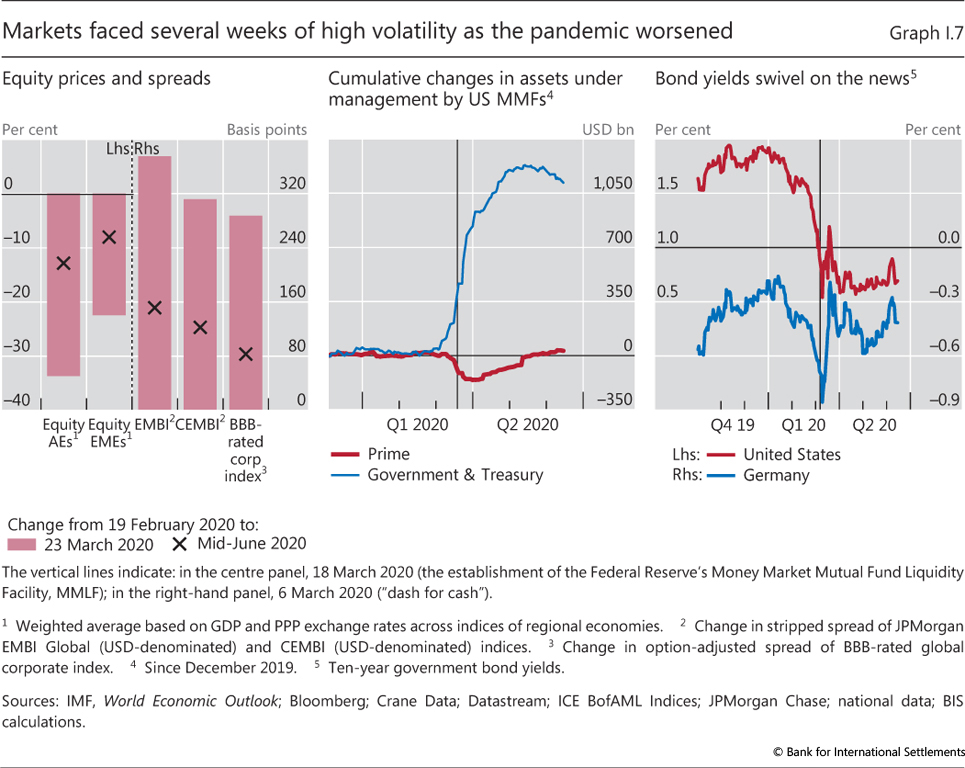
These market strains soon turned into a scramble for cash. Anticipating capital losses or the suspension of withdrawals, investors in US prime money market funds accelerated redemptions (Graph I.7, centre panel). By end-March, these funds, which invest in short-term bank and corporate paper, saw a wave of withdrawals to the tune of $160 billion, or roughly 15% of assets under management. At the same time, leveraged investors such as hedge funds were forced to liquidate positions to meet margin calls. This "dash for cash" intensified selling pressure on all asset classes, including US Treasuries. Long-term US Treasury and bund yields soared in mid-March, after having fallen to historical lows only a week before (right-hand panel).
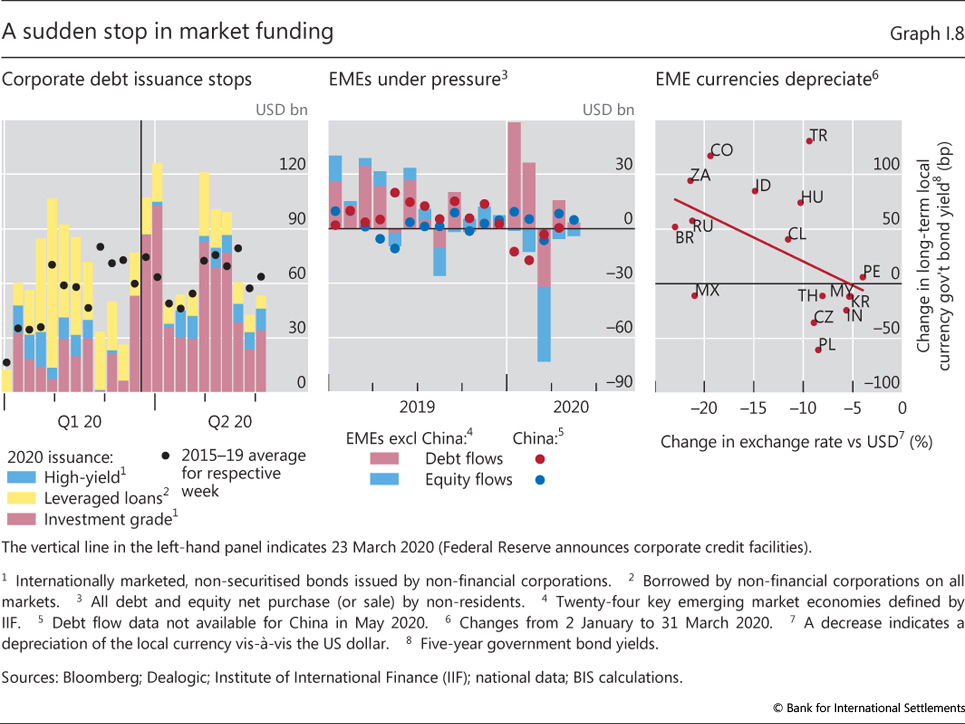
Corporate funding markets froze during the first half of March. From late February to March, the high-yield bond market effectively shut down (Graph I.8, left-hand panel). Conditions also deteriorated markedly in the leveraged loan and private credit markets. Weekly issuance of leveraged loans dropped well below the 2019 average, and collateralised loan obligation (CLO) issuance ground to a halt. The freeze affected even the investment grade corporate bond and commercial paper markets.
Retrenchment by global investors hit EMEs particularly hard. With threats to globalisation, commodity exports and global value chains - all fundamental to EMEs' great leap forward during the past 30 years - investors headed for the exit. In March alone, international investors withdrew more than $80 billion from EMEs (Graph I.8, centre panel), the largest single-month capital outflow on record. Some countries, eg Brazil and Poland, also saw net foreign direct investment (FDI) outflows. These outflows went hand in hand with a sharp depreciation of EME currencies, often despite significant FX intervention in the spot or, less often, the derivatives market (eg in Brazil, Indonesia and Mexico). In the first quarter, major EME currencies such as the Brazilian real, the South African rand, the Russian rouble and the Mexican peso lost more than 20% of their value against the dollar.8 The countries with the sharpest depreciation also saw large increases in domestic government bond yields as foreign investors, in particular, demanded a high premium to compensate for the lower dollar value of their investments (right-hand panel).
Market conditions stabilised only after central banks in both AEs and EMEs announced an unprecedented array of measures, going well beyond those adopted during the GFC. In addition to stabilising markets, the measures were designed to maintain the flow of credit to firms, households and even public entities. Interestingly, in many cases market conditions recovered well before the measures became operational. For example, the issuance of dollar-denominated corporate bonds bounced back right after the announcement of the Federal Reserve's credit facilities, two months before the central bank started actual purchases. Other funding markets, including those which were not directly targeted by the measures, reopened with a slightly longer delay.
By early June, market conditions had improved to the point of raising questions about whether they had not become disconnected from what was happening in the real economy. At the same time, many markets remained less liquid and less stable than at the beginning of the year. Equities in both AEs and EMEs had retraced about half of their previous declines; credit spreads had also narrowed somewhat. Capital outflows from EMEs eased in April and May, giving way to inflows in some economies. Yields on local currency bonds declined, often in response to central bank asset purchases.9 EME exchange rates stabilised, though at a significantly lower level than before the outbreak.
Financial pressure points
The financial market turbulence in February and March highlighted a number of pre-existing vulnerabilities that could amplify the crisis and complicate the policy response. At the same time, there were also some silver linings. The post-GFC regulatory reforms have made the banking system much more resilient, allowing banks to offset the shutdown of capital markets to some extent. Financial infrastructure too weathered the storm successfully, including normally invisible but no less crucial payment and settlement systems as well as central counterparties.
Fragile household and corporate balance sheets
High debt levels have limited the private sector's ability to make up for lost income with new borrowing. Credit to the non-financial private sector climbed from just over 120% of GDP just before the GFC to 144% at end-2019, but this aggregate hides much larger increases in some countries and sectors. A key factor explaining this diverse picture has been the long shadow of the GFC. In general, countries and sectors that were at the heart of that crisis have tended to deleverage, and the others to leverage up, with varying degrees of intensity.
This is the case for households. Deleveraging after the GFC has left household balance sheets in the economies most affected by that crisis in better shape than in 2008 (Graph I.9, left-hand panel, "high and falling" group). In combination with low interest rates, this has reduced debt service burdens (centre panel). By contrast, several other economies have seen rising debt-to-GDP ratios, notably a number of small AEs ("high and rising" group) and some EMEs, notably China. Debt service ratios in several of these economies have also gone up substantially, despite low interest rates.
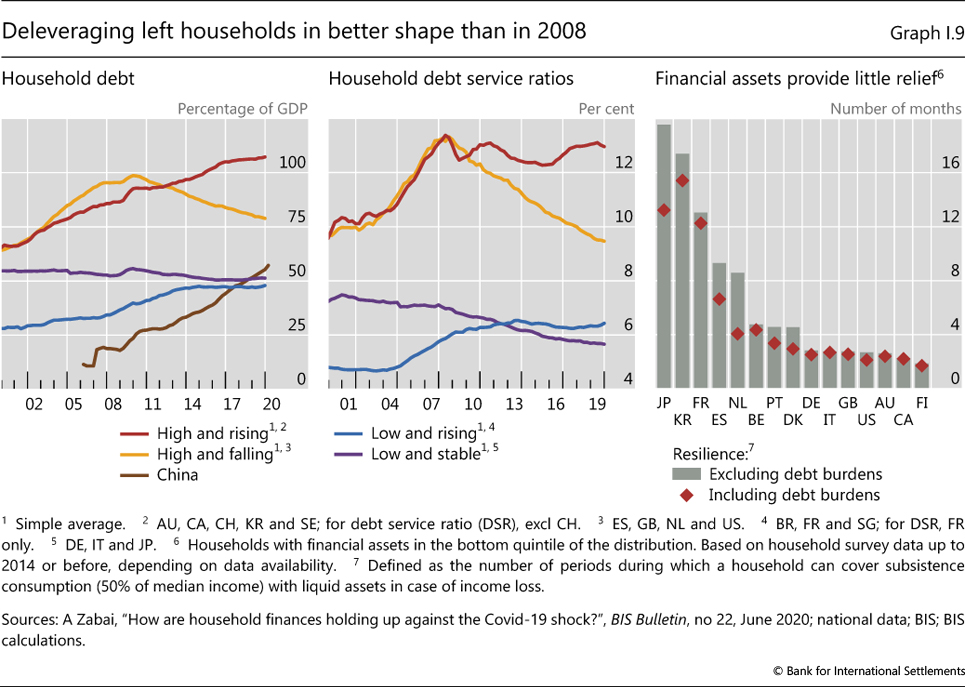
Selling assets could provide only partial relief for contractions in income. Most assets are illiquid, particularly housing, and are very unevenly distributed. Even in high-income economies, the buffers of households at the bottom of the wealth distribution cover only a few months of subsistence consumption (Graph I.9, right-hand panel). This number is even lower once debt service burdens are factored in.10 And while public sector safety nets, such as unemployment insurance schemes or wage subsidies, are typically well developed in high-income countries, those in low- and middle-income ones leave households more exposed. In low-income countries, high levels of poverty, informality and financial exclusion are key vulnerabilities.
The condition of the business sector, which was not at the heart of the GFC, has deteriorated significantly over the past decade. Corporate indebtedness has tended to increase in many countries (Graph I.10, left-hand panel), even as unusually low interest rates have helped keep debt service costs in check. Granted, some firms have built up large cash holdings, in part as they have shied away from physical investments. But even so, the cash holdings of many firms, even large ones, are small relative to the scale of the sudden stop they face (centre panel). Except in China, half of the companies held cash and equivalents of less than two months of 2019 revenues (centre panel). The cash buffers of smaller firms were of similar size. A recent survey revealed that about 60% of UK small and medium-sized enterprises (SMEs) held less than 12 weeks' cash in the bank.11

The Covid-19 shock is likely to be particularly challenging for SMEs. Smaller firms tend to be more important in sectors particularly affected by lockdowns such as hotels, restaurants or construction. They also rely more on internal financing and tend to have fewer external financing options than larger firms. For instance, in the United Kingdom more than 40% of small businesses have not borrowed at all in the last five years.12 The lack of banking relationships could therefore compound the difficulty of accessing external financing. Furthermore, the widespread use of real estate assets as collateral could prove a major drag on the availability of SME funding should property prices fall, even temporarily. In the light of these difficulties, many governments, for instance in Switzerland, have fully guaranteed SME loans in order to roll out support quickly.
Another corporate vulnerability is that the profits of many firms have not kept pace with growing indebtedness. While some firms have been exceptionally profitable, the share of those reporting losses or earnings barely sufficient to meet interest costs has increased in recent years (Graph I.10, right-hand panel). Consistent with this picture, credit ratings have tended to decline in many key jurisdictions.
The currency denomination of the debt is a further weak spot. As measured by the standard on-balance sheet residence-based statistics, the dollar debt of non-bank borrowers outside the United States rose to $12.2 trillion at end-2019. Of this, $3.8 trillion was owed by EME residents, mostly non-financial corporations (Graph I.11, left-hand panel). But the amounts are considerably larger once adjusted for borrowing through offshore entities and, to a lesser extent, through FX derivatives that require repayment of notional amounts (principal). Offshore borrowing has been substantial for a number of large EMEs, such as Brazil, China, India and Russia (right-hand panel).13 Adding to the vulnerability, the debt servicing capacity of EME corporates has weakened since 2010 due to a broad decline in earnings.14
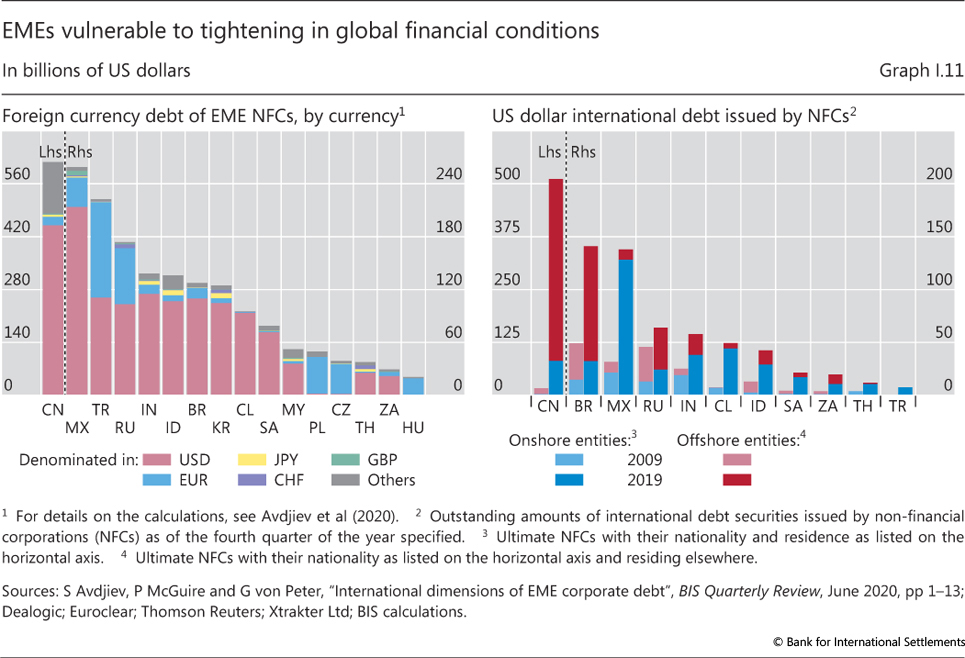
There is no comprehensive information on how much of this debt is hedged. That said, less developed derivatives markets typically limit the scope for financial hedges. "Natural hedges" through export revenues are more common. However, these may falter if export prices drop, as happened recently in the oil sector. Since half of total EME hard currency corporate debt is owed by state-owned enterprises, often oil firms, this can feed directly into the sovereign's balance sheet.
Fickle market funding
The growing reliance on market financing by many firms may exacerbate vulnerabilities. The outstanding amount of corporate bonds reached $16 trillion at end-2019, the bulk of which was issued by firms in non-investment grades and the lower buckets of investment grade. In addition, firms took on approximately $1.5 trillion in leveraged loans (syndicated lending for low-rated and more indebted companies) during 2019.15 Such loans are often held by investors through different investment vehicles, including credit funds, and more complex structured instruments such as CLOs. Banks typically provide funding to these investors and hold the higher-rated tranches. Last but not least, private credit - loans offered by non-bank investors with limited bank involvement - has also grown rapidly in recent years and has been disproportionately directed at firms at the lower end of the credit risk spectrum.16
The sudden stop in market funding in February and March highlighted a number of vulnerabilities related to this funding structure.
First, before the outbreak, heightened risk-taking and fierce competition among lenders had compressed spreads and loosened covenants, despite an increase in leverage.17 Less restrictive covenants, in particular, can result in much higher credit losses when the thresholds are finally hit. As a result, weak covenants increase investors' incentives to head for the exit.
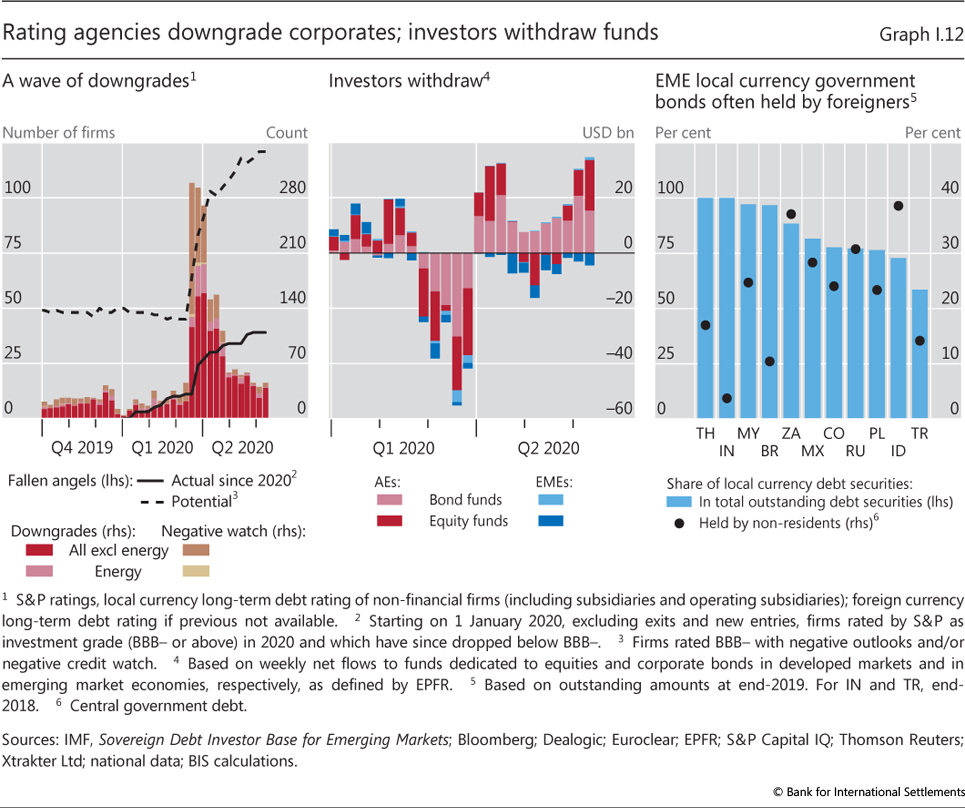
Second, the toxic combination of declining creditworthiness and investor retrenchment increased the pressure on fund managers to dump assets. By end-May, the number of downgrades and reductions in the rating outlook made by one of the major rating agencies had climbed to nearly 1,800, including 200 affecting firms in the energy sector (Graph I.12, left-hand panel). This represented well over one third of the rated non-financial corporate debt universe. Of particular concern are the so-called fallen angels - debt that drops out of investment grade and can no longer be held by most asset managers and institutional investors. In addition to US prime money market funds, mutual funds investing in corporate debt experienced sharp outflows (Graph I.12, centre panel), forcing them to sell. At the height of the sell-off, funds investing in AE and EME equities and corporate bonds lost approximately 15% of their net asset holdings in a single week.
Third, the repricing of risk by foreign investors in local currency bond markets once again resulted in a sharp tightening of domestic financial conditions in EMEs. EME domestic currency debt markets have grown substantially since the Asian crisis in the 1990s as a result of deliberate policies designed to reduce "original sin", the inability of EMEs to issue debt in their own currency (Graph I.12, right-hand panel). But while mitigating currency mismatching for the borrower, the shift has transferred it to foreign lenders, which tend to invest on an unhedged basis - "original sin redux". Since domestic yields tend to rise in tandem with currency depreciation, foreign investors lose on both positions, which amplifies their retrenchment. As the same mechanism operates in reverse during appreciations and capital inflows, it tends to amplify the boom-bust pattern in capital flows commonly experienced by EMEs.18
Banks withstand pressure
On the whole, banks were able to meet at least part of the increase in households' and firms' funding needs. This is particularly important because banks remain the main creditors of households and firms, notwithstanding the advance of capital markets. Bank loans account for the vast majority of household credit in almost all economies - the United States being a notable exception. Their share in corporate lending is lower, but still exceeds 60% in most AEs and EMEs. Thus, banks remain the first port of call for most firms seeking to bridge funding gaps.
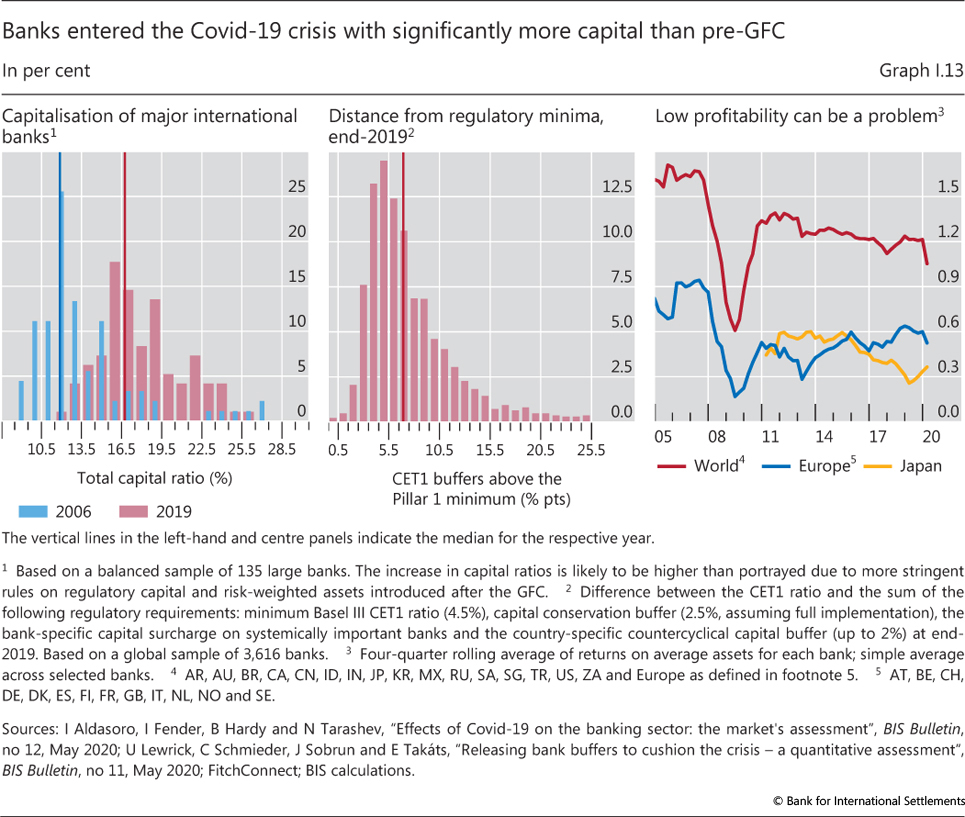
The post-GFC increase in banks' capital buffers (ie in excess of minimum capital requirements) should give some comfort that banks will continue to meet funding demands (Graph I.13, left-hand and centre panels).19 At the same time, banks' chronically low profitability in some economies could crimp their ability to expand their balance sheets. Over the past decade, the return-on-assets of European banks has rarely exceeded 0.5%, compared with an average of 1.25% for the world as a whole (right-hand panel). The share of non-performing loans also remains high in some countries. In Japan, bank profits have been even lower than in Europe, with a return-on-assets of only 0.3% in 2019. This is reflected in very low price-to-book ratios, in some cases languishing below one, which hinders banks from raising new equity capital.
Another vulnerability is the reliance of many banks on dollar funding. At $10 trillion, non-US banks' gross dollar liabilities at end-2019 are as high as before the GFC in late 2007. In 2008, European banks in particular found it exceedingly difficult to fund their dollar-denominated assets. The funding squeeze was ameliorated only after the Federal Reserve and other central banks put in place a system of swap lines: through these, non-US central banks could obtain US dollars and onlend to banks. While European banks have shrunk their dollar books and, consequently, dollar funding, Canadian, Japanese, Chinese and other EME banks have expanded theirs.20
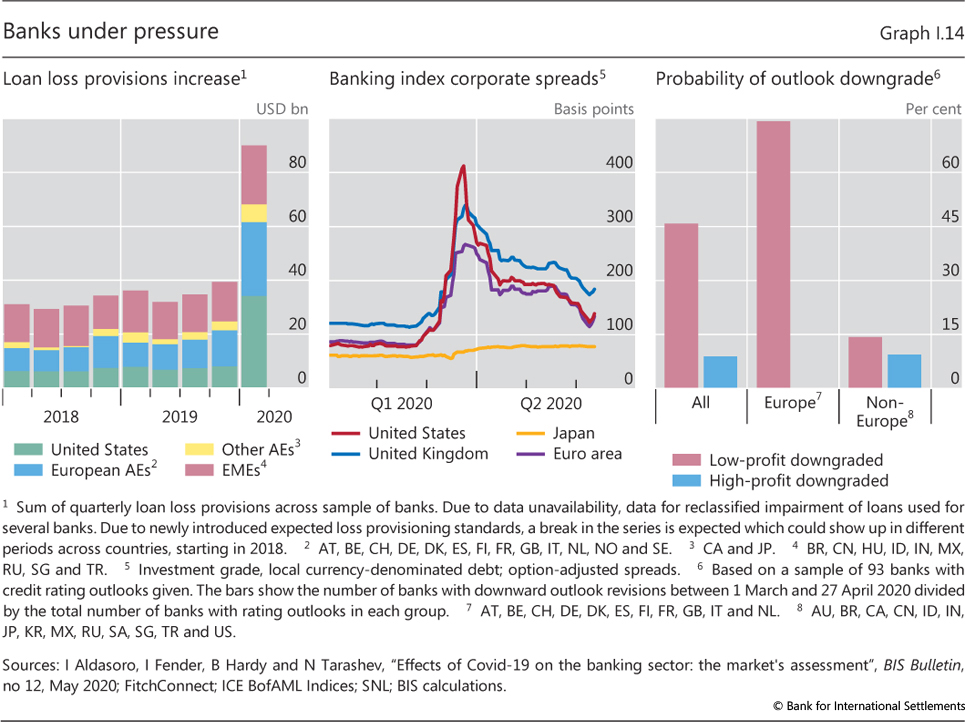
The Covid-19 shock has put banks under pressure on several fronts. The deterioration in credit quality has already forced them to significantly step up their loan loss provisions. Under the newly introduced expected loss provisioning standards, a rise in the mere probability of losses boosts provisions. In a sample of internationally active banks, US institutions increased provisions more than fourfold in the first quarter. European banks have been slower, with provisions doubling in the same period (Graph I.14, left-hand panel).21 Looking ahead, falling property prices could amplify losses. Market indicators suggest sizeable declines in many countries, especially in the prices of commercial properties for the sectors most affected by the lockdowns (Box I.C). On the other hand, banks' direct exposures to large firms in the heavily hit sectors such as airlines and oil firms appear limited.22
Banks have felt pressure also on the funding side. Spreads on bank bonds and commercial paper widened significantly in late February and March as rating agencies revised the outlook for many banks and US prime money market funds saw outflows (Graph I.7, centre panel). In their decisions, rating agencies appeared to attach significant weight to profitability.23 The agencies put almost half of the banks with profits below the median on negative watch, compared with fewer than 10% for those above (right-hand panel). The pressure was particularly acute for non-US banks relying on dollar funding.
Box I.C
Real estate markets in the wake of the Covid-19 shock
In contrast to the Great Financial Crisis (GFC) of 2007-09, real estate markets have not been at the epicentre of the recent financial earthquake. Even so, they matter for the eventual depth of the recession and the subsequent recovery. The construction industry is a major source of employment and demand for a broad network of suppliers. Real estate also constitutes a large fraction of household wealth, while mortgages and other commercial real estate-related lending represent a significant part of financial intermediaries' exposures. In summary, the health of the real estate market is important for the normal flow of credit through the economy and for financial stability. Real estate collapses have caused many past banking crises. Despite some increase in price co-movement across countries, real estate markets are still mainly driven by domestic factors. Yet the global reach of the Covid-19 shock may suggest greater co-movements than usual.
Actual real estate price adjustments are notoriously hard to measure and are observed with a lag. This is because assets are very heterogeneous and liquidity is low. And this makes it harder to gauge their response to the health emergency. The fact that real estate prices have increased at a brisk pace in recent years in many countries may represent a vulnerability. But since prices are also quite sluggish, very recent movements may be poor indicators of their future evolution.
Partly because of this, the prices of commercial real estate (CRE) investment vehicles may provide a more timely guide. This is the case for the highly liquid real estate investment trusts (REITs). A drawback is that they exhibit strong equity-like dynamics.
Investors anticipate large CRE price declines. In all the jurisdictions considered, the Covid-19 shock wiped out REITs' cumulative valuation gains over the last five years or more (Graph I.C, left-hand panel). As a comparison, broad-market stock indices at the peak of the crisis in early March had lost only the gains of 2019. Even when benchmarked against the performance of more directly comparable stocks such as cyclicals and small corporates, the losses between February and March were large. REITs have also lagged behind overall stock markets in the recovery that followed from April.
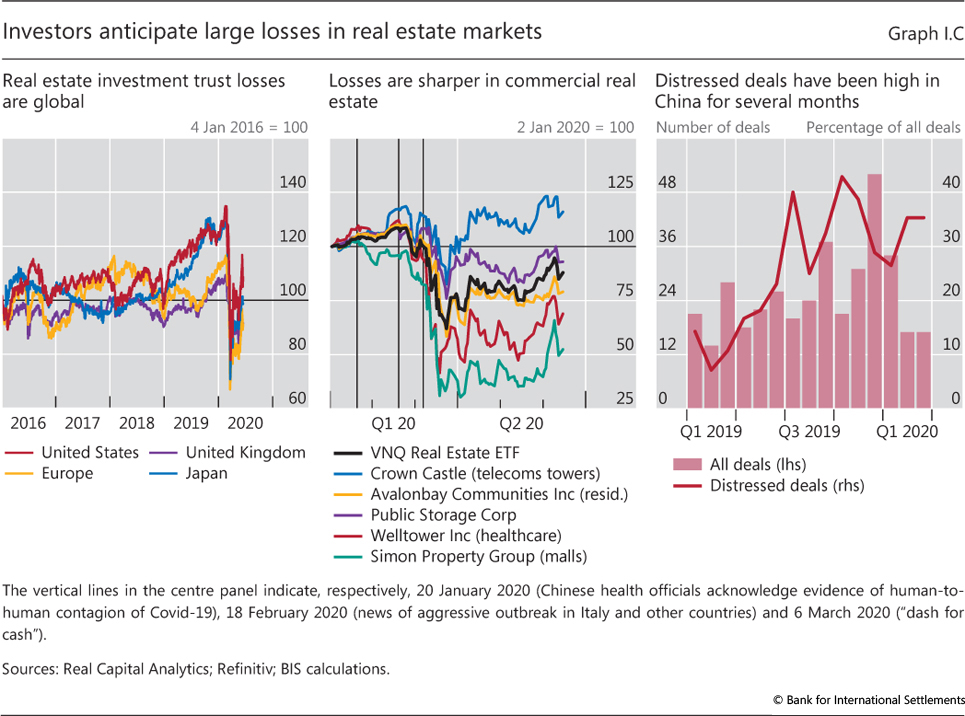
Valuation losses have varied widely across types of CRE. Segments such as shopping malls and retail space, which had been under pressure for some time and are more vulnerable to containment measures, suffered a deeper plunge in prices and a shallower recovery than broader portfolios of real estate assets (Graph I.C, centre panel). By contrast, the prices of REITs specialised in telecommunications towers and warehousing experienced shallower losses. REITs specialised in residential properties moved in lockstep with broader portfolios such as the VNQ Real Estate ETF.
Other signs of stress in CRE gradually surfaced in the United States and Asian markets during Q1 2020. Deals were called off, and the ranks of buyers began to thin. Under normal business conditions, CRE deals are abandoned only rarely. In the United States, cancellations as a fraction of closed deals in a given month had averaged 0.4% over the last five years, on a declining trend. But in March, that fraction soared to almost 1.5%. Moreover, delinquencies reportedly increased in April on US commercial mortgage-backed securities (CMBS), though from a low level. Not surprisingly, the sharpest increase came from the hotel sector. Some credit rating agencies expect overall delinquency rates in CMBS to approach GFC levels later in the year, and those of hotels and retailers may approach 30% and 20%, respectively, much higher than the GFC peaks. In China, property developers faced increasing difficulties in refinancing deals, in part because of regulatory tightening, and the fraction of troubled assets soared to 50% of the total market. In fact, in China, distressed deals - sales made by debtors or trustees that have taken control of the assets - have been high for some time, fluctuating around 35% from H2 2019 (Graph I.C, right-hand panel). Deal volumes in the Asia-Pacific region suffered a double-digit contraction in Q1 2020, mostly because of large deals being shelved. One has to go back to the GFC to find a similar contraction. Smaller deals were still going through, but market intelligence indicates that the situation has been growing increasingly brittle. Once again, volume drops were sharper in office and retail space, as well as senior housing and care. Industrial property fared relatively well, as manufacturing may lead the recovery this time around.
See Committee on the Global Financial System, "Property price dynamics: domestic and international drivers", CGFS Papers, no 64, February 2020. REITs are financial vehicles that pool resources from multiple investors with the purpose of acquiring a portfolio of real estate property, which the trust operates on behalf of its investors. REITs typically invest in apartment buildings, infrastructure, retail or office space, hotels, healthcare facilities, warehouses and other commercial property. Some REITs also specialise in providing mortgage credit. The investment vehicle has a global footprint. REITs are usually traded on regular exchanges, so they offer the liquidity of common stock. See Fitch Ratings, "US CMBS delinquencies projected to approach Great Recession peak due to coronavirus", 8 April 2020.
Last but not least, banks have faced pressure on the operational side too. Bank staff members were even more likely to be working from home than those in other industries. Anecdotal evidence suggests that major banks operated with only 10-15% of their staff in the office. This may have helped accelerate the withdrawal from risk-taking as traders exited risky positions for precautionary reasons.
Despite these pressures, banks were able to expand their lending to the real economy. In the United States, the volume of commercial and industrial loans expanded by 10% in March and 14% in April.24 In the euro area, loans to non-financial corporations rose by 2.7% in March and 1.6% in April, the fastest rate in over a decade.
Managing the fallout
Tackling the economic fallout of a pandemic requires a different policy prescription from dealing with a typical recession or financial crisis. During lockdowns, the priority is to ensure that households and (viable) firms survive the sudden stop in economic activity. In this phase, boosting private demand is not a priority, since spending tends to be rather insensitive to policy stimulus. Instead, the objective is to mitigate the impact of the economic standstill on firms' and households' cash flows. This is akin to providing a lifeline to a patient in an induced coma, to keep vital organs functioning. Moreover, it is important to prevent an abrupt reaction in financial markets that could undermine financial intermediation, amplifying the contraction.
The life support measures during the first phase should lay the foundation for the recovery once lockdown measures are lifted. On the production side, firms that retain their skilled workers and see a resumption in demand will be better able to ramp up production while, on the demand side, workers who keep their jobs and income can resume consumption. But even so, high uncertainty may hold back aggregate demand and the pace of recovery. Monetary and fiscal policy may thus need to be expansionary for some time to sustain the recovery.
High uncertainty complicates the policy response. Policymakers need to take decisions despite substantial uncertainty about the length and severity of the outbreak and its impact on people's lives and livelihoods. As a result, it is exceedingly hard to put together a holistic and robust plan. Policy tends to follow a step by step approach in which specific problems are identified and solutions put in place as the situation evolves. Deploying insufficient funds could cause widespread bankruptcies and layoffs, with large and persistent output losses. It may also disappoint financial markets and amplify retrenchment. However, policy space is limited. And firing too many bullets too soon could leave the authorities exposed should the infection re-emerge and the crisis be more prolonged than expected. Against this backdrop, clear exit strategies are essential to gradually phase out the exceptional measures.
Uncertainty also extends to which firms and which jobs will survive, especially during the early stages of the pandemic. This would call for immediate and broad-based support that would gradually give way to a more focused approach as uncertainty recedes. Allowing bankruptcies too early in the process could kill the drivers of tomorrow's growth, but delaying them too long and keeping unviable firms alive could slow the necessary structural adjustment. A related issue is whether offering firms loans or loan guarantees could give rise to "moral hazard", where recipients may act with less financial prudence in the future. This may be less of a problem at this juncture. However, keeping afloat firms that had taken on excessive risk prior to the pandemic could hamper economic recovery further down the line. This puts a premium on due diligence and mechanisms such as imposing suitable conditionality on state support programmes to lessen moral hazard issues. Yet another trade-off concerns assistance to large enterprises, which could protect the livelihoods of the large number of workers they employ. But large firms are not necessarily those with a brighter future. And focusing on them at the expense of smaller ones could kill off competition from new entrants and thus slow innovation and reduce competitiveness.
High debt levels are a further complicating factor. While borrowing helps to bridge income gaps, the debt burden may become unsustainable for some firms and households. Insolvencies seem almost inevitable. Experience suggests that promptly cutting excess capacity and restructuring debts tends to produce faster recoveries than a more gradual approach.25 But a surge in bankruptcy proceedings could overwhelm the system's restructuring capacity, not least if courts become congested.
Central banks as crisis managers
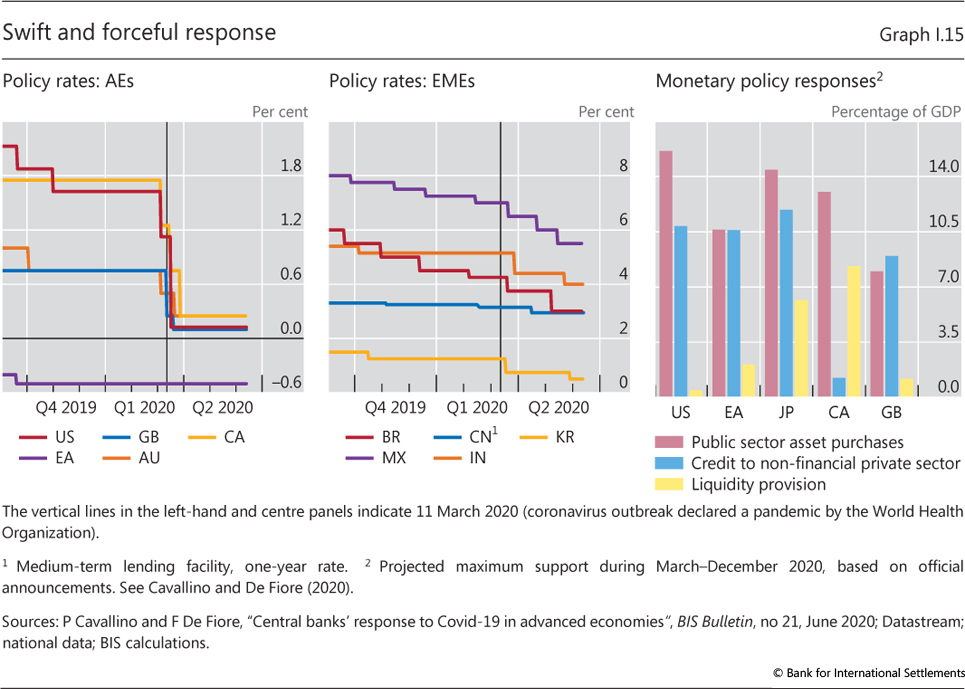
Monetary policymakers were the first to react. Central banks promptly cut their policy interest rates once a pandemic became a distinct possibility, to pre-emptively ease financial conditions and cushion the blow (Graph I.15, left-hand and centre panels). As the situation deteriorated and financial market turmoil ensued, central banks introduced a myriad of additional emergency measures to stabilise financial markets and restore confidence (Table I.1). They stepped up easing measures, in some cases taking policy rates to the effective lower bound, and introduced open-ended asset purchase programmes to unclog market-makers' balance sheets and restart issuance. And as dislocations in domestic and dollar funding markets became apparent, central banks injected liquidity via open market operations and standing facilities, and extended US dollar swap lines.
While most of those measures have by now become standard in crisis management, the current challenges forced central banks to expand their playbook. In particular, given the shock's unprecedented scale and nature, they offered lifelines to businesses in distress, by either purchasing debt outright (eg bonds and commercial paper) or providing backstops to banks (eg in the form of funding-for-lending schemes), especially in the case of SMEs (Graph I.15, right-hand panel). In the process, central banks went down the credit rating scale, sometimes below investment grade. In at least one case - the United States - the central bank extended support to local authorities. Taken together, these programmes are set to expand their balance sheets further.26
Naturally, there were differences across countries. In particular, EMEs have had less room for manoeuvre, given their structural vulnerabilities and the multiple shocks hitting them. Even then, many could reduce interest rates and reserve requirements, and, for the first time, implement measures to support firms and mitigate stress in domestic currency bond markets. This is testimony to the much improved monetary frameworks in place, complemented by the active use of FX reserve management and macroprudential measures.27
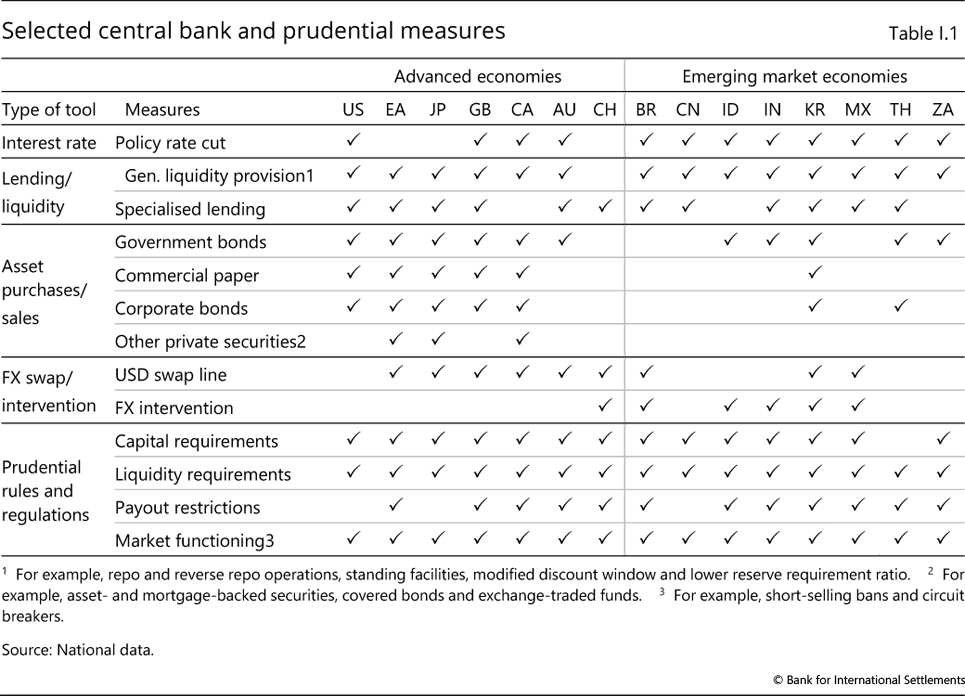
Prudential measures to enable banks to meet increased funding demand supported monetary policy actions. The overall strategy was to release the buffers that banks had been required to accumulate in good times and to ease or adopt more flexible interpretations of minimum requirements and loan classifications (Table I.1). In addition, a number of authorities imposed various restrictions on distributions, notably dividend payments.28
Crucial as they have been, central bank responses have a fundamental limitation. They provide temporary financing, but cannot transfer real resources. As such, they all generate additional debt and can only help borrowers survive if the income loss is not too large. For much the same reason, some borrowers run the risk of shifting the problems to the banking sector should that income loss become too large.
Fiscal responses to the coronavirus crisis
This points to the dual importance of fiscal policy. First, it can act as backstop to the extraordinary measures central banks have taken. Governments can provide partial or complete indemnities to facilitate central banks' funding for less creditworthy firms. This can help to clarify the dividing line between monetary and fiscal policies as well as free central banks to concentrate on their mandate.29 Second, and more importantly, fiscal policy can transfer real resources to firms and households, to ease income shortfalls. This, of course, is in addition to the resources needed to directly tackle the health emergency in the first place.
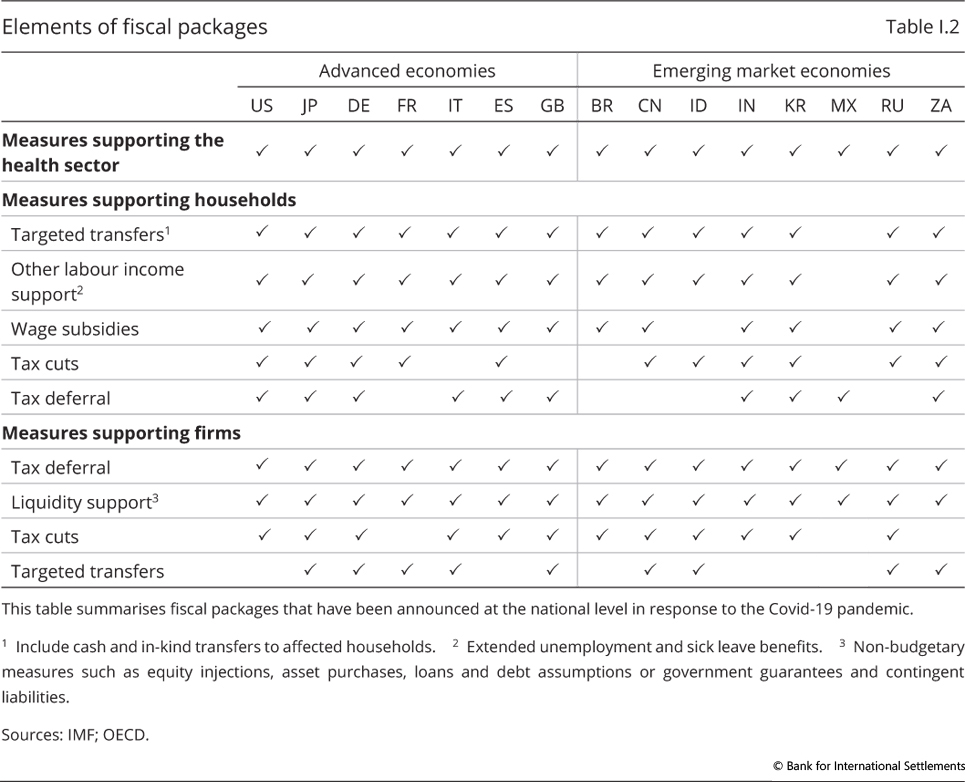
As the coronavirus emergency intensified, governments around the world sprang into action and announced large-scale fiscal packages. The packages generally consisted of a mixture of outright transfers (eg through income support, expanded unemployment insurance schemes, wage subsidies and tax rebates/waivers), bridge financing (eg tax deferrals and loans) and contingent resource transfers (eg equity injections and loan guarantees). The measures complement each other in protecting household livelihoods and in helping companies survive cash flow problems (Table I.2).
Many fiscal measures involve the outright transfer of resources to households and firms. Reflecting the urgency of the situation, many authorities took a blanket approach, offering tax waivers or cash grants to all residents, while some targeted those most affected by the shutdowns. For example, several AEs increased and extended the coverage and duration of unemployment benefits. But even so, this left significant groups of the population in dire straits - for instance, young people about to enter the labour market or many self-employed workers. In many EMEs, where a large part of the population works in the informal sector and cannot be easily reached, governments expanded their social assistance programmes to shelter the most vulnerable (Box I.D). Some governments also provided subsidies to particular industries considered vital to the economy.30
Governments also used a variety of tools to provide bridge financing. They deferred business income tax payments and, in some cases, personal ones too. In addition, several countries enacted standstills on various types of loan, although these are not necessarily fiscal measures in the strict sense. Some governments also provided funding directly or through their development banks.
Box I.D
Cash transfers to support informal workers in emerging market economies
To support informal workers during the lockdowns, some EME governments have extended existing cash transfer schemes, increasing or front-loading disbursements. However, existing conditional cash transfer programmes are unlikely to be sufficient: a significant share of informal workers have incomes above national poverty lines and are therefore ineligible. For that reason, many governments have introduced new measures, including one-off unconditional cash transfers to informal workers in Argentina, Peru and Turkey; two-month transfers in Colombia and the Philippines; three-month transfers in Brazil, Chile and Thailand; and a six-month transfer in South Africa.
The payouts of the programmes range from 13 to 60% of the monthly minimum wage (Graph I.D, left-hand panel). In many cases, this is less than the average monthly labour income earned by informal workers as reported in national income surveys (right-hand panel). Countries with less fiscal space tend to offer less generous benefits (eg Chile, Colombia and South Africa). The estimated cost of these programmes (in annualised terms) ranges from 0.3% of GDP South Africa to 7.4% in the Philippines.
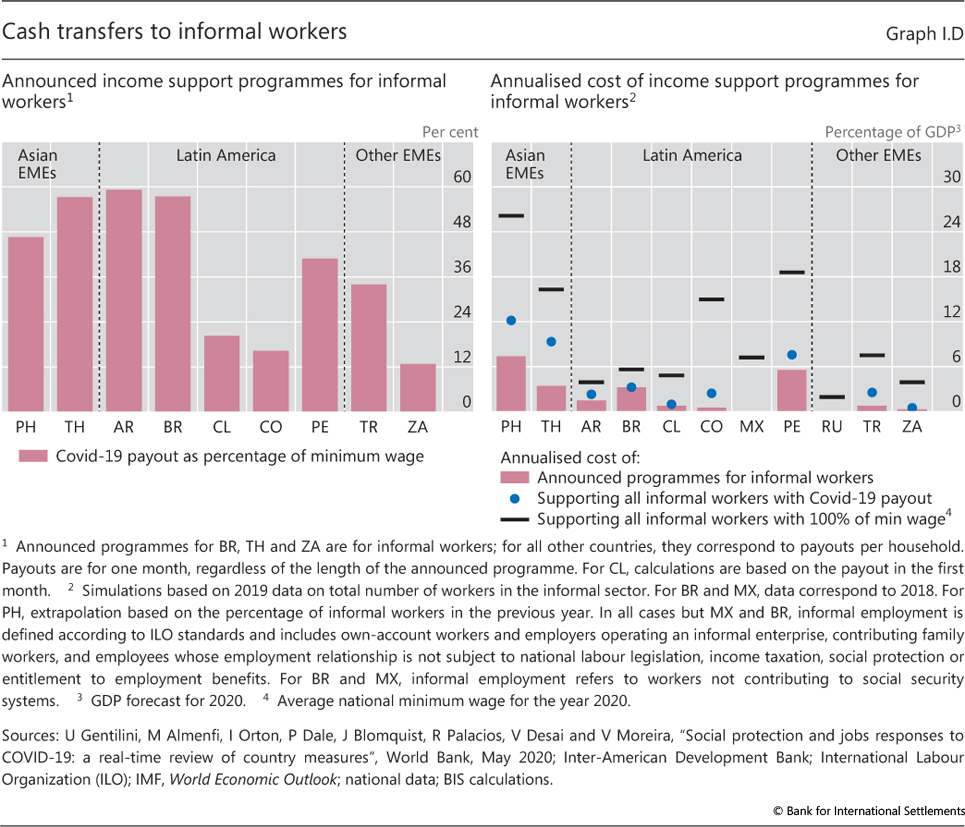
The programmes' reach is extensive in some countries, but an important challenge is to identify those who are eligible. To identify the targeted population, some countries are relying on national tax and ID databases, registries from other existing social assistance programmes, and online platforms for application by the public. Eligibility criteria vary: in some cases, they exclude workers who are currently benefiting from existing cash transfer schemes and other social assistance programmes; in other cases, they allow workers to receive more than one benefit. Caps on income are also part of eligibility criteria. To prevent fraud, some countries cross-check applications with social security, unemployment insurance and tax authority databases to verify that beneficiaries have no formal employment. Yet it is unclear to what extent these programmes are reaching the targeted informal workers.
It is an open question whether current disbursements provide enough relief. A key issue for policymakers is how large the payout should be and for how long it should be provided. Virus containment measures may last longer than expected or, even if they are relaxed, they may have to be reimposed. The recovery may also be shallower and slower than expected. Of course, any additional relief is limited by the available fiscal resources. A back-of-the-envelope calculation suggests that if income support were to be increased to cover all informal workers at the announced monthly payout, the expenditure would range (in annualised terms) from less than 0.5% of GDP in South Africa, where payouts are less generous, to 3.2% of GDP in Brazil and over 12% in the case of the Philippines, where the payout is relatively generous and the informal sector very large. Alternatively, if the cash transfers were to be raised to pay all informal workers the current minimum wage, the expenditure (in annualised terms) would range from 2% of GDP in Russia, a country with a lower informality rate, to 19% of GDP in Peru and over 25% of GDP in the Philippines, which both have large shares of informal workers.
Conditional cash transfers in Latin American and Southeast Asian countries have a long history. The best known include Bolsa Família in Brazil, Familias en Acción in Colombia, Prospera in Mexico (formerly Progresa-Oportunidades) and the Keluarga Harapan programme in Indonesia. Cash transfer programmes have not been used as often in emerging Europe. According to the International Labour Organization, informal employment includes all jobs in unregistered and/or small-scale private unincorporated enterprises that produce goods or services meant for sale or barter. This computation only takes into account the specific payout to informal workers, and does not include other social assistance policies that are implemented concurrently and may also benefit the same household, such as increased disbursements from existent cash transfer programmes, health insurance, in-kind food and vouchers. For a detailed list of social assistance measures, see U Gentilini, M Almenfi, I Orton, P Dale, J Blomquist, R Palacios, V Desai and V Moreira, "Social protection and jobs responses to Covid-19: a real-time review of country measures," World Bank, 15 May 2020. For example, in Latin American countries the monthly labour income of informal workers ranges from 85% of the minimum wage in Colombia and Peru to 125% in Brazil and Chile. Annualised figures are computed assuming that every scheme lasts 12 months. Coverage and details about programmes are available from national sources and Gentilini et al (2020), op cit.
To help restore business confidence and allow companies to raise funds, many governments also introduced credit guarantees. In particular, these were essential to induce banks to keep lending. Since the cost of the guarantees is recognised in the budget only if and when the loans default, such measures are also politically attractive.31 More importantly, governments could be compensated for the risks associated with the guarantees through fees and stock warrants.32
The size and scope of the packages announced thus far are unprecedented. The sum of crisis-related outright transfers, put in place up to early June, amounts to around 10% of GDP in AEs (Graph I.16, left-hand panel). And the total amount of bridge financing and contingent resource transfers, if fully utilised, could represent over 30% of GDP in Germany and Italy (right-hand panel). How much of this will actually be utilised depends on the duration of the shutdown, the conditions attached and the pace of recovery.33
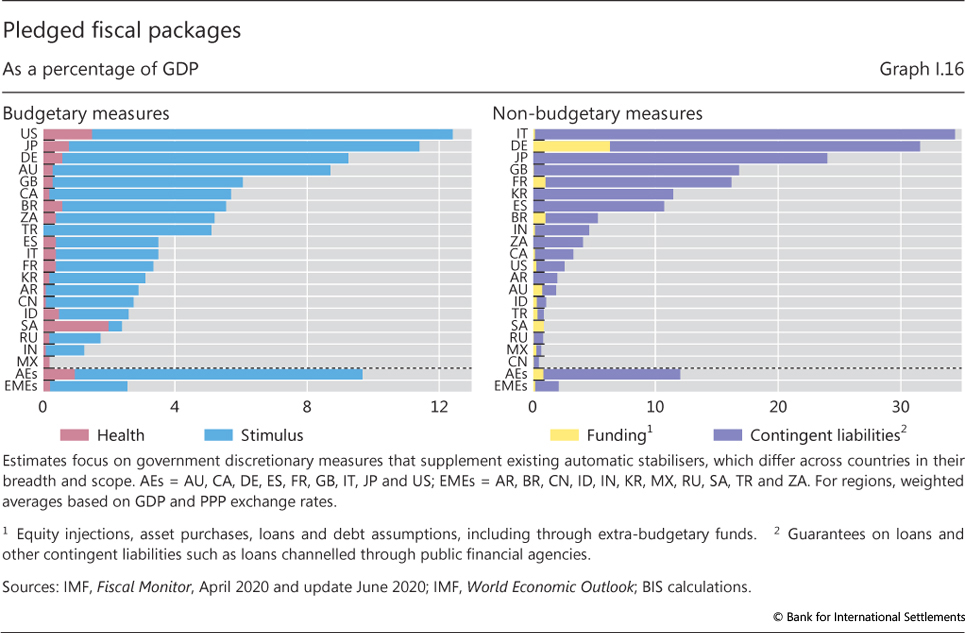
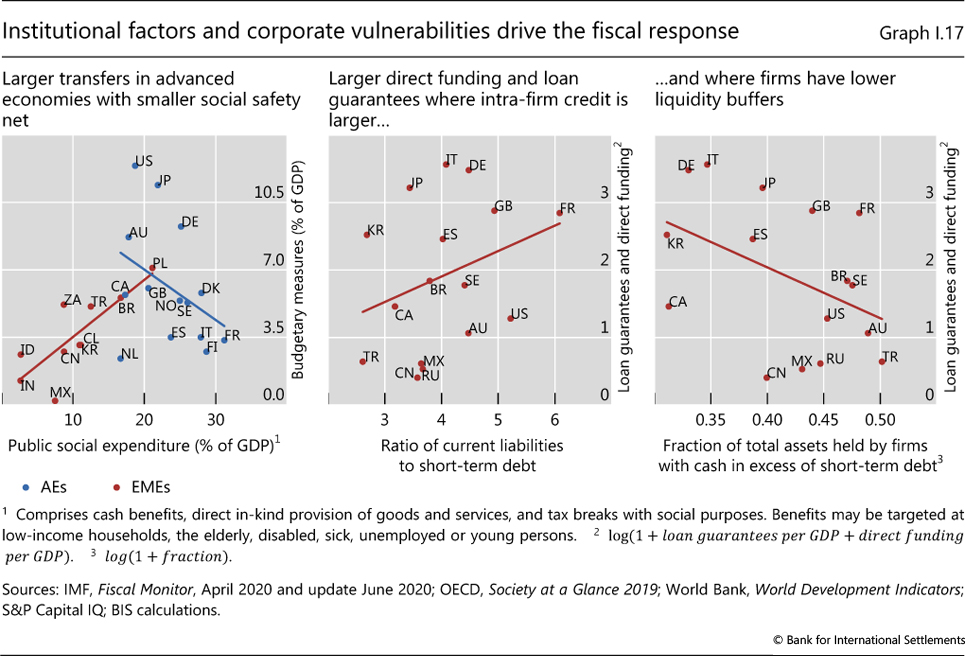
The composition of fiscal programmes varies greatly across countries. The size and shape of the welfare state had an important bearing on the design of fiscal packages.34 For example, AEs with higher welfare spending and thus stronger automatic stabilisers relied less on discretionary transfers (Graph I.17, left-hand panel). Among EMEs, by contrast, countries with higher welfare spending also put in place larger packages involving immediate transfers. Similarly, countries with subsidised furlough schemes, eg France, Germany and Switzerland, tended to expand them rather than providing direct benefits to households, as done, for instance, in the United States. The structure and stability of the business sector also explains some of the features of the programmes. For example, countries in which firms faced larger liquidity shortages or had a larger stock of intra-firm credit put in place larger guarantee programmes and direct funding programmes (centre and right-hand panels).
The size of fiscal packages depended heavily on the fiscal space available. They were smaller in countries where sovereign credit default swap (CDS) premia rose most, especially where they had previously been high (Graph I.18). Similarly, countries with lower pre-crisis credit ratings put in place leaner budgetary measures.
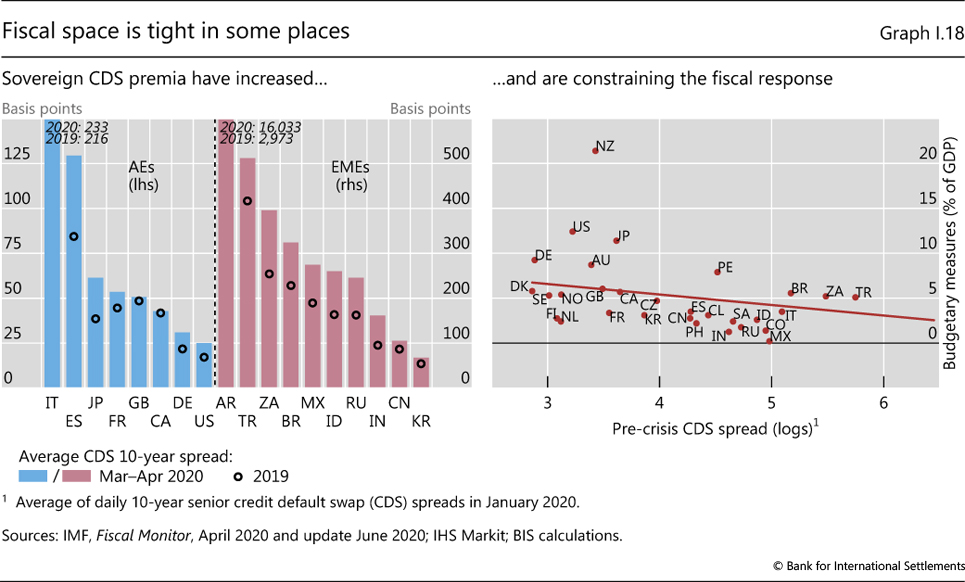
EMEs faced particularly tight constraints on their fiscal stimulus packages because of external constraints, as well as their weaker health infrastructure and inherently greater vulnerability. Accordingly, markets generally have a lower tolerance for their sovereign debt levels. As a result, the response of EMEs was much weaker, at 2.6% of GDP, compared with 10% for AEs (Graph I.16, left-hand panel).
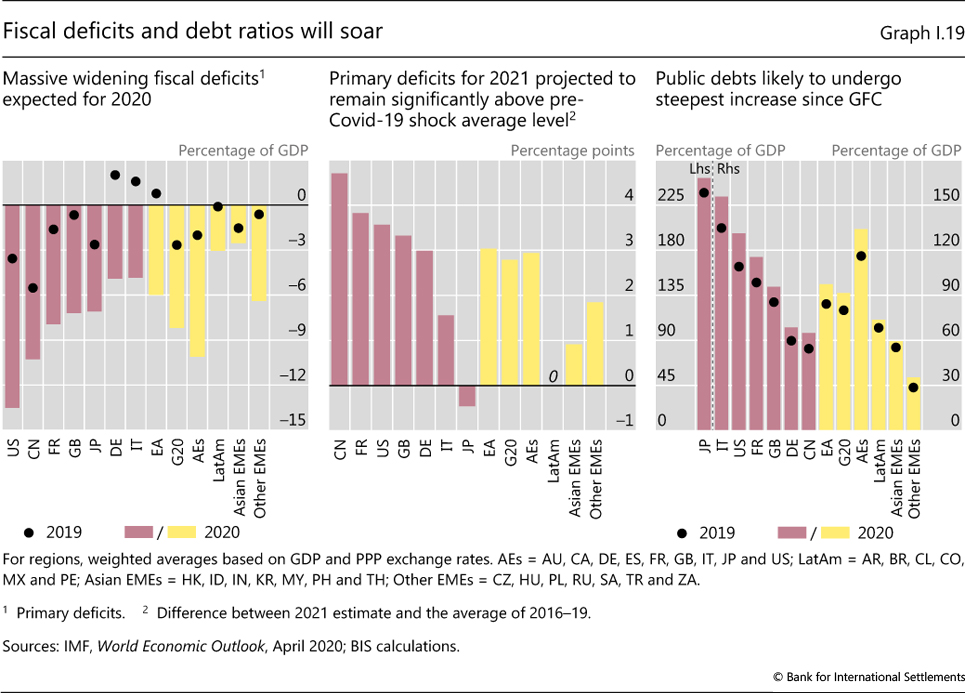
Country differences aside, a legacy of the measures and the recession will be much higher public sector indebtedness. This will exacerbate a previous long-term trend that the GFC had already intensified. According to early IMF forecasts, the average primary fiscal deficits in AEs will increase by 8 percentage points of GDP between 2019 and 2020 (Graph I.19, left-hand panel). All AEs except Japan, Italy and some large EMEs, including China and Russia, are projected to have 2021 primary deficits of at least 2 percentage points of GDP above the 2016-19 average (centre panel). Thus, public debt will increase substantially in many AEs (right-hand panel), and is likely to grow further for all economies into the recovery.
U, V, W? The alphabet soup of the recovery
Besides saving lives, the ultimate test of the policy response to the Covid-19 crisis will be the strength and durability of the recovery. In the near term, the outlook hinges on how the pandemic unfolds, which is very hard to predict.
In an optimistic scenario, in which measures to contain the pandemic do not need to be reimposed, economic activity could gradually improve in the second half of 2020 and embark on a durable recovery. That said, most observers agree that a V-shaped recovery - as after the SARS episode - is out of the question. To be sure, production could probably resume fairly quickly, with pent-up demand for some consumer goods providing a boost. But restrictions on physical proximity and on international mobility would weigh on productivity for some time, lost demand for most services will not recover and, psychologically, risk aversion may linger. All this suggests a more gradual, U-shaped rebound.35
While it is still early days, the recent Chinese experience seems to confirm this conjecture. China, where the virus was first reported, was relatively quick to enter and exit its first lockdown. There, large firms were able to return to approximately 90% of capacity within two months after the most restrictive measures were lifted, but smaller firms lagged behind and consumption remained subdued (Box I.E).
Yet even a U-shaped scenario may be out of reach. The lifting of containment measures could well result in a renewed outbreak and hence in their reimposition, possibly more than once. Rather than being U-shaped, the recovery would then be W- or wave-shaped, and of uncertain length. This would put further pressure on both monetary and fiscal policy.36
The Covid-19 outbreak could also hold back economic activity in the medium-to-long run, if it damages the economic tissue and leaves long-lasting scars. Unless quickly restructured, higher debt levels could hold back growth, just as after the GFC. The restructuring process might not be able to effectively distinguish viable from non-viable firms, especially if bankruptcy courts or less formal mechanisms are overwhelmed: valuable capital would then be lost and worthless firms kept operating. Unemployment could result in a loss of skills or make it more difficult for young people to gain a foothold in the labour market.37 More generally, unless policies are sufficiently supportive and well targeted, the reallocation of resources to meet the new pattern of demand post-crisis may take time or be undermined.
Questions also arise concerning global value chains and global integration. Firms may seek to shorten their value chains and rely on multiple suppliers for the same good to diversify their risks. Parts of the value chains may also be onshored. There may be more inward investment at the expense of FDI. Economies depending on trade or FDI may have to reinvent their growth model. The burden could fall disproportionately on poorer economies and EMEs, given their weaker competitive position and role in global value chains. In addition, lower labour mobility could reduce remittances, an important source of external income for many middle- and low-income economies. Positive global technological spillovers may suffer. If that affects the transfer of digital technology to EMEs, this may leave some segments of the population behind, worsening inequality and fuelling social discontent.
Box I.E
China returns to work
On 23 January, two days before the Chinese new year, the authorities put several major cities under strict lockdown in an attempt to contain the Covid-19 outbreak. Since then, the virus has gradually been brought under control and China recorded zero new reported coronavirus deaths for the first time on 7 April. How has the economy performed so far following the "exit" from containment measures? Data up to 20 May indicated that some economic activities took about six weeks to get back to near capacity, while others were still falling short of that benchmark.
The movement of people adjusted sluggishly after containment was eased. Traditionally, the lunar new year holiday ushers in the busiest travel period in China, with millions of migrant workers journeying between workplace and home. Data tracking this migration showed that daily average passenger traffic reached only 20 million trips in early May, compared with over 40 million a year earlier (Graph I.E.1, left-hand panel). Public transport rides in cities resumed faster, with the number of underground trips and traffic congestion rising quickly once the lockdowns were eased (centre and right-hand panels). Only the congestion index reached pre-pandemic levels by mid-May.
The sluggish restart of business operations could reflect the more stringent restrictions on long-distance travel and the two-week self-isolation required of workers returning from other provinces. In addition, many city dwellers might have worked from home and avoided unnecessary outings via mass transit, or may have been told to take unpaid leave as many businesses have struggled to pay salaries. A survey by an online job-matching agent has reported that, at the end of March, around 23% of some 8,200 enterprises stated they had stopped paying their workers.
Production resumed with significant differences across sectors. Electricity production recovered first, with daily total coal consumption by the large power generation plants reaching its pre-pandemic level in early April (Graph I.E.2, first panel). The recovery was slower for firms heavily involved in the production of intermediate goods. For example, the closures of many city construction sites in early February reduced the demand for steel rebar - reinforcement steel used in concrete structures - leading to a sharp rise in inventory levels (second panel). Despite the construction restart, inventories returned to the historical range only in early June. Meanwhile, large firms appeared to be quicker than small and medium-sized enterprises in resuming operations. At end-February, most provincial governments announced that large enterprises had returned to 90% capacity. One possible reason is that many large companies had the financial muscle to charter private transport to help migrant workers return to work. However, as inferred from the operating rate of steel blast furnaces, even medium-sized and small plants have picked up rapidly in recent weeks (third panel).
Consumer demand continued to improve, albeit at a slow pace. Retail sales were about 8% lower than in April the previous year, an improvement from the 16% drop recorded in March. Growth in sales of basic necessities such as food and medicine held up well throughout the lockdown and that of office equipment rebounded in March and April (Graph I.E.2, fourth panel). Sales of large-ticket items such as automobiles contracted further in March, before rebounding to the previous year's level in April.
In summary, the return to work in China has been slow. Three months after containment measures were eased, mass transit was below its pre-crisis level. Production fared better, but inventory in some sectors remained elevated. Personal consumption was the laggard, perhaps reflecting the fall in income resulting from layoffs and pay cuts.
In a nutshell, the range of outcomes is quite wide. At one extreme, if the pandemic is short-lived, its imprint will be significant but, with hindsight, manageable. If the pandemic is prolonged, the post-crisis economic landscape could look very different from today's. Debt levels, especially for sovereigns, will be much higher. The need to reallocate resources will be greater, and the degree of globalisation possibly smaller. On the other hand, lockdowns could accelerate the shift towards digitalisation and thus raise future productivity. In addition, investment in green technologies could boost economic activity.38 The outlook for inflation is similarly uncertain. In the near term, high unemployment will push down inflation, but it is far from clear what will happen to inflation in the medium and long term.39 In all likelihood, as a natural consequence of dealing with insolvency problems and of central banks' increased footprint in the economy, the role of the state in the economy will probably loom considerably larger. And so too might the policy challenges, as discussed in Chapter II.
Endnotes
1 See H Cao, M Chui, M Drehmann, T Goel, I Mattei, A Mehrotra, J Schanz and A Villar, "Structural differences and the Covid-19 crisis: each EME is unhappy in its own way", BIS Bulletin, forthcoming, 2020.
2 See International Labour Organization, ILO Monitor: Covid-19 and the world of work, third edition, April 2020.
3 See Centre for Monitoring Indian Economy, "The jobs bloodbath of April 2020", 5 May 2020.
4 Perhaps ironically, the drop in trade volumes occurred just when global trade was showing signs of recovering after a series of trade tensions abated.
5 United Nations World Tourism Organization, news release, 7 May 2020.
6 Oil-related revenues account for close to 70% of total government revenue in Saudi Arabia, 25% in Malaysia and Russia, and 10-15% in Colombia, Indonesia and Mexico, sometimes even more if state-run oil firms are consolidated. In Mexico, fiscal revenues from oil are hedged, so the impact of a lower oil price will be felt only after hedging contracts run out, which tends to be in a year's time.
7 Among major EMEs, the economy most dependent on remittances is the Philippines, where they reached around 10% of GDP in 2019. See World Bank, "Covid-19 crisis through a migration lens", Migration and Development Brief, no 32, April 2020.
8 Total international reserves of 11 major EMEs (excluding China and Turkey) fell by almost $60 billion in March.
9 See Y Arslan, M Drehmann and B Hofmann, "Central bank bond purchases in emerging market economies", BIS Bulletin, no 20, 2 June 2020.
10 See A Zabai, "How are household finances holding up against the Covid-19 shock?", BIS Bulletin, no 22, 15 June 2020.
11 See Association of Practising Accountants, "The impact of the coronavirus on UK owner managed business: an APA client survey", April 2020.
12 See Bank of England, Interim Financial Stability Report, May 2020.
13 See S Avdjiev, P McGuire and G von Peter, "International dimensions of EME corporate debt", BIS Quarterly Review, June 2020, pp 1-13.
14 See D Beltran, K Garud and A Rosenblum, "Emerging market nonfinancial corporate debt: how concerned should we be?", Board of Governors of the Federal Reserve System, IFDP Notes, 2017.
15 Information on the amounts outstanding of leveraged loans is not available. Cumulating issuance, as is usually done for bonds, will result in a considerable overestimation of the actual amounts since many loans are repaid ahead of the scheduled maturity date.
16 Even though banks are not involved in the origination of private credit, they are still exposed to developments in this market through the provision of leverage to private credit funds. Slightly less than 50% of portfolio managers reported borrowing against fund assets. See S Aramonte, "Private credit: recent developments and long-term trends", BIS Quarterly Review, March 2020, pp 11-13.
17 See BIS, "Easing trade tensions lift sentiment", BIS Quarterly Review, December 2019, pp 1-14; and the 2019 financial stability reviews of the ECB and the Federal Reserve.
18 See A Carstens and H S Shin, "Emerging markets aren't out of the woods yet", Foreign Affairs, 15 March 2019, for a description of this mechanism.
19 See U Lewrick, C Schmieder, J Sobrun and E Takáts, "Releasing bank buffers to cushion the crisis - a quantitative assessment", BIS Bulletin, no 11, 5 May 2020.
20 See I Aldasoro, T Ehlers, P McGuire and G von Peter, "Global banks' dollar funding needs and central bank swap lines", BIS Bulletin, forthcoming, 2020.
21 This difference could in part be related to the timing of the switch to expected loss provisioning. In the United States, the switch took place in Q1 2020, while countries using IFRS had already undertaken the switch in 2018. US banks also have to make provisions for expected losses during the entire life of a loan right from the time of its origination, while in Europe they have to provision only against 12-month expected losses. Only if there is a significant deterioration in credit quality do they have to report lifetime expected losses. In response to the profound uncertainty introduced by the Covid-19 crisis, the US CARES Act granted US banks temporary optional relief from compliance with the new standard. The ECB adopted a similar stance.
22 Euro area banks' exposures to mining and quarrying, which includes oil, amount to 0.5% of their total lending. In the United States, the median large bank lent around 3% of its loan book to the energy or oil sector, although a small number of banks had exposures of the order of 10% or more. See S&P Global Market Intelligence, "Banks disclose ratings exposures, efforts to shrink portfolio", Data Dispatch, 7 May 2020.
23 See I Aldasoro, I Fender, B Hardy and N Tarashev, "Effects of Covid-19 on the banking sector: the market's assessment", BIS Bulletin, no 12, 7 May 2020.
24 While the strong loan growth in March was driven primarily by the drawdown of credit lines by non-financial corporations (as evidenced in the expansion in large domestic bank balance sheet data), credit expansion in April was fuelled by Paycheck Protection Program loans.
25 This may require a general reassessment of the financial health of firms after the initial aim of keeping them afloat for a short period was achieved, and the introduction of decisive fiscal actions, such as equity injections and debt guarantees, to restore market confidence. See C Borio, B Vale and G von Peter, "Resolving the financial crisis: are we heeding the lessons from the Nordics?", BIS Working Papers, no 311, June 2010.
26 See also Chapter II of this Report; and P Cavallino and F De Fiore, "Central banks' response to Covid-19 in advanced economies", BIS Bulletin, no 21, 5 June 2020.
27 See BIS, "Monetary policy frameworks in EMEs: inflation targeting, the exchange rate and financial stability", Annual Economic Report 2019, Chapter II, June.
28 See J-P Svoronos and R Vrbaski, "Banks' dividends in Covid-19 times", FSI Briefs, no 6, May 2020.
29 In the euro area, such a course of action requires the involvement of national fiscal authorities.
30 It is debatable whether the state should provide financial assistance to a specific sector of particular economic importance. Proponents argue that their collapse could result in the loss of large investments and might worsen the recession, thereby imposing further costs on taxpayers, not least from unemployment benefits.
31 Since 1991, loan guarantees have received the same budgetary treatment as loans in the United States. See R Gnanarajah, "Cash versus accrual basis of accounting: an introduction", Congressional Research Service Report, R43811, December 2014.
32 Stein (2020) argues that contingent resource transfers through less senior claims (eg preferred plus warrants) would be preferable in the current circumstances, as debt overhang would slow recovery. See J Stein, "Webinar: an evaluation of the Fed-Treasury credit programs", Princeton University Bendheim Center for Finance, May 2020.
33 Following the 9/11 terrorist attacks, only $1.6 billion of the $10 billion loan guarantees promised by the US government to the airline industry were used. Despite one recipient eventually filing for bankruptcy, the US Treasury wound up the state aid programme with a $300 million profit. See M Blair, "The economics of post-September 11 financial aid to airlines", Indiana Law Review, vol 36, 2003, pp 367-95.
34 See E Alberola, Y Arslan, G Cheng and R Moessner, "The fiscal response to the Covid-19 crisis in advanced and emerging market economies", BIS Bulletin, no 23, 17 June 2020.
35 Stretching the Roman alphabet, one might speak of a tilted J-recovery, in which a sharp drop is followed by a gradual rebound. Some observers have even stepped outside the confines of the alphabet and referred to a "swoosh"-shaped recovery, similar to the logo of a famous sports shoe brand.
36 On the shape of the recovery, see also E Kohlscheen, B Mojon and D Rees, "The macroeconomic spillover effects of the pandemic on the global economy", BIS Bulletin, no 4, 6 April 2020.
37 A large body of literature has established the "scarring" effect of youth unemployment, which can impose costs on individuals and society well into the future. See eg D Bell and D Blanchflower, "Young people and the Great Recession", Oxford Review of Economic Policy, vol 27, no 2, 2011, pp 241-67.
38 The reduction in carbon emissions during the lockdown phase could easily be offset by fewer efforts to green the economy down the road, given fewer available resources and competing priorities. See also the discussion in L A Pereira da Silva, "Green Swan 2 - climate change and Covid-19: reflections on efficiency versus resilience", 14 May 2020.
39 See Chapter II of this Report for a more detailed discussion.