What drove the recent increase in the US inflation break-even rate?
Inflation break-even rates indicate how investors' perceptions of future inflation translate into pricing decisions. For the United States, this rate can be measured as the spread between the yields on nominal US government bonds (Treasuries) and on Treasury Inflation-Protected Securities (TIPS). In this box, we use a model of the term structure of interest rates to decompose the US break-even rate into its two elements: inflation expectations and what is known as "inflation risk premium". In so doing, we find that inflation expectations have increased substantially since mid-2020, and that the measured inflation risk premium has also contributed materially. The latter seems to reflect, in part, the funding policy of the US Treasury and its interaction with asset purchases by the Federal Reserve.
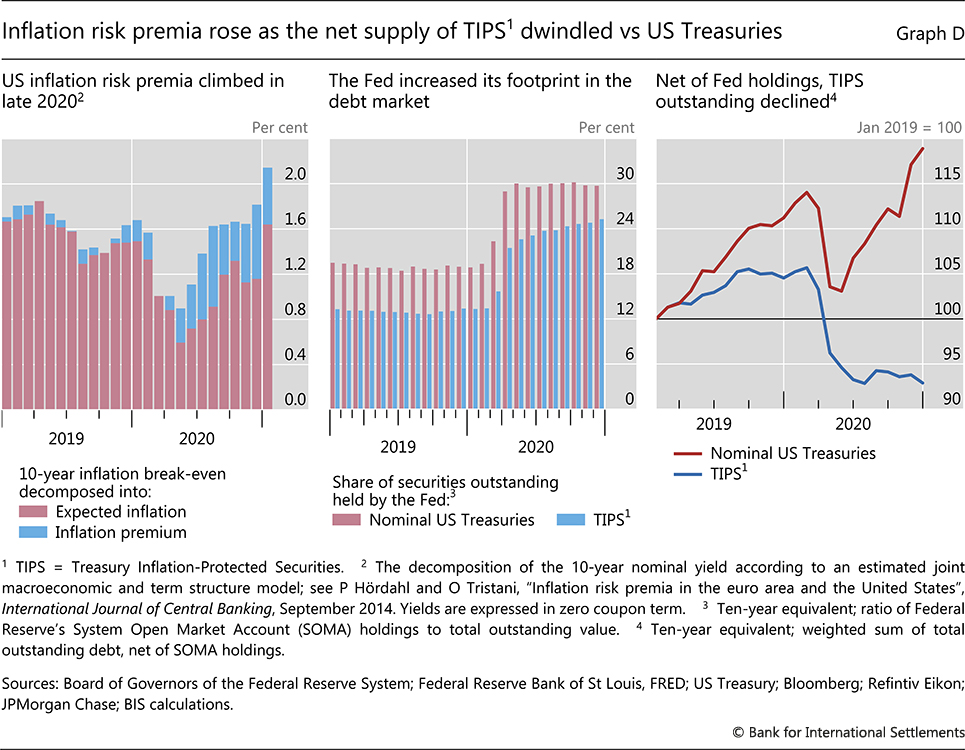
Since the end of March 2020, the break-even rate has increased by almost 130 basis points, to 2.16% in late February 2021, surpassing its pre-pandemic watermark. Much of this reflects the rise in inflation expectations between May and October 2020. Expected inflation then levelled off in November and December before a step increase in January, as the prospect of a large fiscal impulse consolidated (Graph D, left-hand panel, red bars). In parallel, the inflation risk premium increased by about 50 basis points (blue bars), helping to take the break-even rate to the highest level seen since early 2019.
The overall increase in the break-even rate is likely to have reflected a variety of indications that US inflation could be higher in the near term. On the back of the Federal Reserve's new monetary policy framework, progress in the distribution of vaccines, higher commodity prices and a potentially substantial fiscal impulse were likely drivers of higher inflation expectations. But what could have contributed to the high inflation risk premium?
In a simple textbook setting, the inflation risk premium would only reflect the compensation that investors demand for holding nominal Treasuries, over and above the compensation for expected inflation. In this case, the only drivers of the risk premium would be investors' perceptions of risk and their risk appetite. In practice, however, the measured inflation risk premium can also reflect a variety of additional drivers. In the US case, these include imbalances between the demand for and supply of Treasuries and TIPS, or the relative liquidity of the underlying markets.
The net supply of Treasuries and TIPS to private investors stems from the interaction of US Treasury issuance patterns and Federal Reserve purchases. As the US central bank swiftly expanded its holdings of TIPS and Treasuries in response to the Covid-19 emergency, the corresponding bond amounts available to investors dropped substantially in the first quarter of 2020 (Graph D, centre panel). From mid-2020, however, issuance of Treasuries picked up, with auction sizes increasing by between 20% and more than 50% by the end of 2020, depending on the tenor. At the same time, the auction sizes of TIPS remained stable. Since the Federal Reserve maintained a relatively large and steady pace of purchases that somewhat exceeded TIPS issuance but not the expanded issuance of Treasuries, the amount of Treasuries available to investors recovered quickly (Graph D, right-hand panel, red line), while the corresponding TIPS volume stagnated (blue line).
This combination of higher supply of Treasuries and lower supply of TIPS is likely to have contributed to the higher measured inflation risk premium. To the extent that the appetite for inflation hedging remained constant or rose, which appears likely given the macroeconomic and policy backdrop, investors would bid down the yield on the limited amount of TIPS available. The relatively low liquidity of the TIPS market would amplify this effect. At the same time, investors would ask for an increasingly higher compensation to hold the quickly expanding amount of Treasuries. All these mechanisms would contribute to the rise of the break-even rate for given inflation expectations, thus boosting the measured inflation risk premium.
The views expressed are those of the authors and do not necessarily reflect the views of the Bank for International Settlements. For the estimates of expected inflation and the inflation risk premium, we use the model from P Hördahl and O Tristani, "Inflation risk premia in the euro area and the United States", International Journal of Central Banking, September 2014. We confirm that our findings are qualitatively similar to those of S D'Amico, D Kim and M Wei, "Tips from TIPS: the informational content of Treasury Inflation-Protected Security prices", Journal of Financial and Quantitative Analysis, February 2018. Indeed, earlier studies have found that these frequently used empirical models tend to deliver estimates with similar time profiles. See B Cohen, P Hördahl and D Xia, "Term premia: models and some stylised facts", BIS Quarterly Review, September 2018, pp 79–91.