Annual Economic Report 2020 - Statistics associated with the graphs
Download all statistics (zipped XLSX, 665 KB)
Graphs |
||
| Chapter I: data behind the graphs (xlsx) | ||
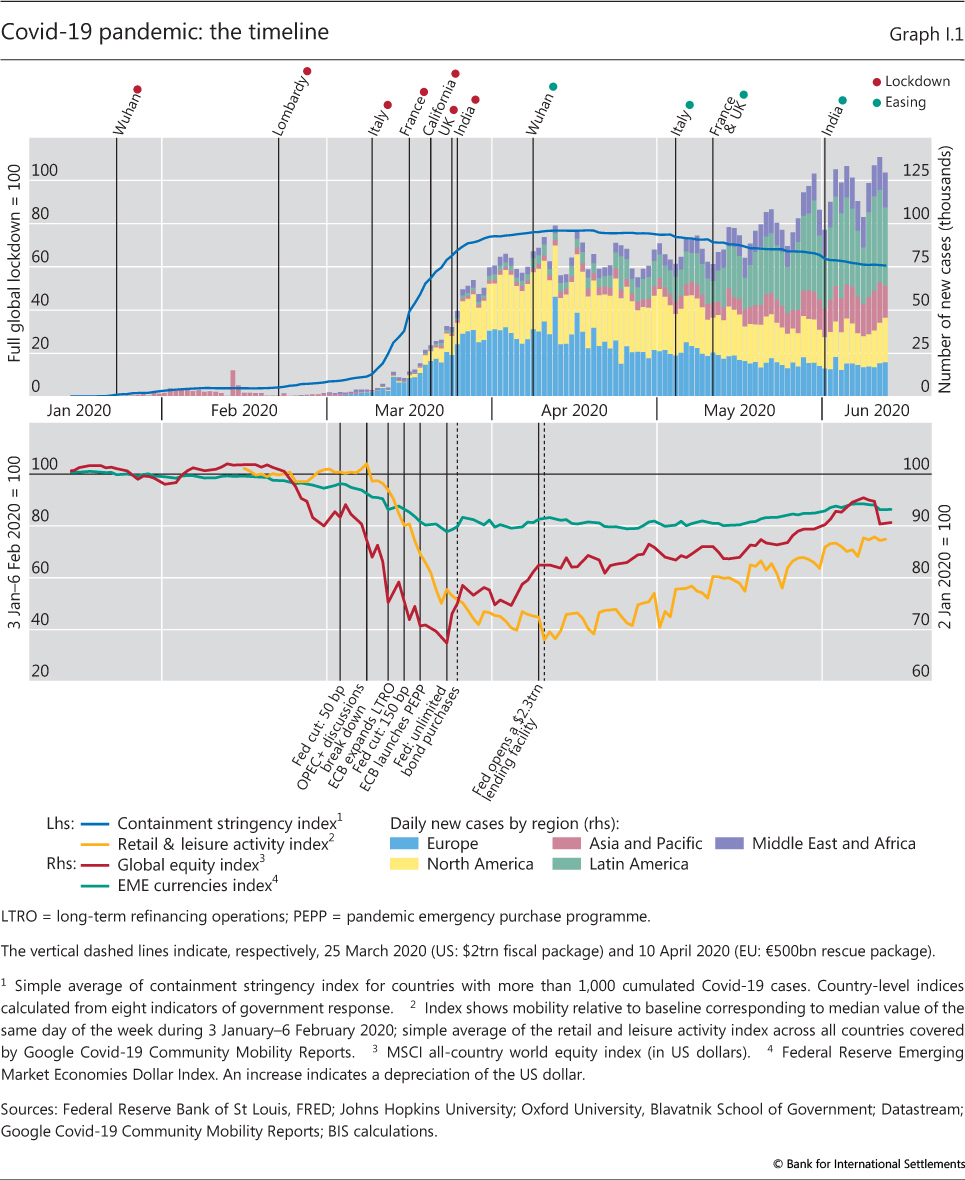
| I.1 | Covid-19 pandemic: the timeline | p 2 |
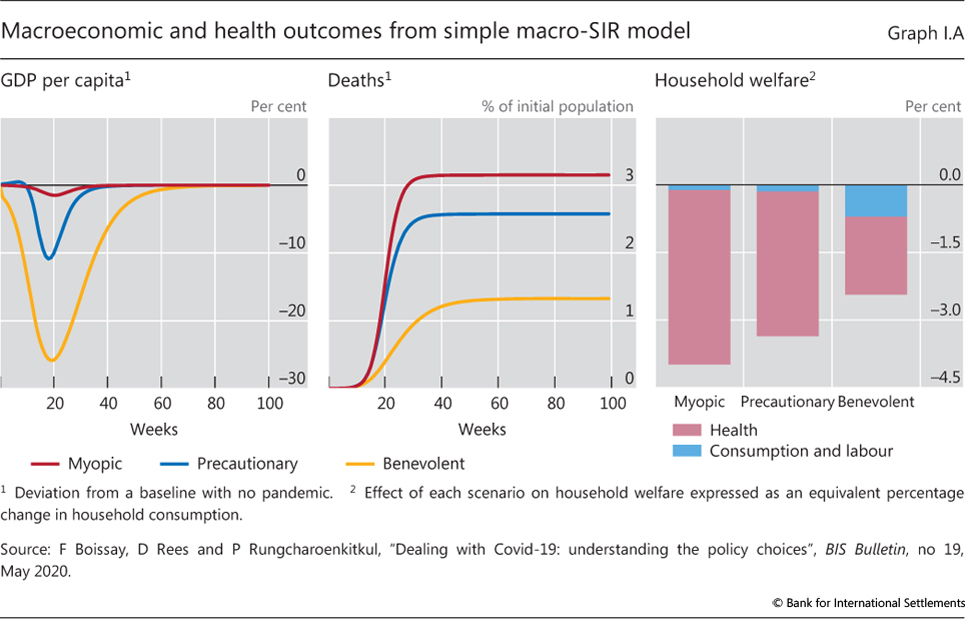
| I.A | Macroeconomic and health outcomes from simple macro-SIR model | p 3 |
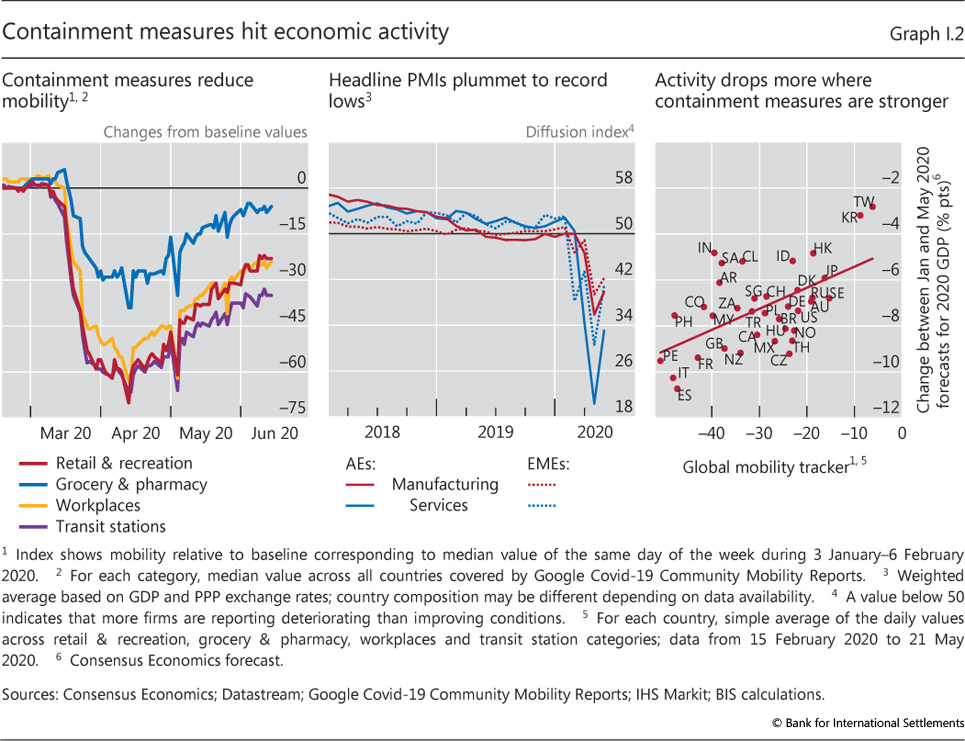
| I.2 | Containment measures hit economic activity | p 5 |
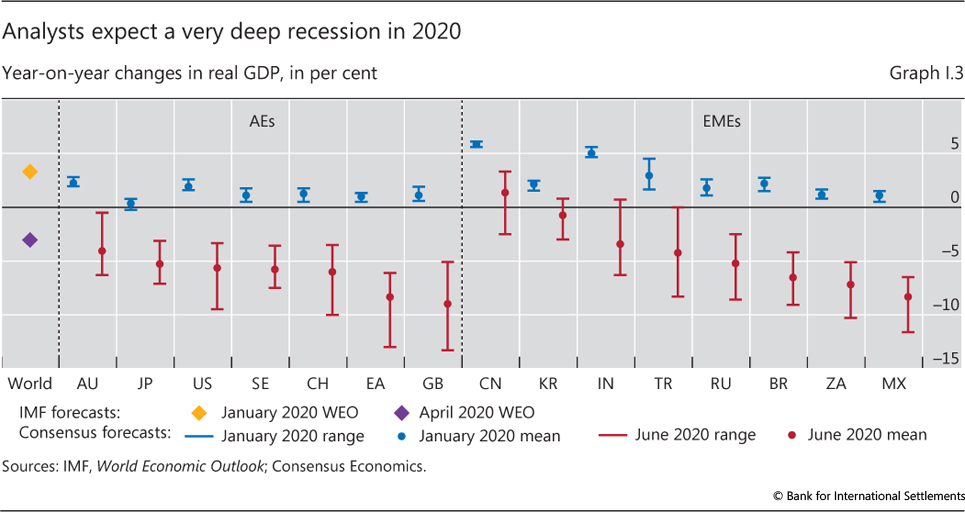
| I.3 | Analysts expect a very deep recession in 2020 | p 5 |
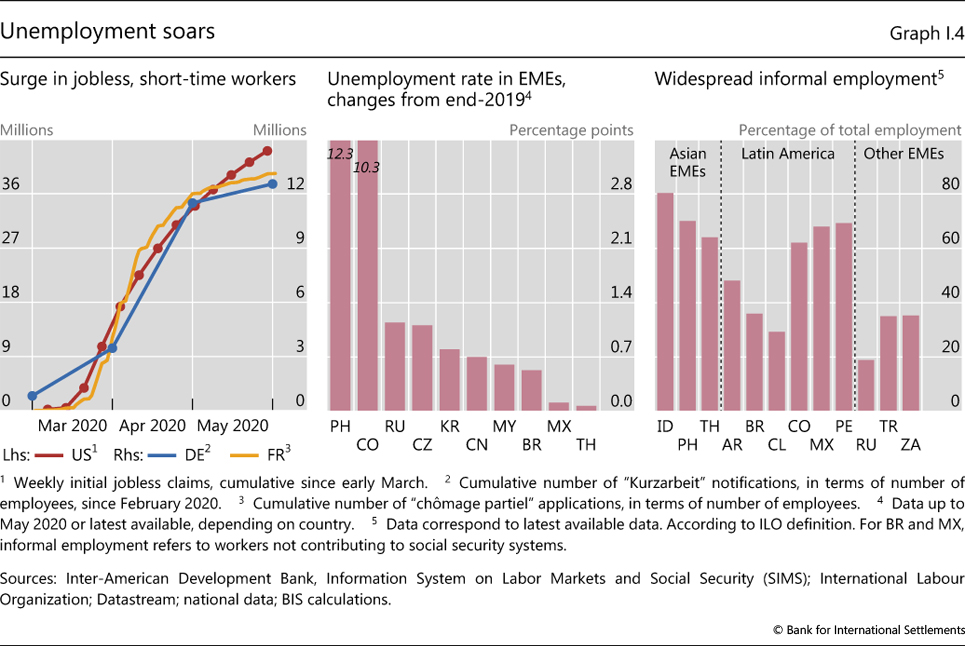
| I.4 | Unemployment soars | p 6 |
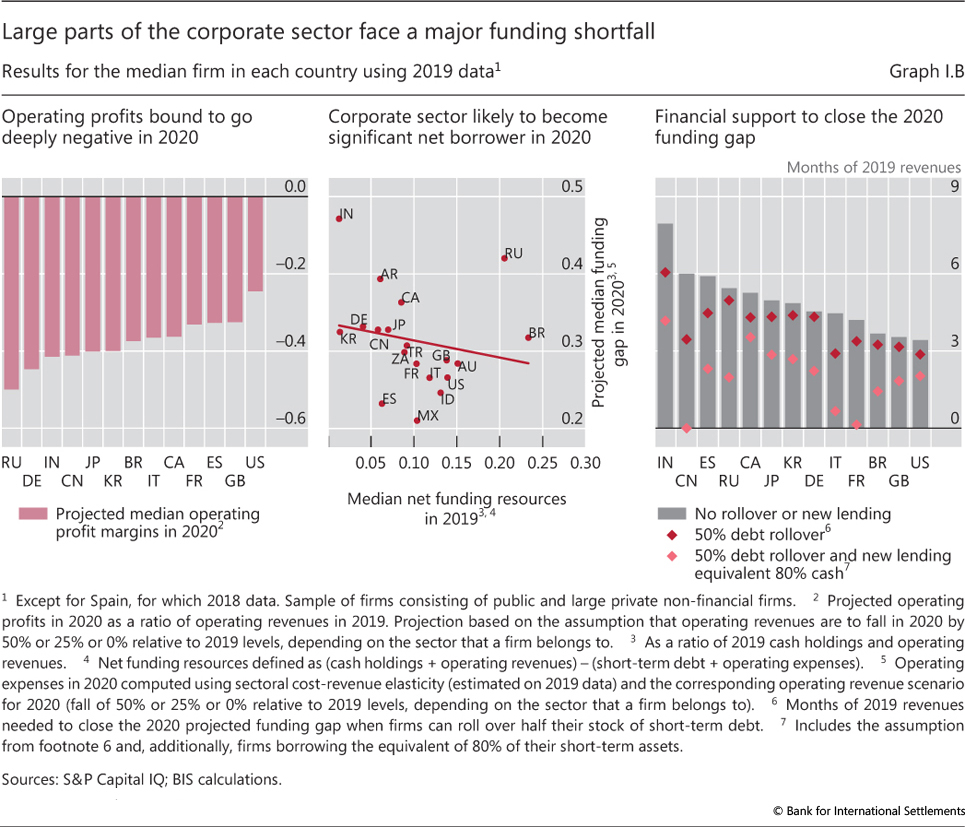
| I.B | Large parts of the corporate sector face a major funding shortfall | p 7 |
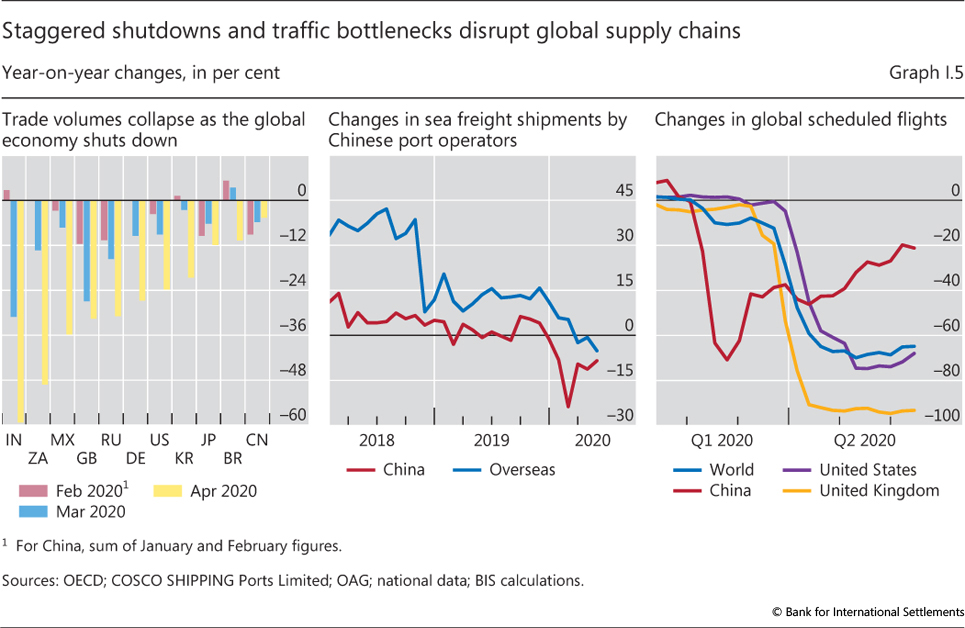
| I.5 | Staggered shutdowns and traffic bottlenecks disrupt global supply chains | p 9 |
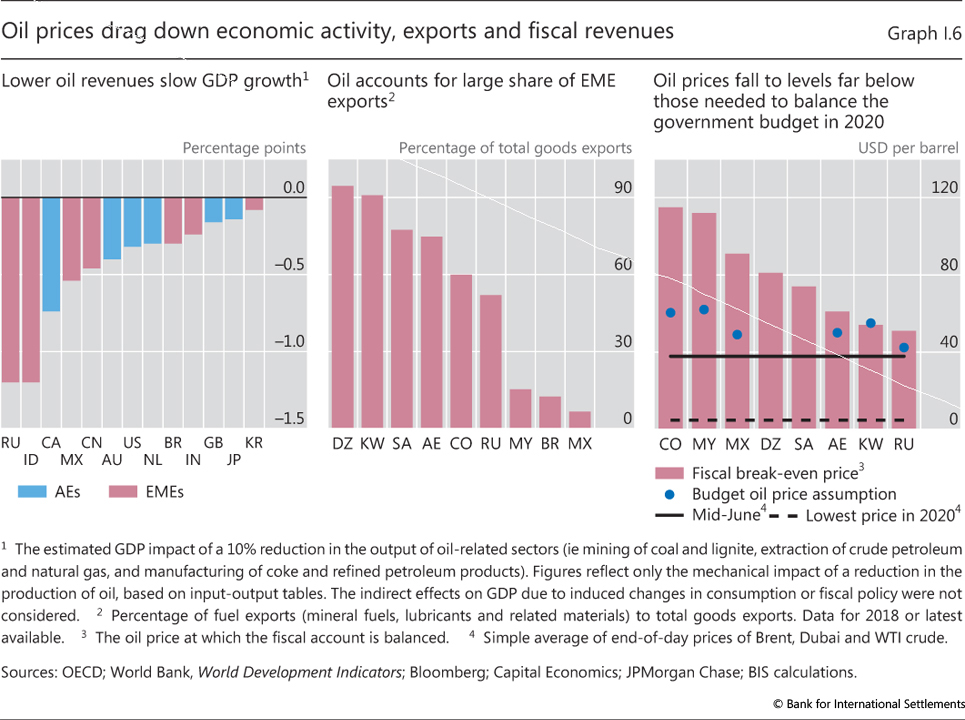
| I.6 | Oil prices drag down economic activity, exports and fiscal revenues | p 10 |
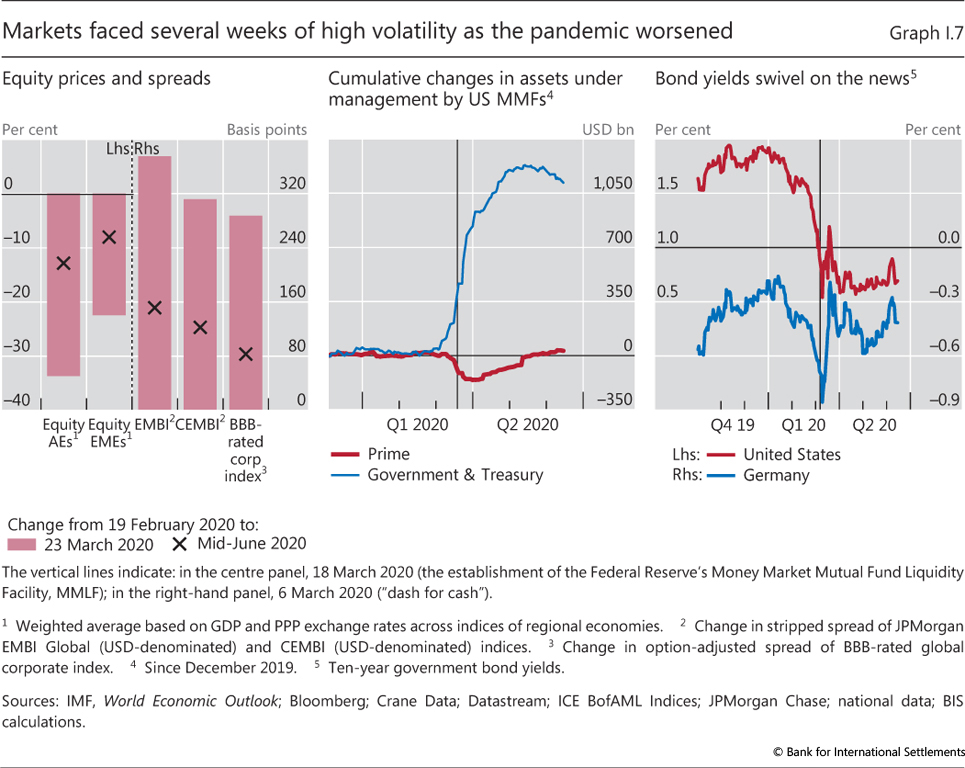
| I.7 | Markets faced several weeks of high volatility as the pandemic worsened | p 11 |
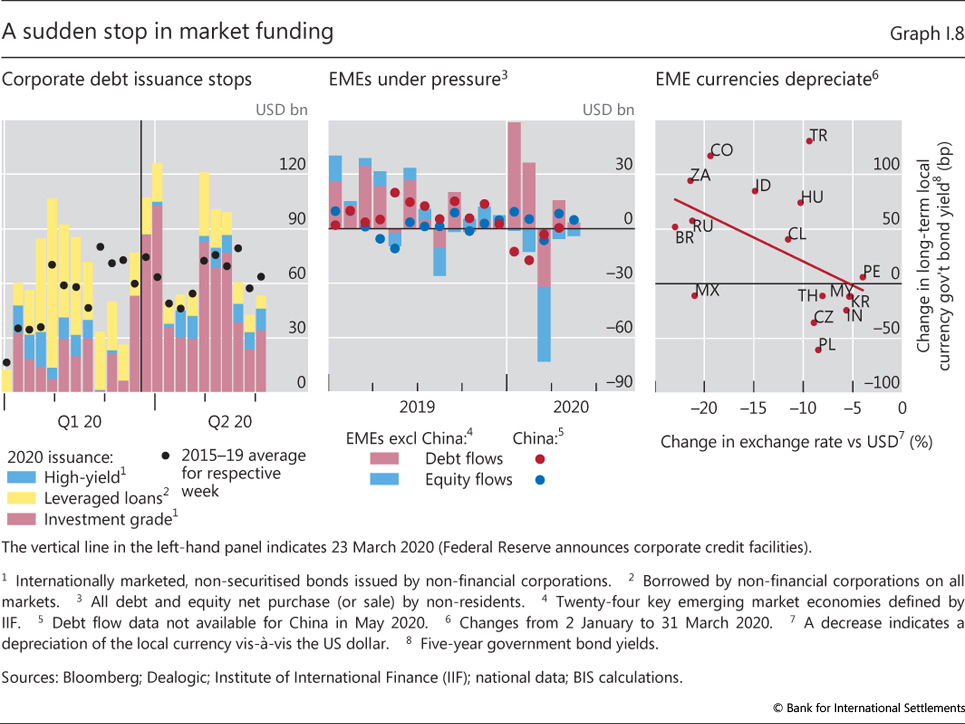
| I.8 | A sudden stop in market funding | p 12 |
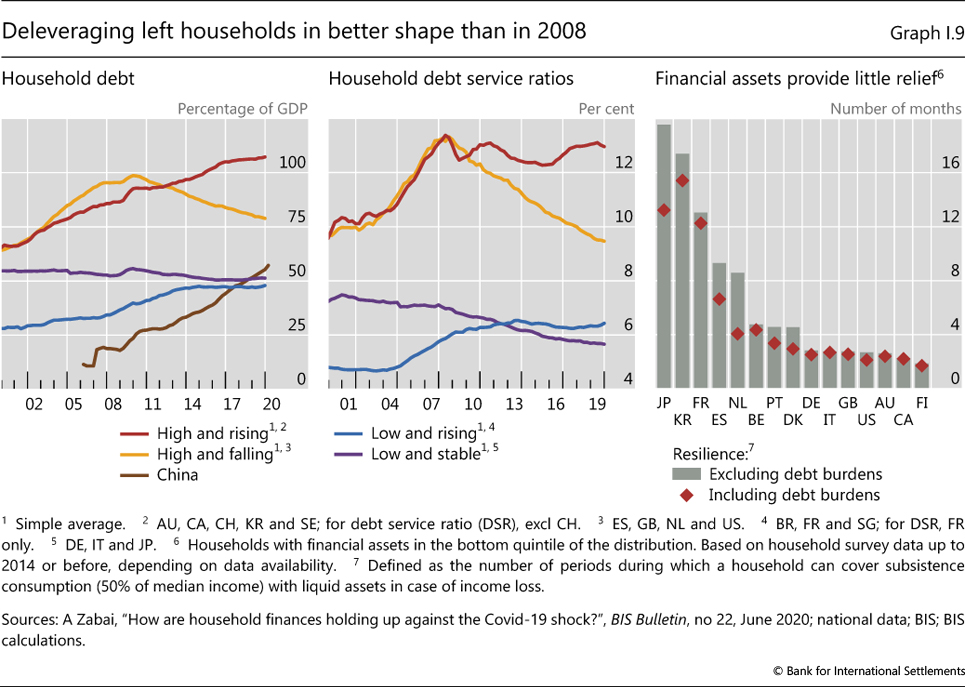
| I.9 | Deleveraging left households in better shape than in 2008 | p 13 |
| I.10 | Corporate strength and vulnerability | p 14 |
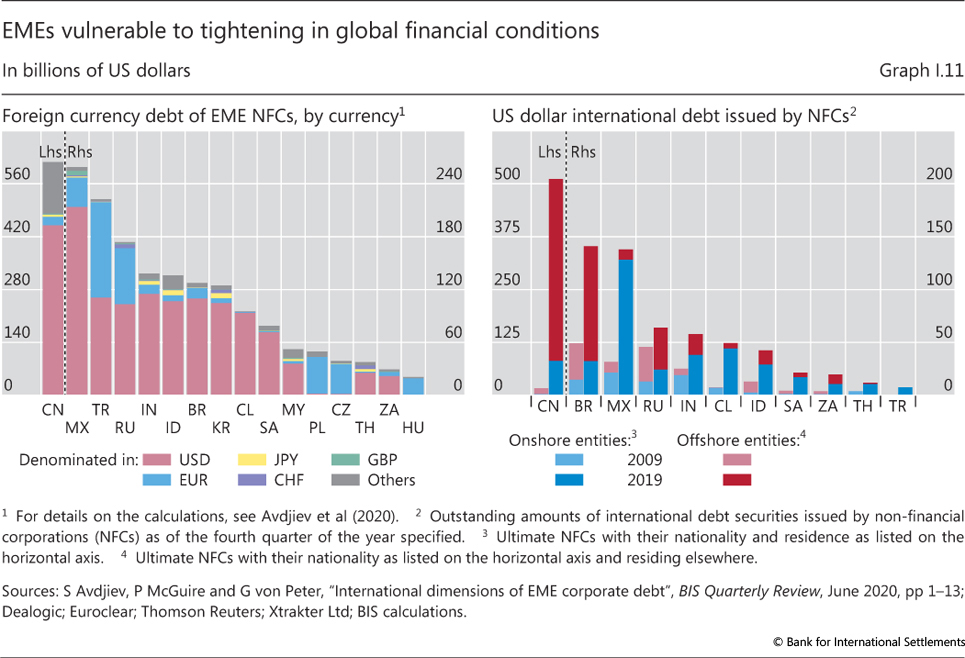
| I.11 | EMEs vulnerable to tightening in global financial conditions | p 15 |
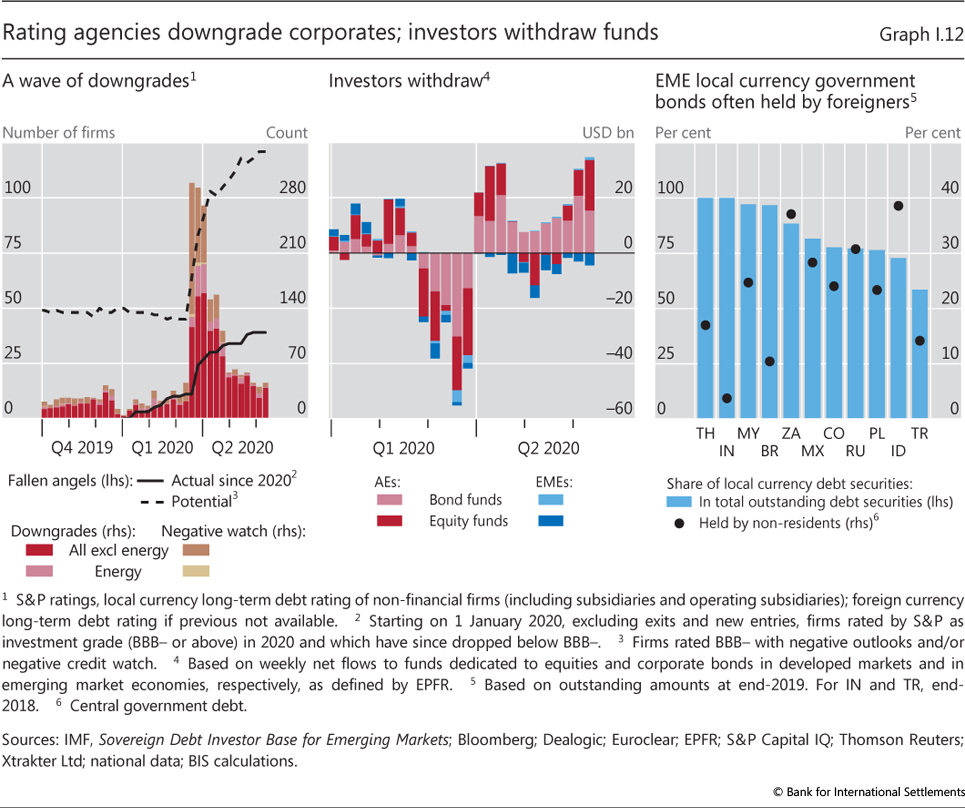
| I.12 | Rating agencies downgrade corporates; investors withdraw funds | p 16 |
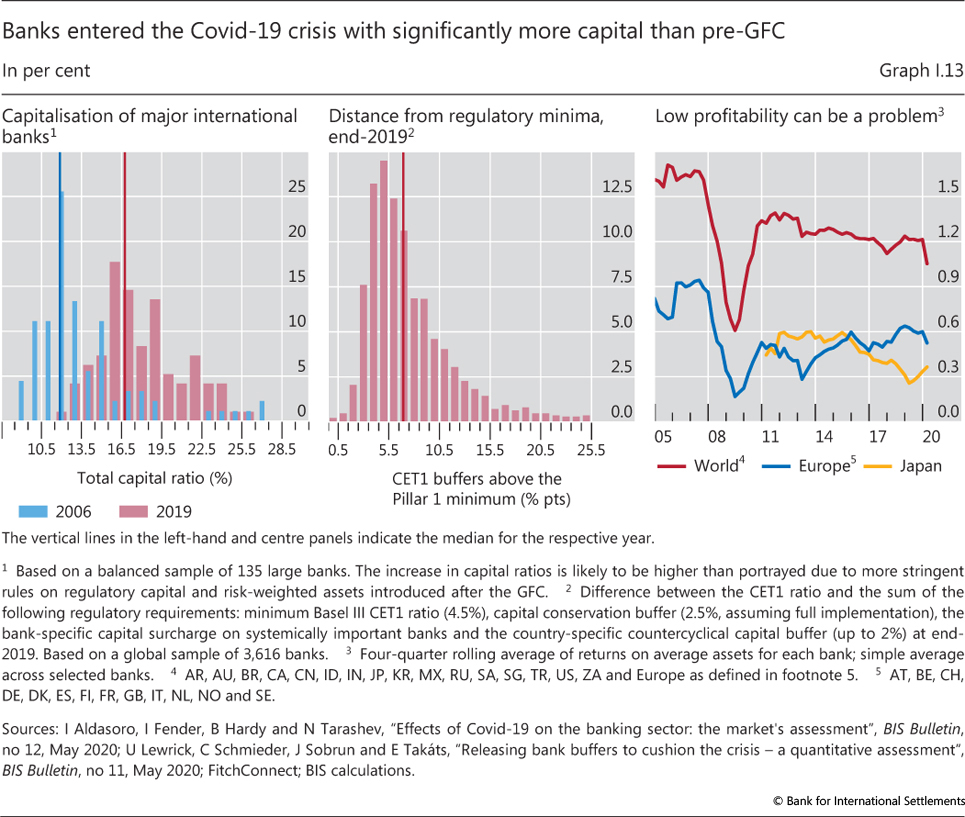
| I.13 | Banks entered the Covid-19 crisis with significantly more capital than pre-GFC | p 17 |
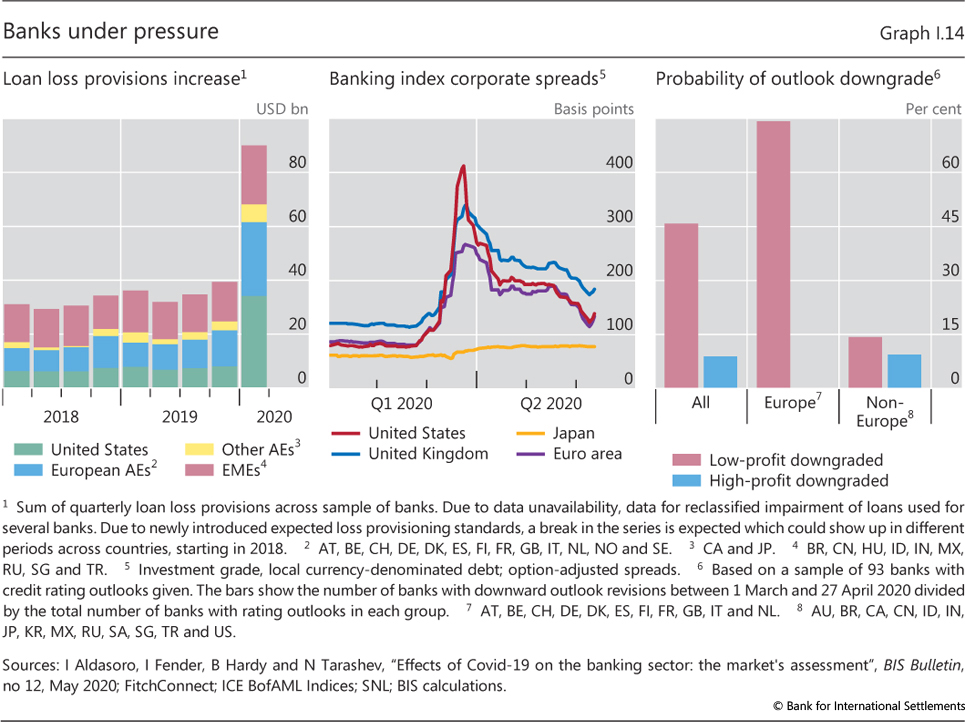
| I.14 | Banks under pressure | p 18 |
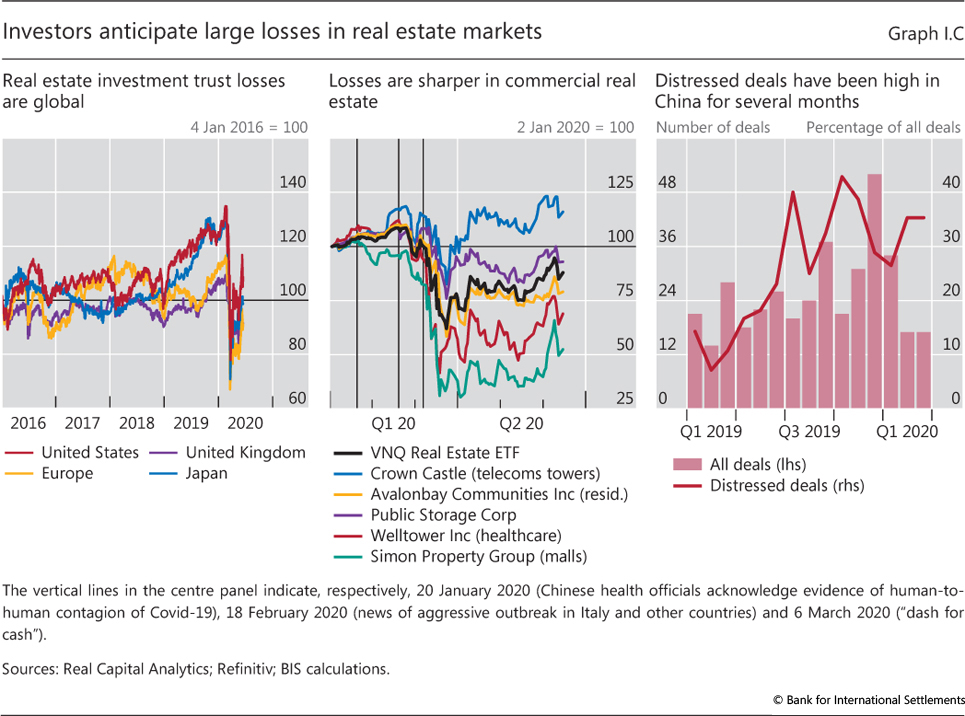
| I.C | Investors anticipate large losses in real estate markets | p 19 |
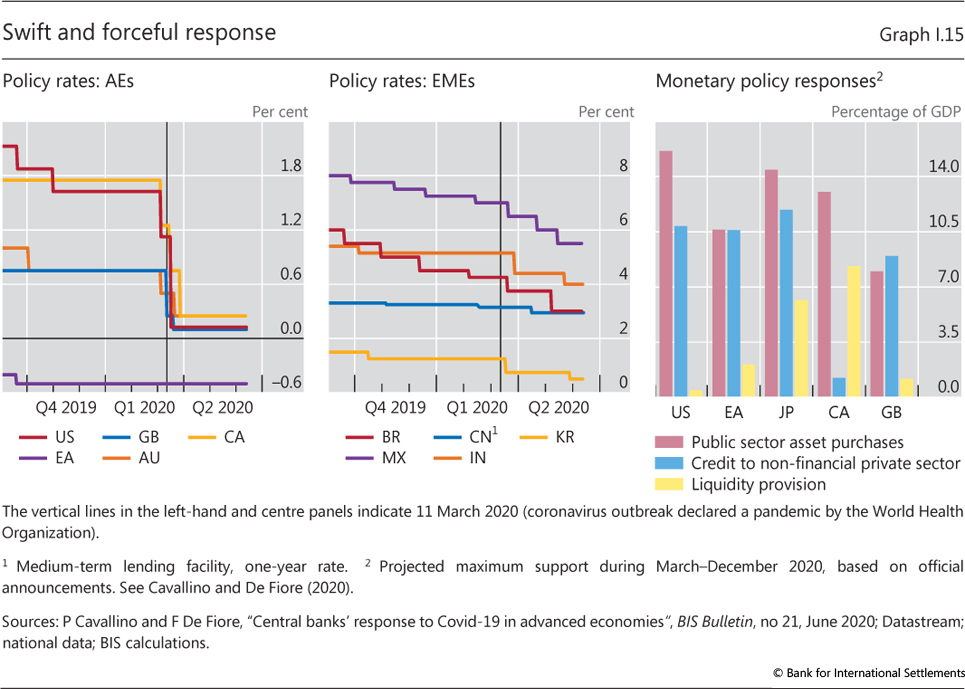
| I.15 | Swift and forceful response | p 22 |
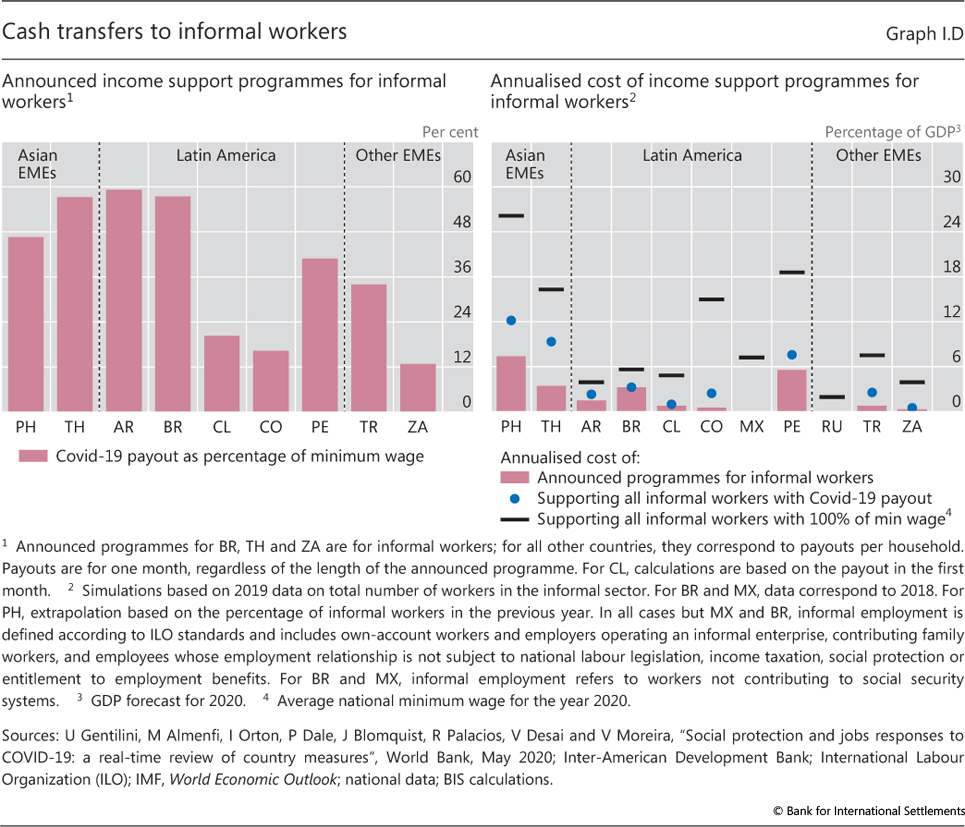
| I.D | Cash transfers to informal workers | p 25 |
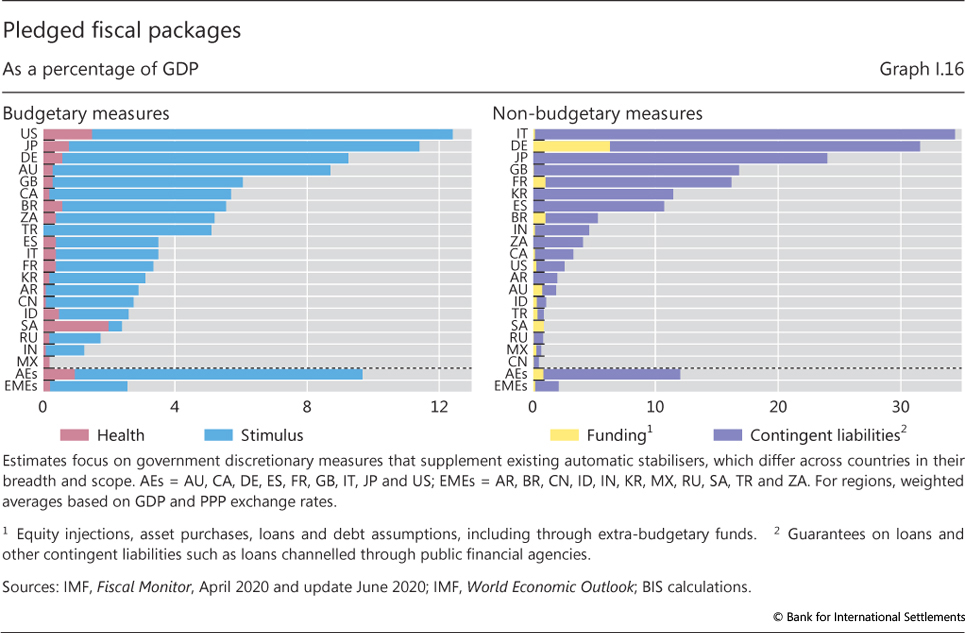
| I.16 | Pledged fiscal packages | p 27 |
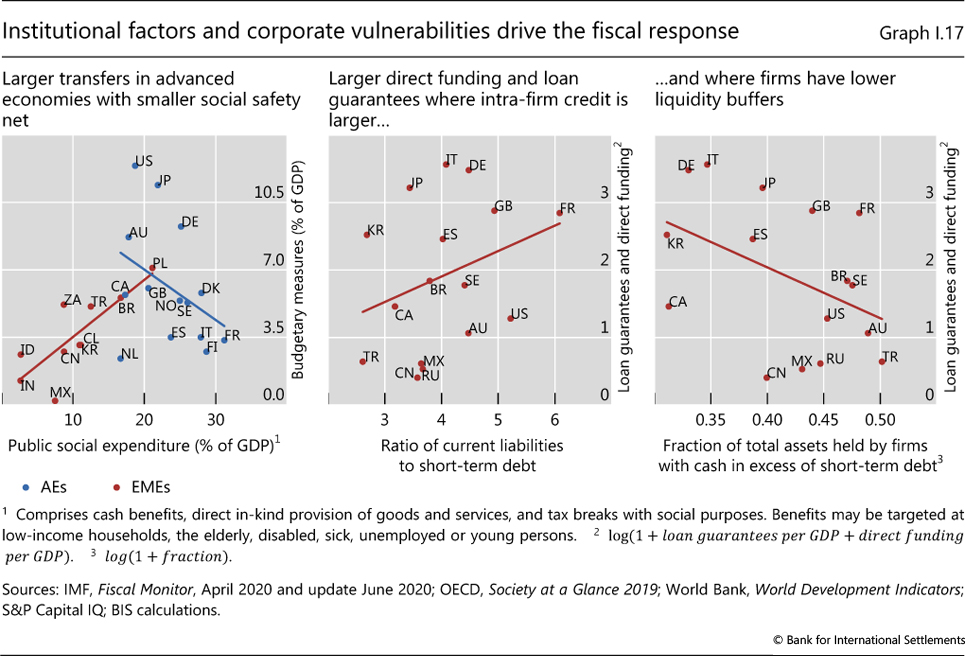
| I.17 | Institutional factors and corporate vulnerabilities drive the fiscal response | p 27 |
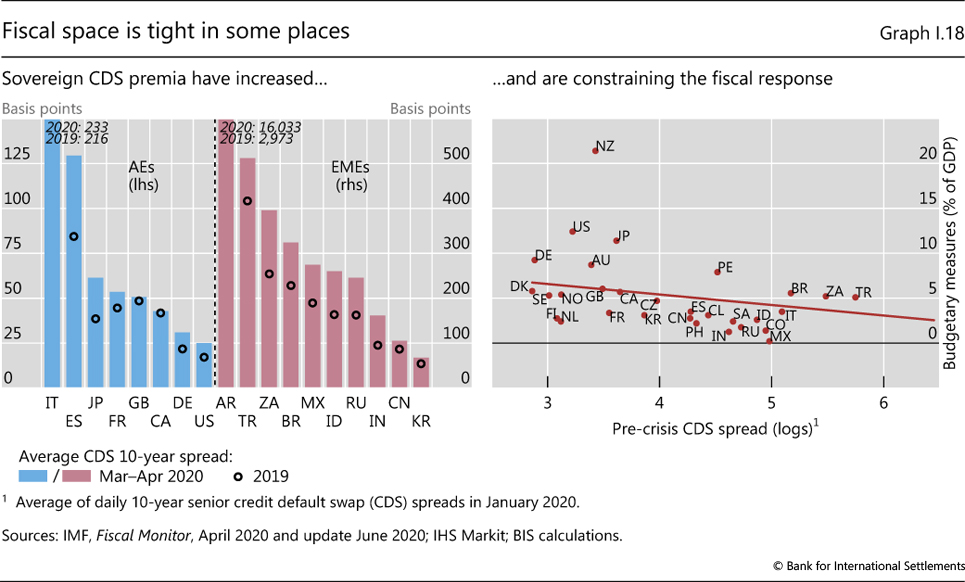
| I.18 | Fiscal space is tight in some places | p 28 |
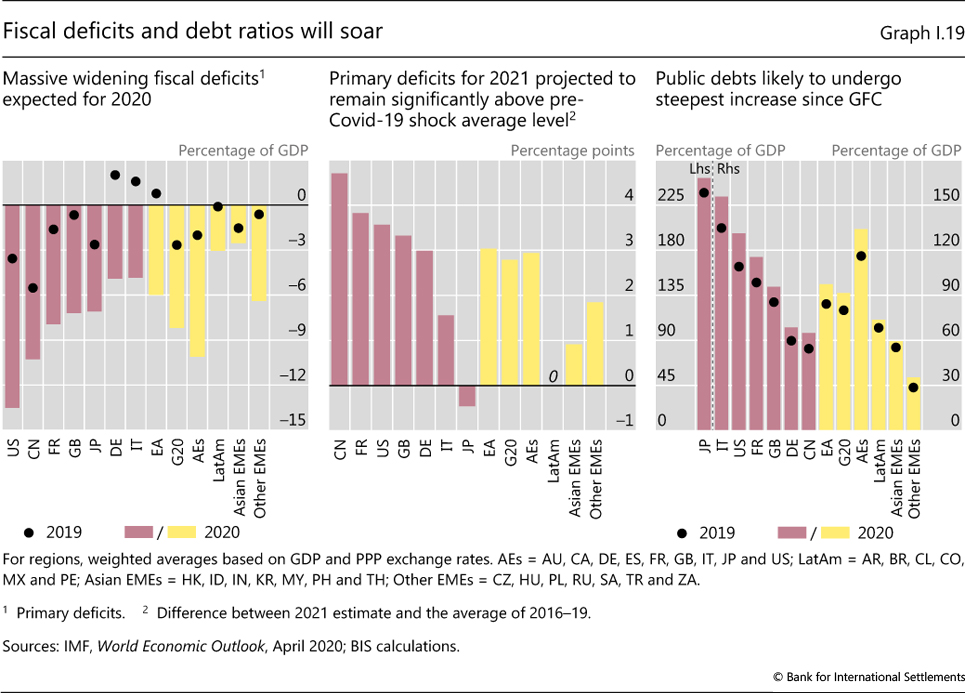
| I.19 | Fiscal deficits and debt ratios will soar | p 28 |
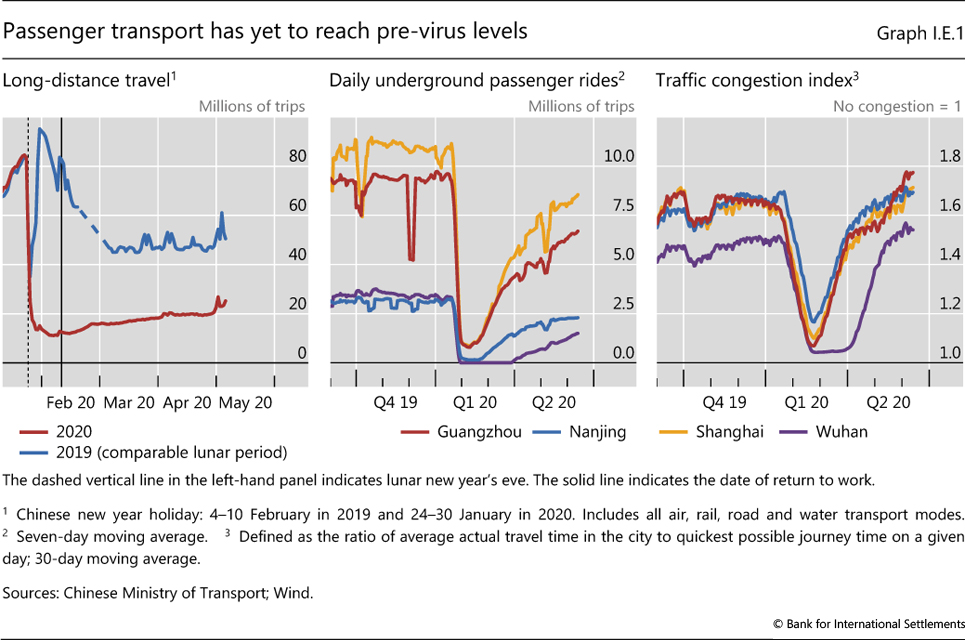
| I.E.1 | Passenger transport has yet to reach pre-virus levels | p 30 |
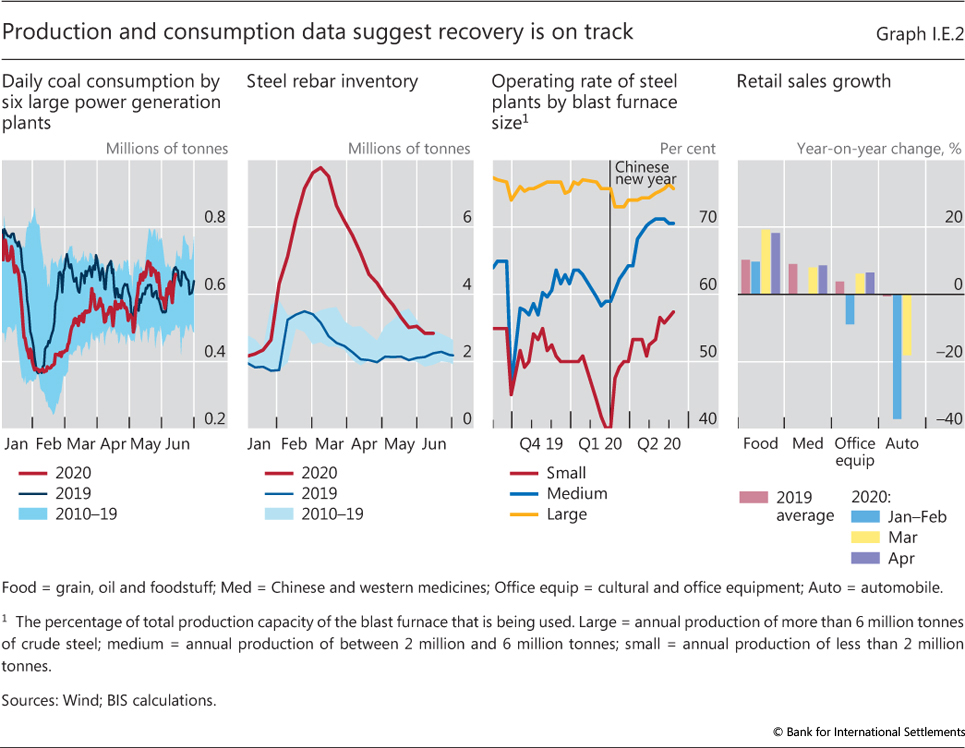
| I.E.2 | Production and consumption data suggest recovery is on track | p 31 |
| Chapter II: data behind the graphs (xlsx) | ||
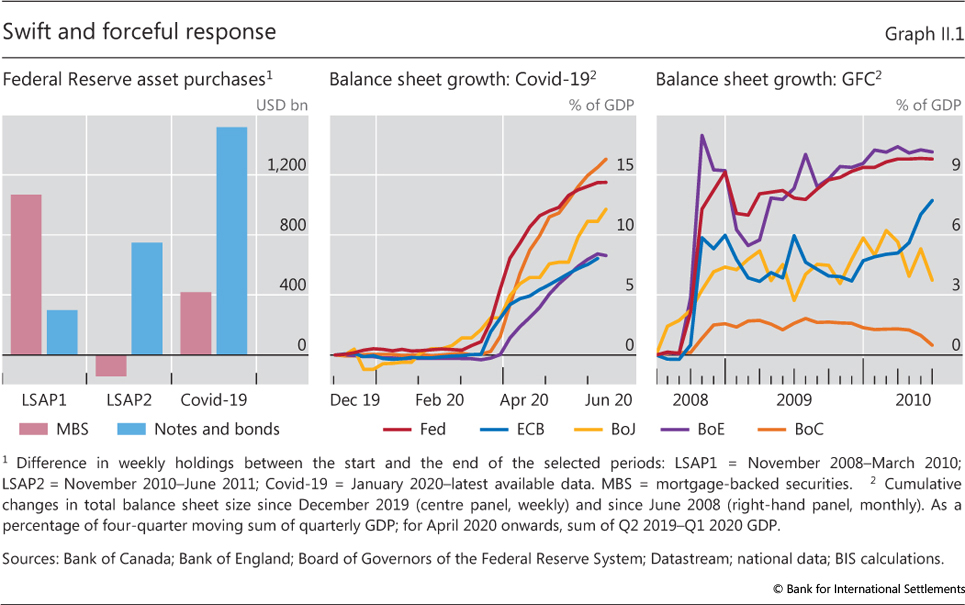
| II.1 | Swift and forceful response | p 38 |
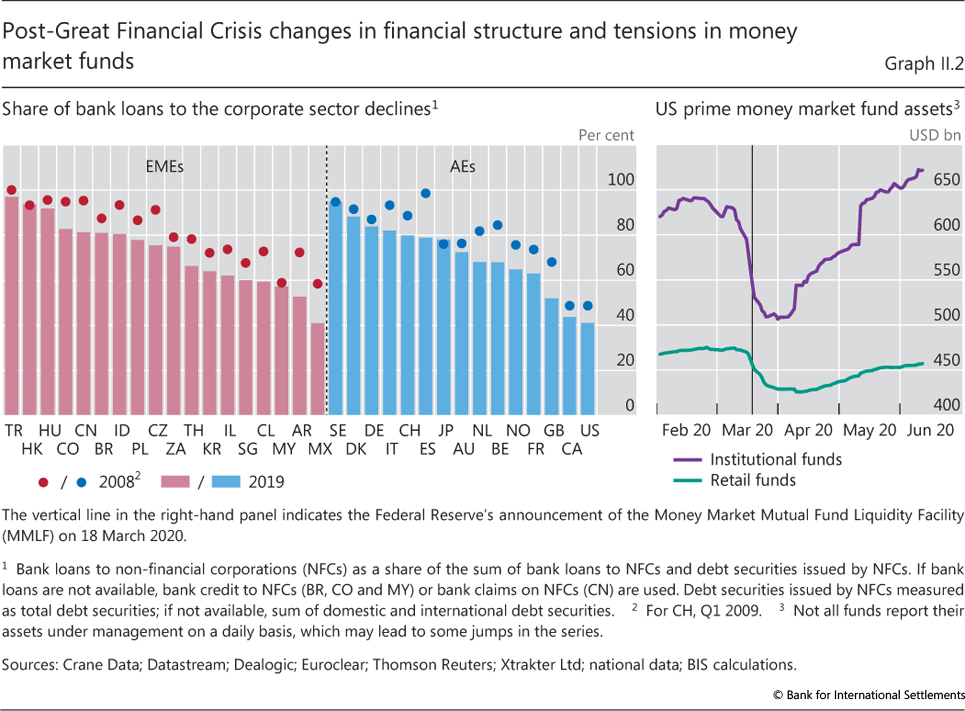
| II.2 | Post-Great Financial Crisis changes in financial structure and tensions in money market funds | p 41 |
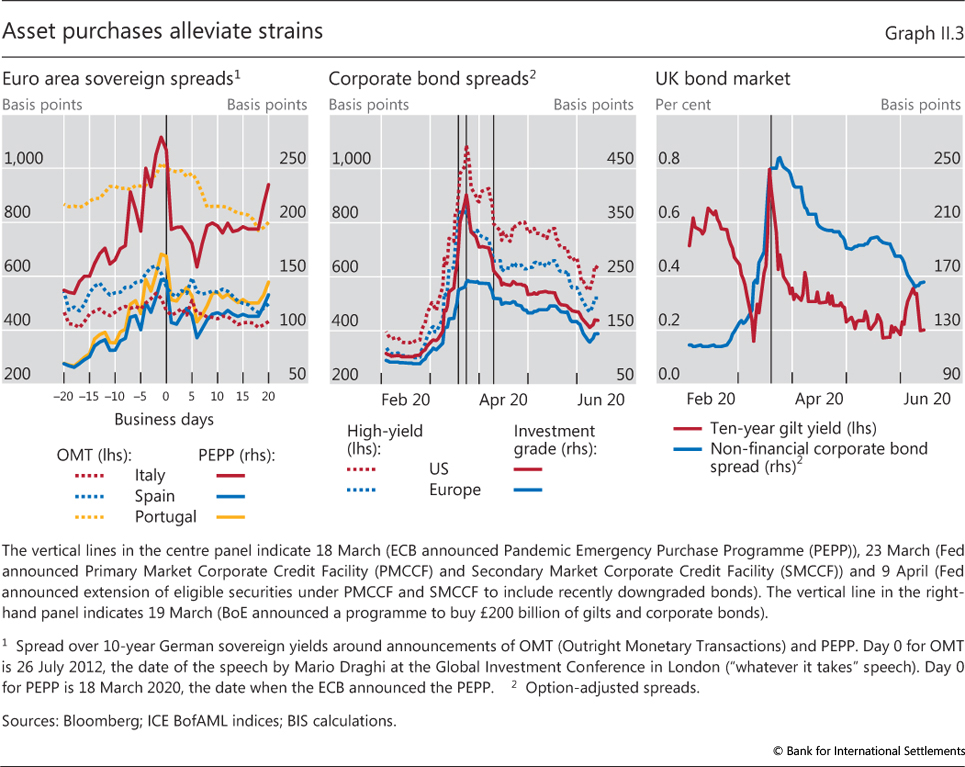
| II.3 | Asset purchases alleviate strains | p 42 |
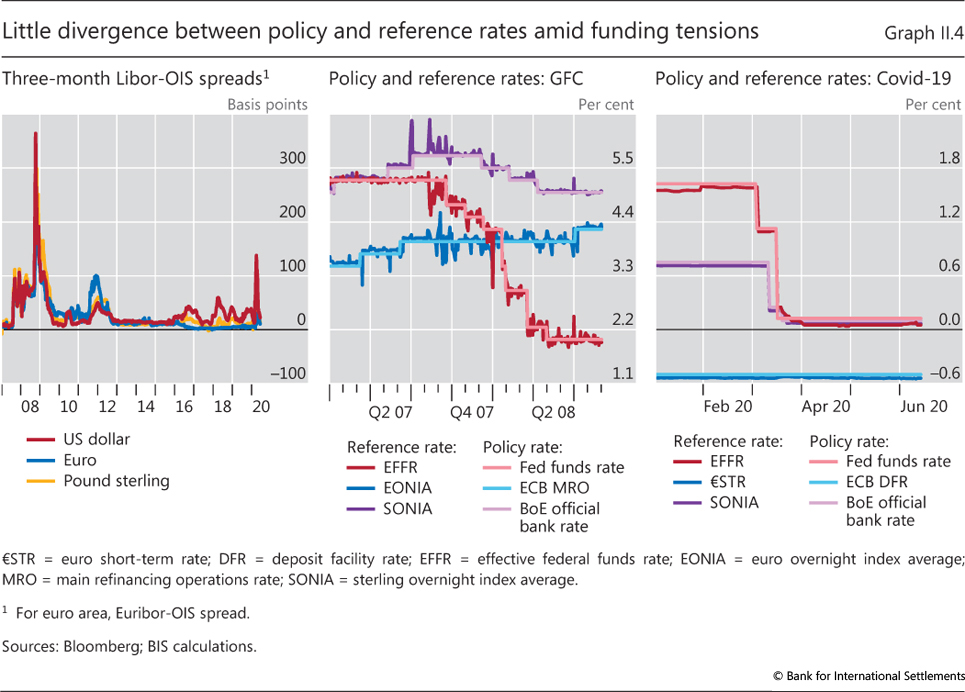
| II.4 | Little divergence between policy and reference rates amid funding tensions | p 43 |
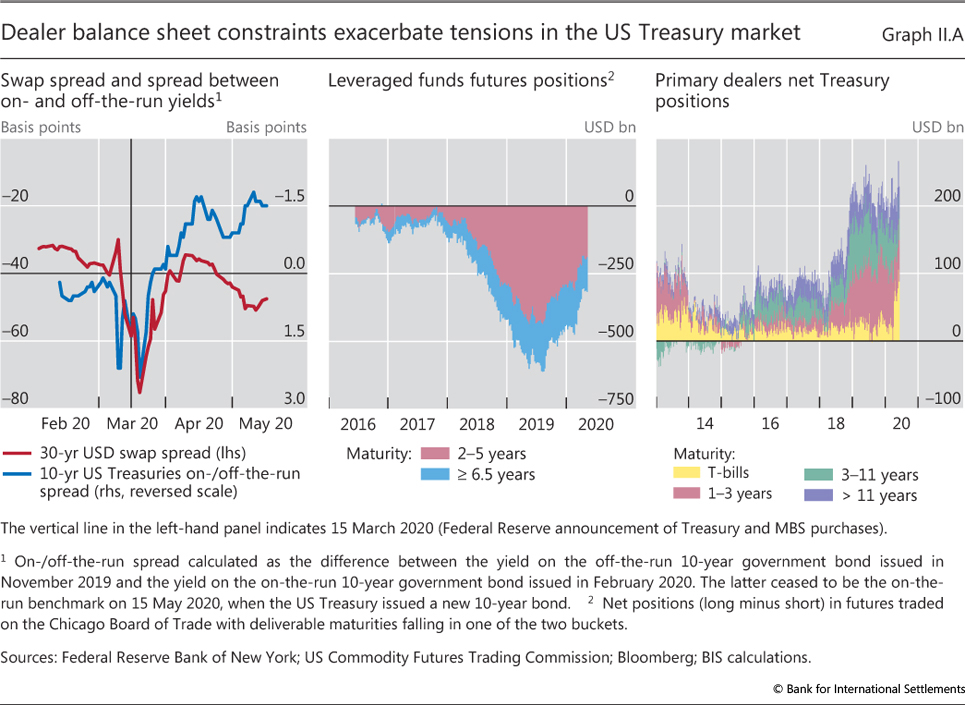
| II.A | Dealer balance sheet constraints exacerbate tensions in the US Treasury market | p 44 |
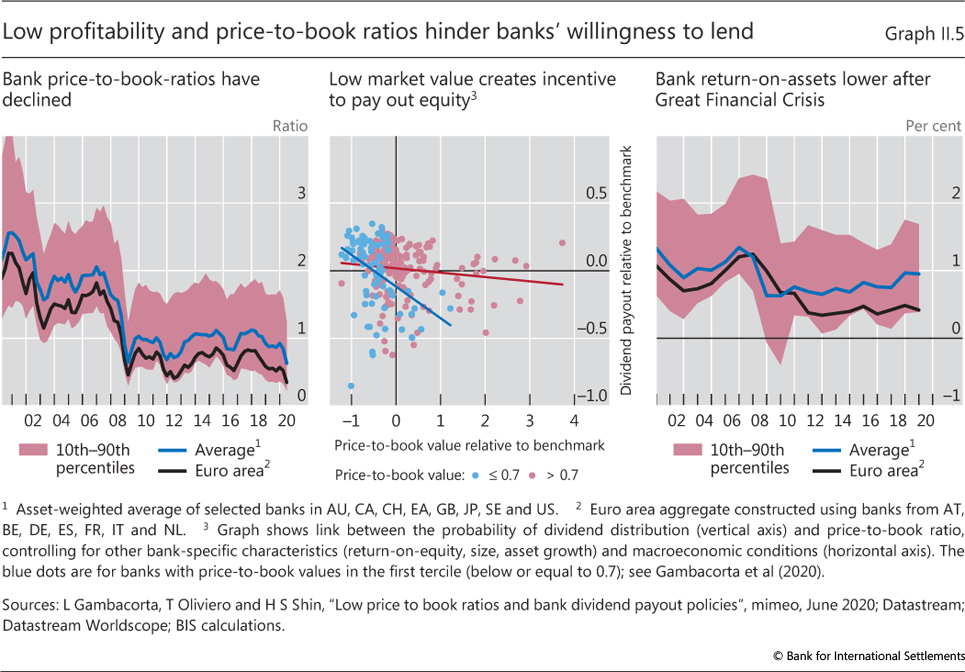
| II.5 | Low profitability and price-to-book ratios hinder banks' willingness to lend | p 46 |
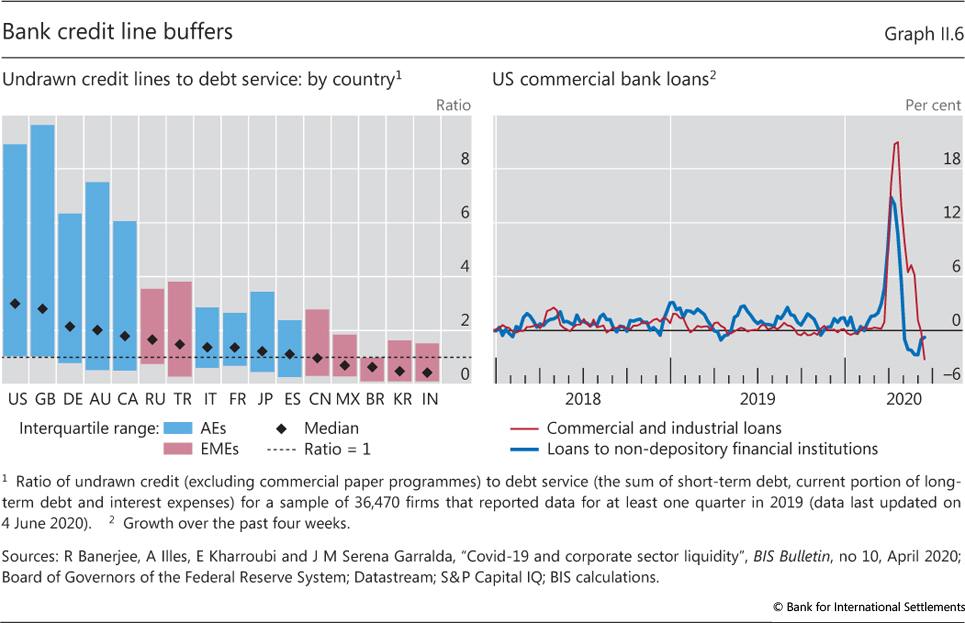
| II.6 | Bank credit line buffers | p 47 |
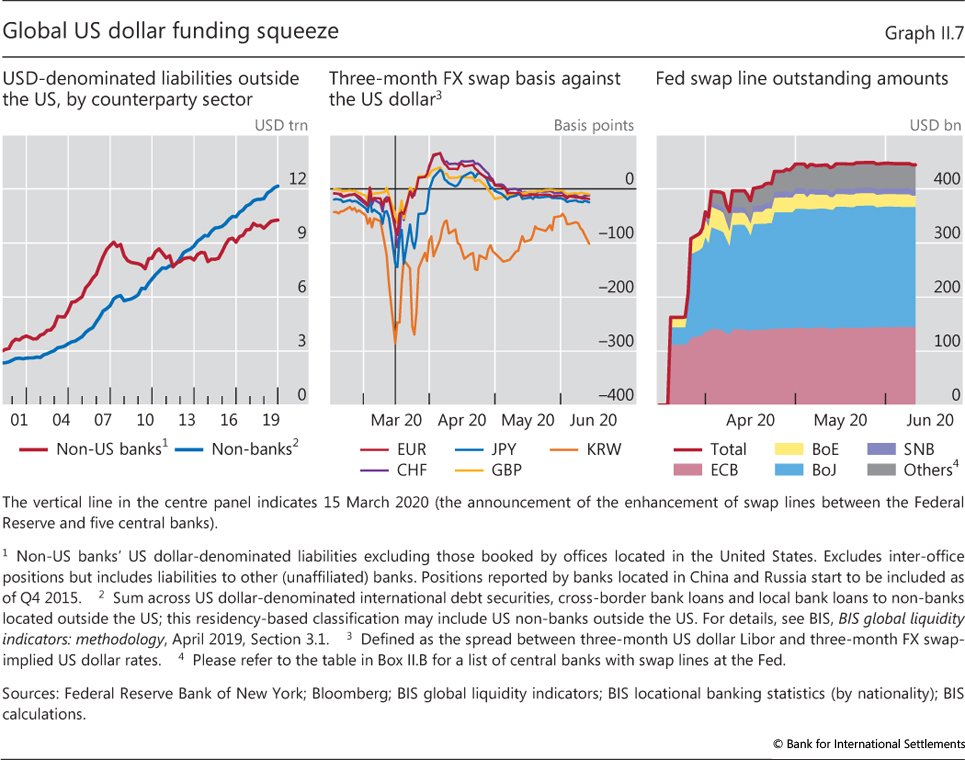
| II.7 | Global US dollar funding squeeze | p 48 |
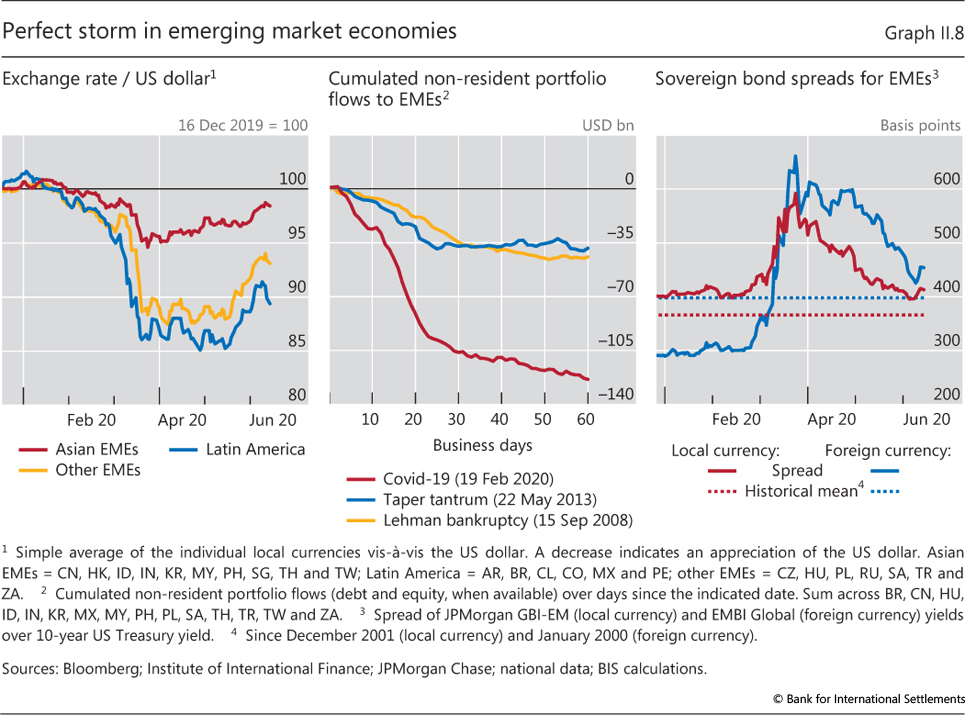
| II.8 | Perfect storm in emerging market economies | p 51 |
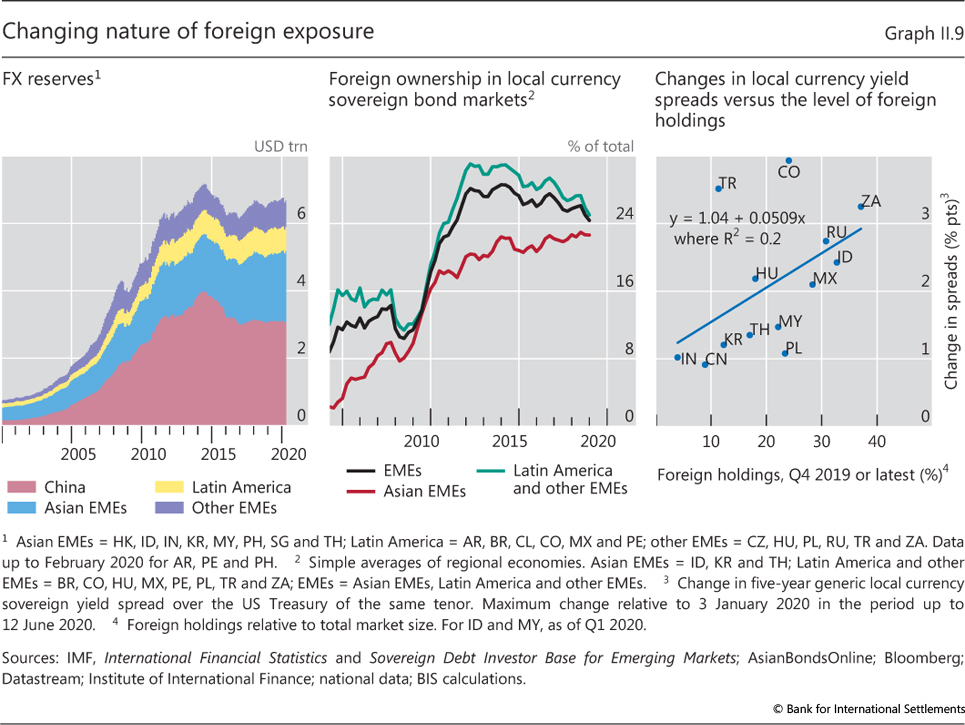
| II.9 | Changing nature of foreign exposure | p 52 |
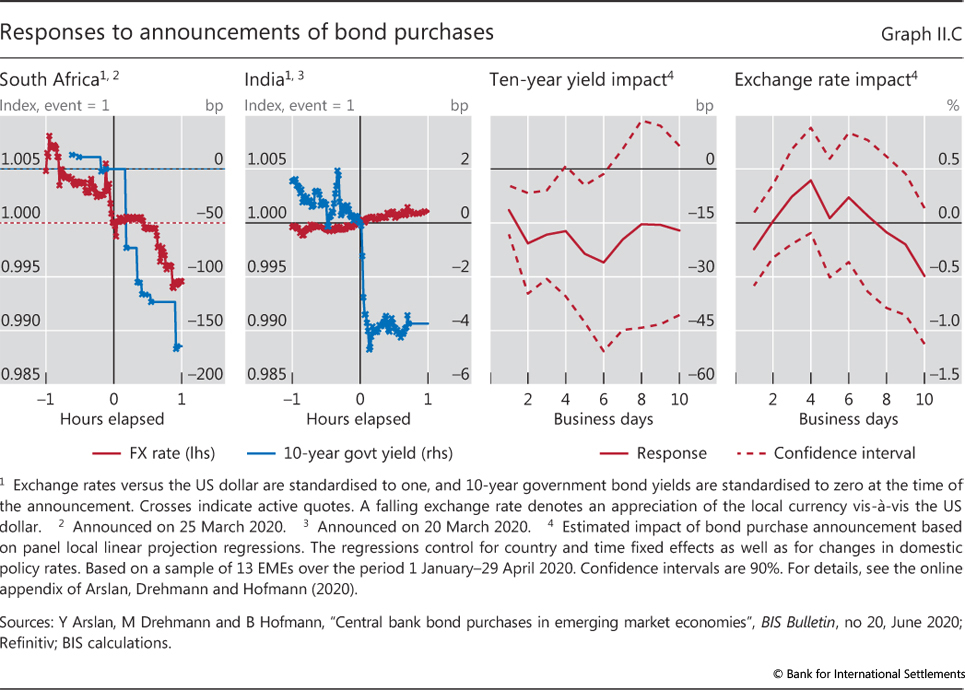
| II.C | Responses to announcements of bond purchases | p 53 |
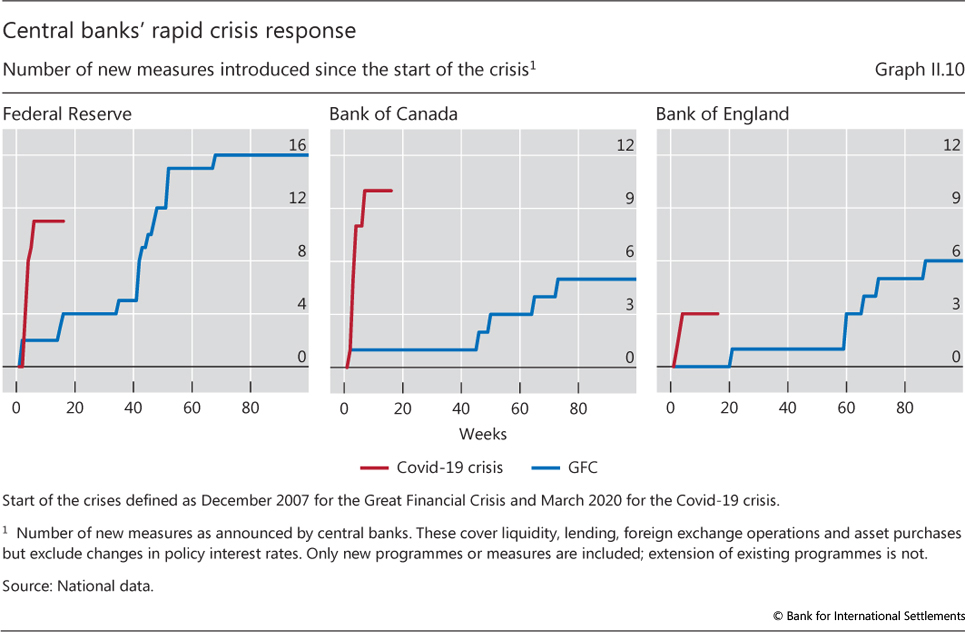
| II.10 | Central banks' rapid crisis response | p 55 |
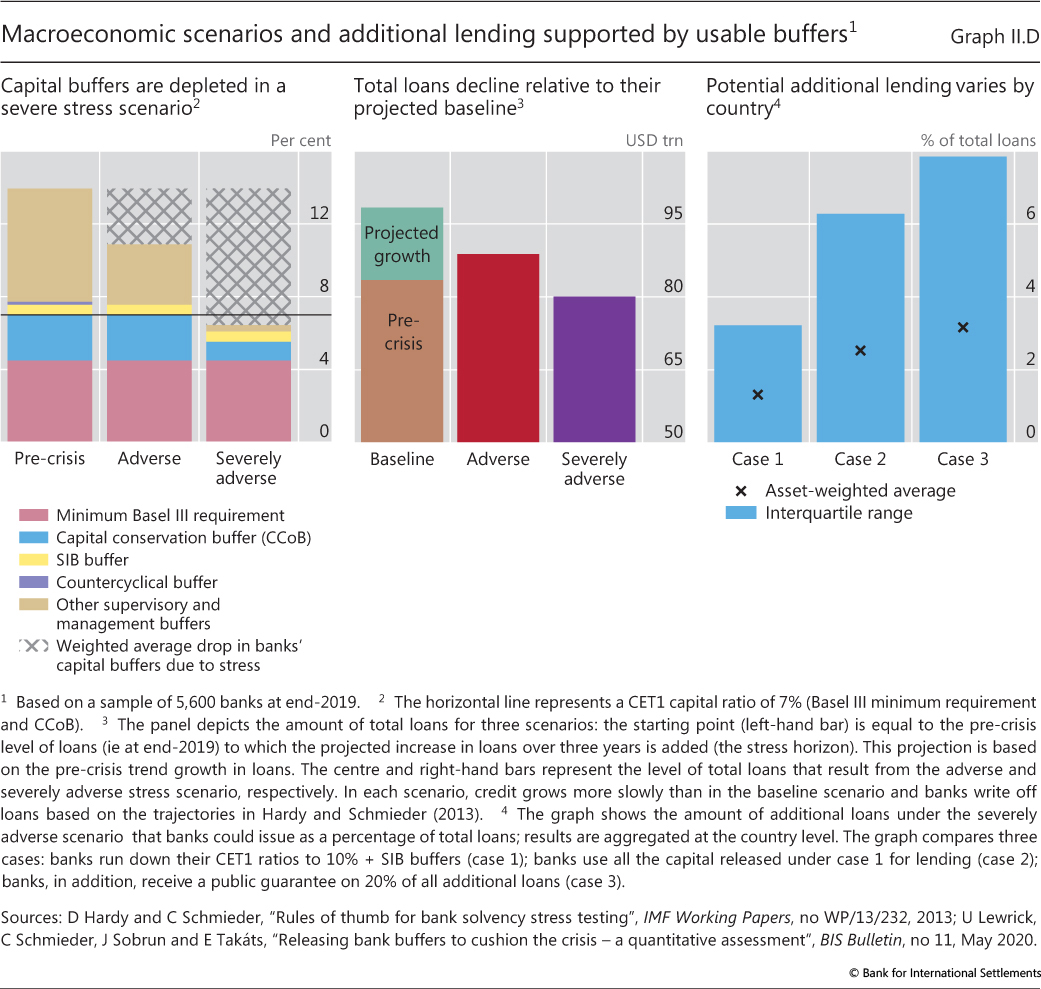
| II.D | Macroeconomic scenarios and additional lending supported by usable buffers | p 59 |
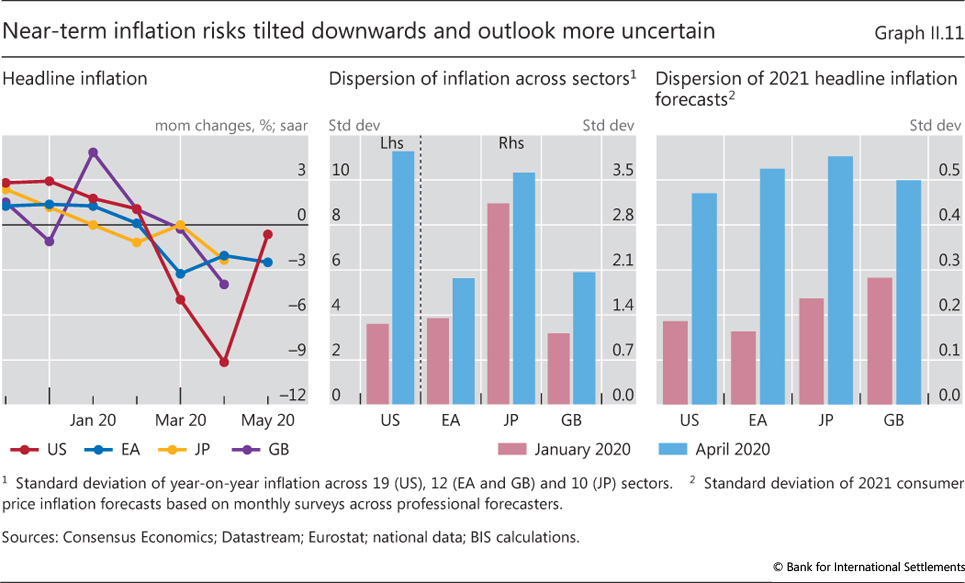
| II.11 | Near-term inflation risks tilted downwards and outlook more uncertain | p 61 |
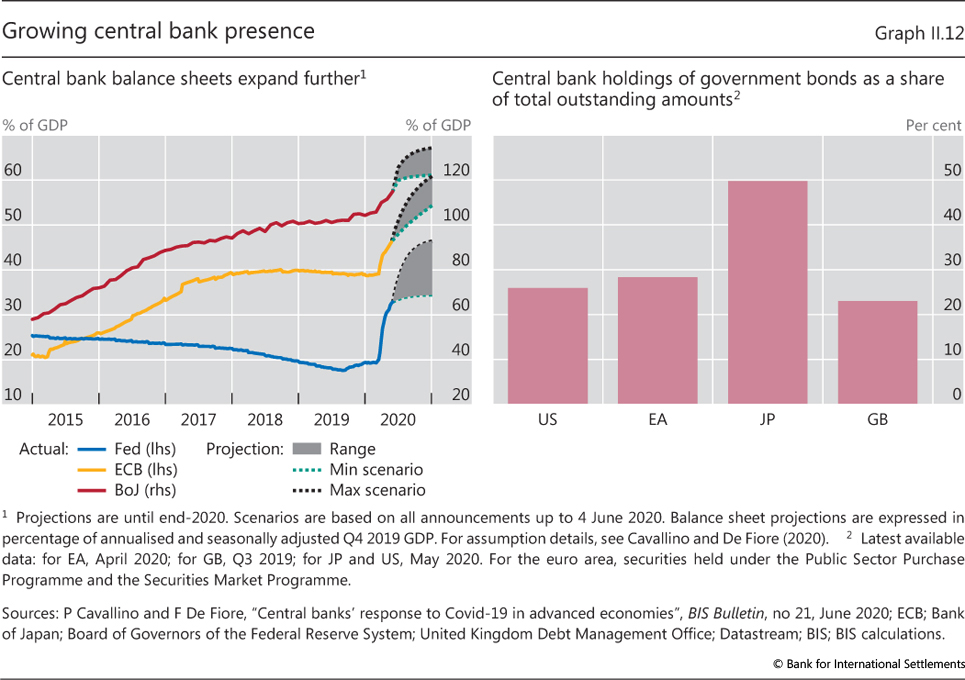
| II.12 | Growing central bank presence | p 62 |
| Chapter III: data behind the graphs (xlsx) | ||
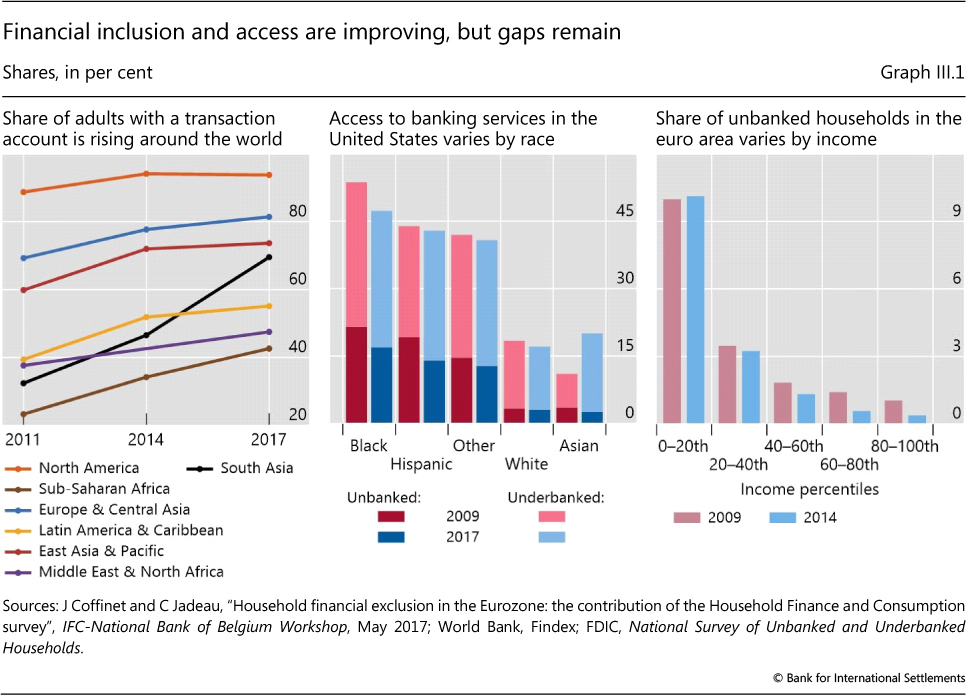
| III.1 | Financial inclusion and access are improving, but gaps remain | p 72 |
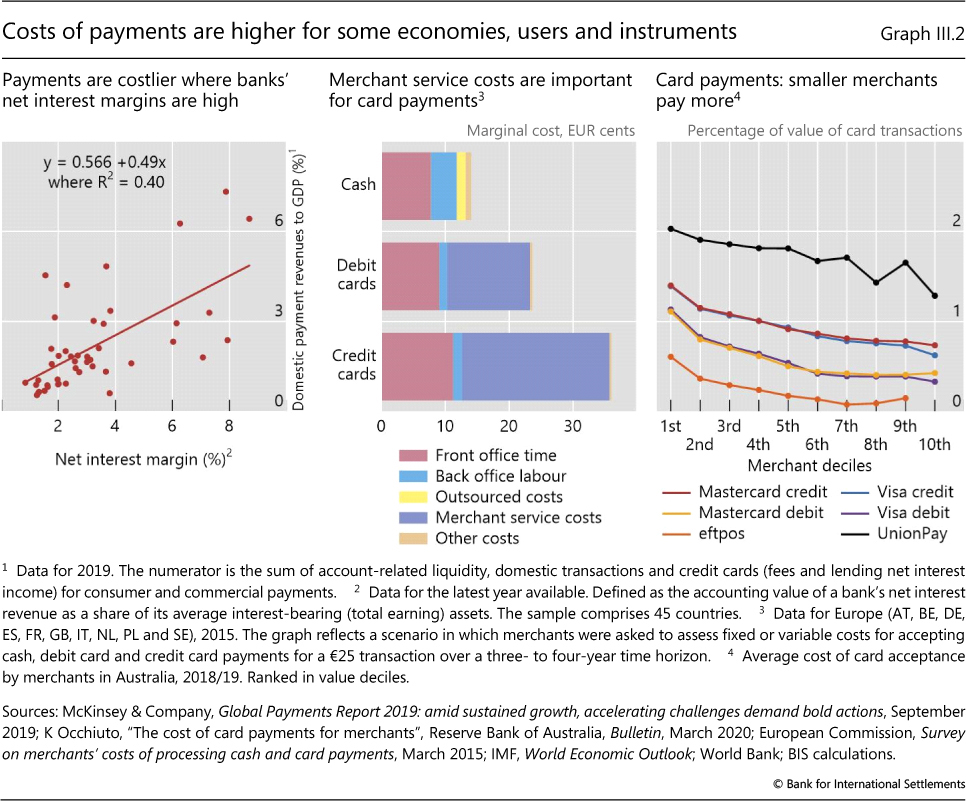
| III.2 | Costs of payments are higher for some economies, users and instruments | p 74 |
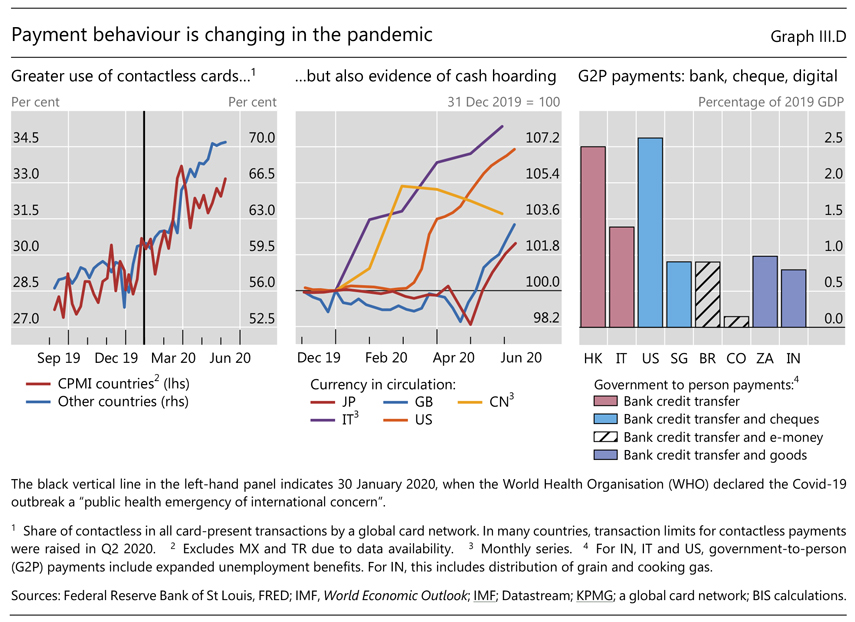
| III.D | Payment behaviour is changing in the pandemic | p 76 |
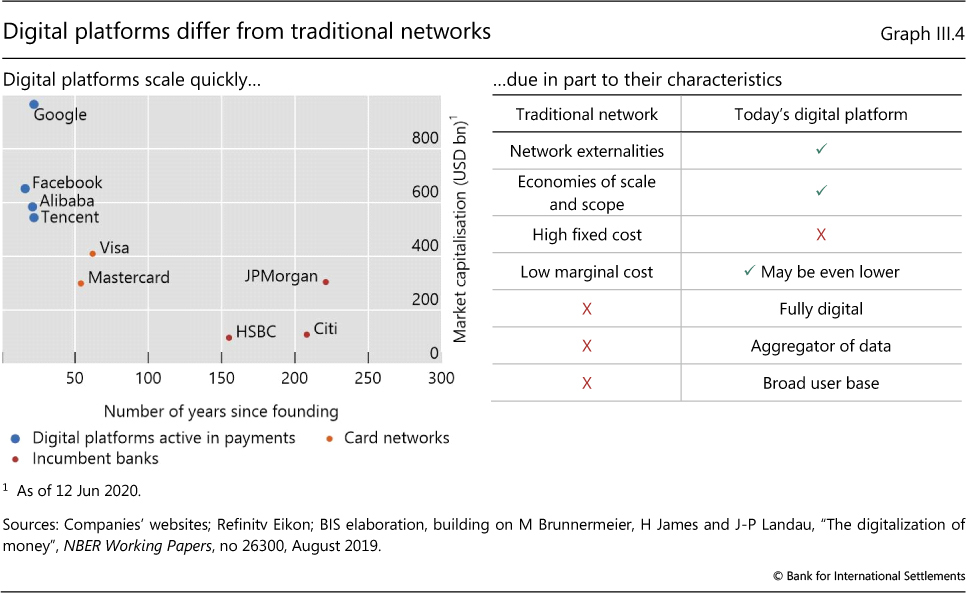
| III.4 | Digital platforms differ from traditional networks | p 78 |
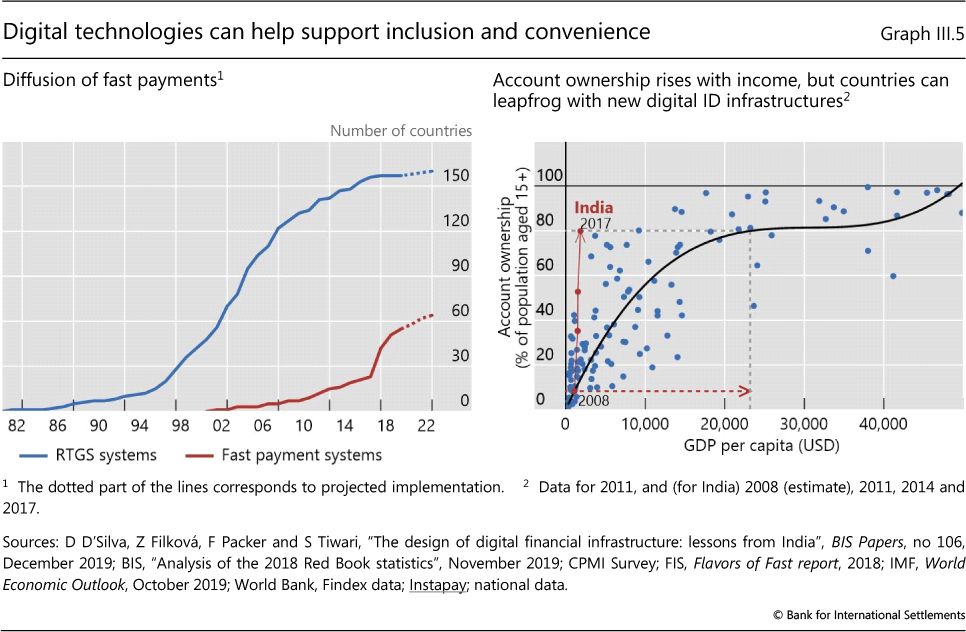
| III.5 | Digital technologies can help support inclusion and convenience | p 80 |
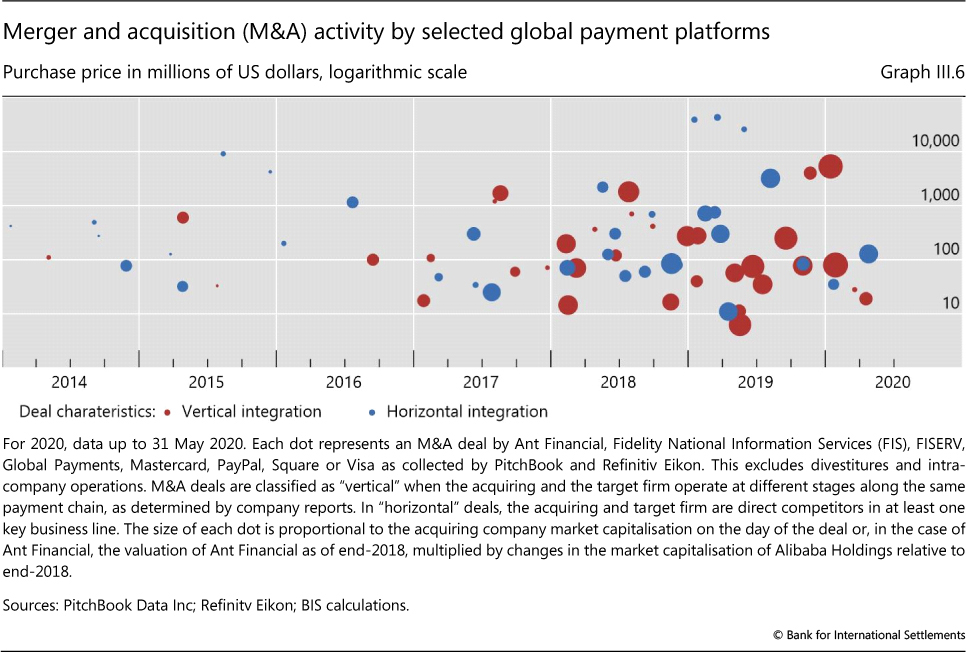
| III.6 | Merger and acquisition (M&A) activity by selected global payment platforms | p 83 |
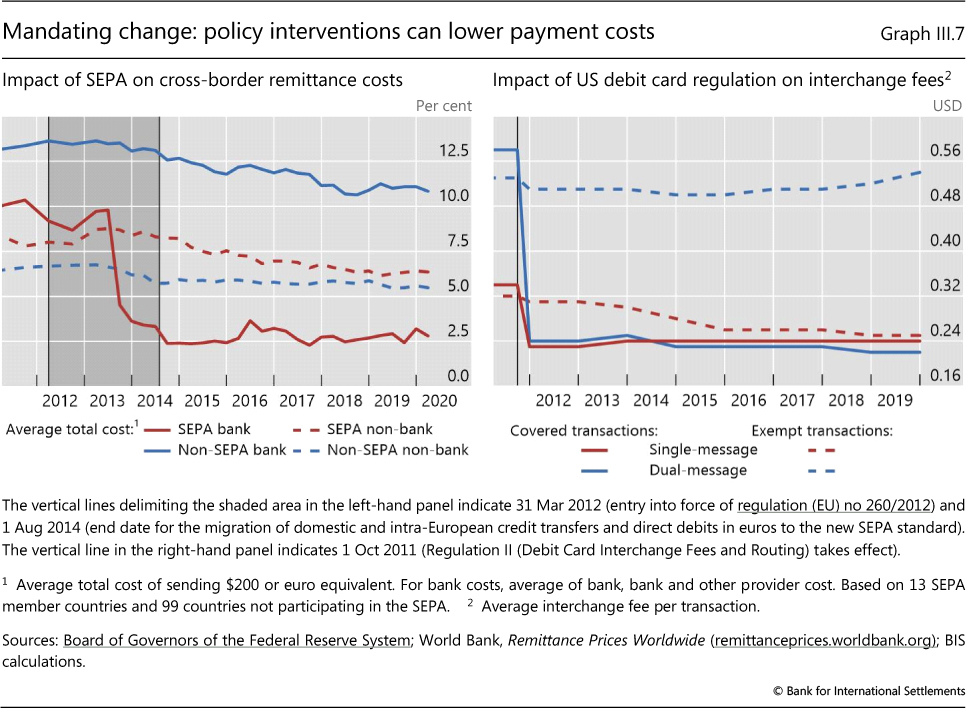
| III.7 | Mandating change: policy interventions can lower payment costs | p 84 |
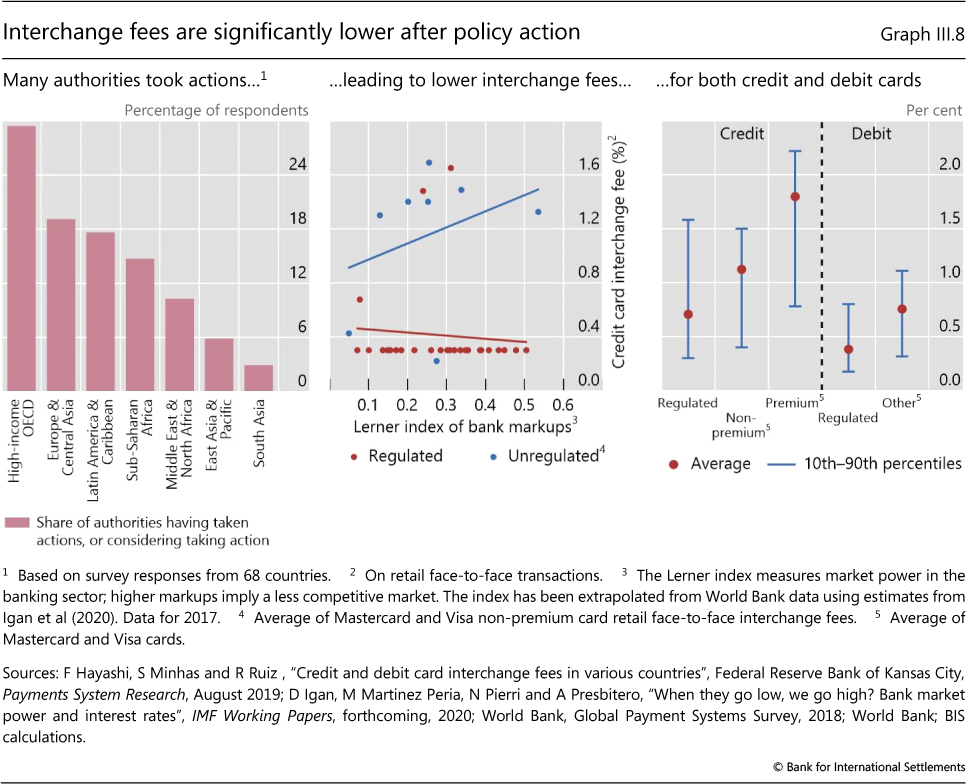
| III.8 | Default Interchange fees are significantly lower after policy action | p 85 |
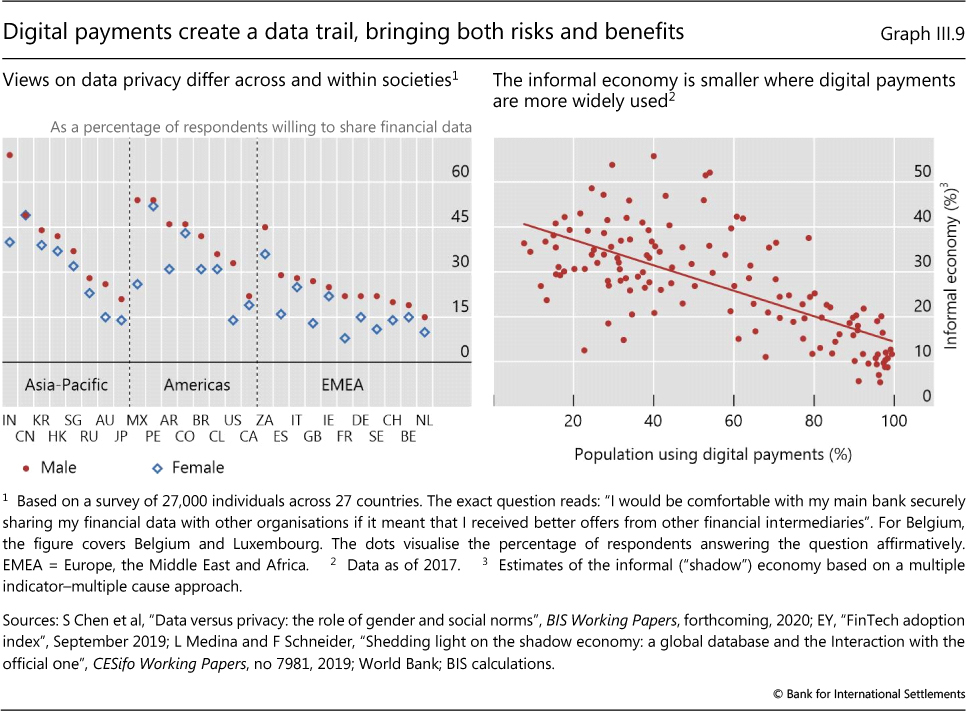
| III.9 | Digital payments create a data trail, bringing both risks and benefits | p 86 |
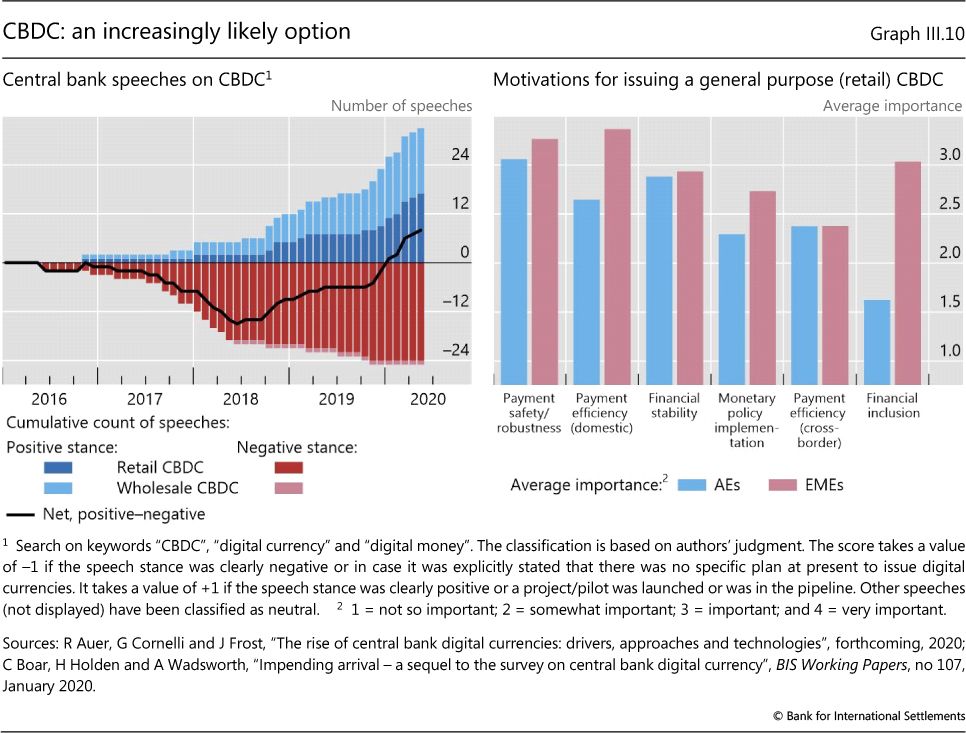
| III.10 | CBDC: an increasingly likely option | p 88 |