Easing trade tensions lift sentiment
An easing of US-China trade tensions in October triggered a risk-on phase in global financial markets.1 In September, risky asset prices across the globe stayed range-bound, supported by additional monetary accommodation in a context of subdued prospects for global activity. As sentiment shifted, stocks posted large gains in most markets but China, and credit spreads tightened. Term spreads in advanced economies (AEs) initially widened in line with the change in market sentiment. But their upward momentum petered out after a few weeks.
Faced with persistently low inflation and a still tepid outlook for growth, central banks eased further in several major economies. Policy rates were lowered in the United States, the euro area and a number of emerging market economies (EMEs), including Brazil, China, Indonesia and Mexico. The ECB restarted its programme of government bond purchases.
As sentiment shifted with more constructive developments in the US-China relationship (and better prospects for an orderly Brexit), equities rose across the globe, with the notable exception of Chinese stocks, which lost ground in October and November. In the United States, stock prices reached historically high levels, with risk appetite spurred by a still resilient consumer sector, early signs of stabilisation in manufacturing and earnings reports that came in line with - or slightly ahead of - expectations. Sentiment was also helped by still patchy evidence in October's activity gauges that several economies, advanced and emerging, were bottoming out.
Corporate spreads fell globally and long-term sovereign yields rose in AEs. Spreads on euro area and US corporate bonds declined, especially for investment grade issuers. In the high-yield segment, and also EME corporates, spreads widened in late September but compressed again in mid-October as the news turned more positive. Government bond yields rose, steepening yield curves, but long bond yields traced back some of their gains in November.
As the demand for safe assets retreated, the US dollar weakened broadly, in particular against EME currencies. EME sovereign yields, little affected by sentiment swings, continued on the downward trend that prevailed for most of the year.
Loose financial conditions intensified the focus on the sustainability of asset valuations. Corporate bonds appeared relatively expensive, particularly in the light of the still comparatively subdued economic outlook. Equity valuations seemed high in the United States compared with historical averages, but were moderate in most other countries and relative to sovereign yields. However, investors' compensation for bearing equity risk seems to hinge on the term premium; to the extent that the premium is unusually low, it may flatter valuations.
Lingering worries initially keep markets range-bound
Financial markets mainly reflected the ebb and flow of trade tensions during the period under review. Early on, sentiment stayed subdued and risky assets traded sideways, as investors continued to struggle with the uncertain outlook stemming from enduring US-China tensions and lingering signs of weakness in manufacturing. Faced with a deteriorating macroeconomic outlook, central banks in several jurisdictions chose to provide further monetary accommodation.
Sentiment remained downcast in September, despite the United States and China taking several steps to soothe the escalation of tensions that had occurred in August.2 Early in the month, they announced that a new round of talks would start in October, and mutually exempted some imports from tariffs. But asset prices stayed range-bound, suggesting investors were unpersuaded. The muted reaction reflected, in part, continued concerns about the outlook for global activity, amid signs of sluggish manufacturing, which was dismal in Europe (Graph 1, first panel), and generally downbeat in EMEs.
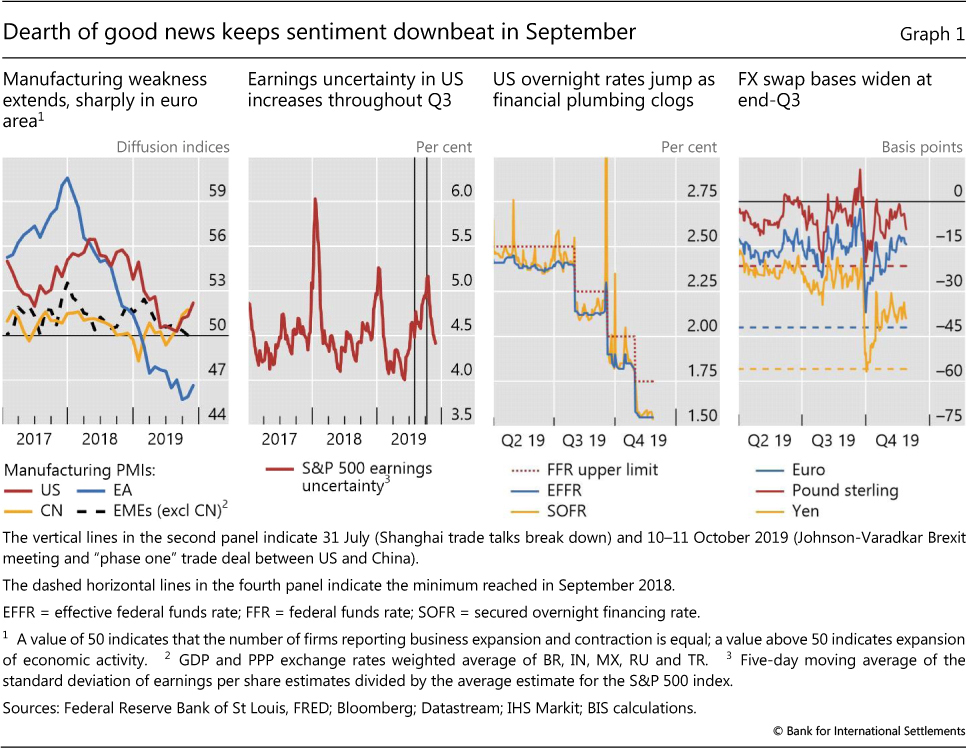
Resilient labour markets, however, sustained the momentum of consumption in AEs, including those in Europe. In the United States, uncertainty over corporate earnings prospects, growing pari passu with trade tensions (Graph 1, second panel), also contributed to keeping equities flat throughout the third quarter.
Other developments in September were not reassuring. Throughout the month, a fluid political situation in the United Kingdom appeared, at first, to strengthen the likelihood of a "no-deal" Brexit. In mid-September, oil prices jumped by almost 15% after an attack on oil facilities in Saudi Arabia. This was the largest daily spike in oil prices in almost 20 years, but prices fell back again within days.
Also in September, sudden stress in the US repo market raised concerns about the fragility of US dollar funding markets (see box). The benchmark repo rate (secured overnight financing rate, SOFR) more than doubled for a day, and the effective federal funds rate overshot the upper limit of the Federal Reserve's policy range (Graph 1, third panel). Actions by the Federal Reserve returned calm to this market, and the dislocation did not spread. However, the bases of major currency FX swaps, another key funding market, plummeted at the quarter-end, in a repeat of the stress observed the previous September (fourth panel). Observers worried about the prospects of renewed dislocations in these markets as the year-end approached.
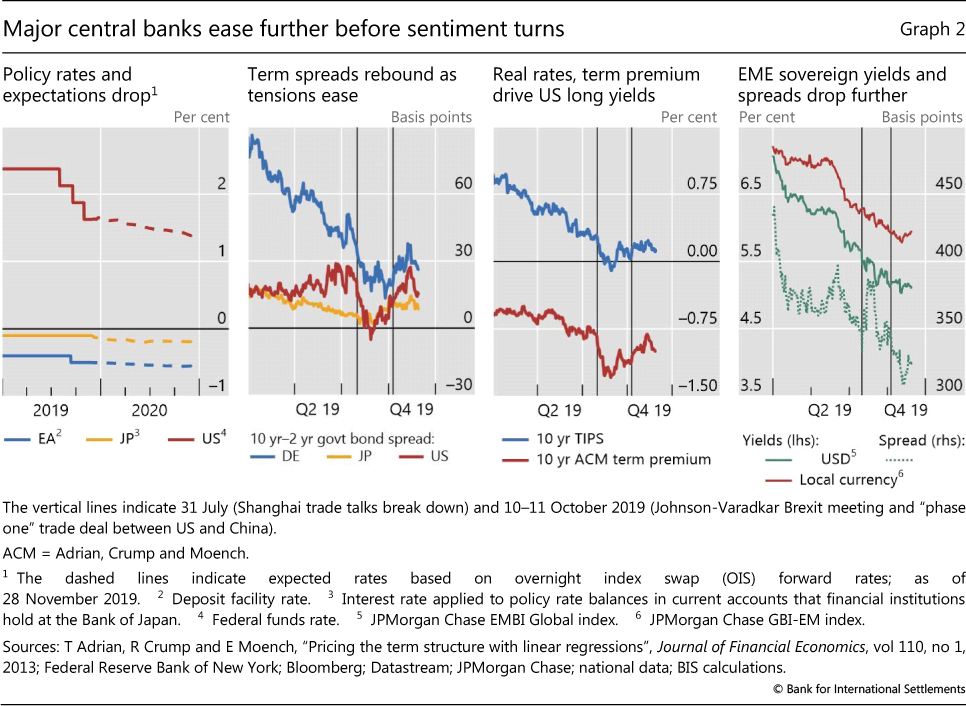
Confronted with the combination of tepid activity and persistent low inflation, central banks in major economies eased monetary policy further. On 12 September, the ECB announced the resumption of the government bond purchase programme, a 10 basis point reduction in the deposit rate, lower rates for the longer-term refinancing operations and a new system of tiered remuneration of bank reserves to contain the effect of more negative interest rates on bank profitability. The Federal Reserve cut its policy rate twice, in September and October, in line with market expectations, but signalled that more reductions this year were unlikely. Nevertheless, forward rates indicated expectations of further declines in policy rates in 2020 (Graph 2, first panel).
Several other central banks in AEs and EMEs echoed moves by the Fed and the ECB. In late September and throughout October, Australia, Brazil, India, Korea, Mexico, Russia and Turkey lowered their policy rates. After keeping interbank rates broadly stable for most of the year, the People's Bank of China (PBC) cut its one-year rate in early November, and then its seven-day interbank rate mid-month. Observers disagreed on the future path of monetary policy, as the PBC faced several challenges, including a perceived commitment to the deleveraging of the economy, weak economic activity, some degree of stress in local banks and rising inflation as food pushed consumer prices up. The Bank of Japan stayed on the sidelines, on the back of its assessment about the Japanese economy's prospects.
Easing tensions drive up sentiment and asset prices
An easing of geopolitical tensions during the first half of October set the stage for a turn in market sentiment. Moreover, tentative signs of stabilisation in global activity started to emerge. With prospects improving for both a Brexit deal and a sustained truce in trade tensions between the United States and China, a wave of risk appetite took hold of markets.
The mood started to improve in mid-October. After a meeting of the UK and Irish prime ministers on 10 October defused concerns of a "no-deal" Brexit, sterling regained some ground. The following day, the announcement of a limited "phase one" deal between China and the United States marked an inflexion point for asset prices. The rally was further spurred by tentative clues that economic activity in several countries had bottomed out: manufacturing PMIs appeared to bounce back modestly in the United States, and new manufacturing orders in Germany improved, though PMIs in Europe and other AEs remained less upbeat. In EMEs the picture was mixed, pointing to regional cleavages: conditions appeared to improve in an Asian bellwether like Chinese Taipei, but survey data from Korea and Malaysia still lagged. In Latin America, Brazil continued posting moderate yet solid activity numbers, but Mexico remained less dynamic. Emerging Europe was still fairly weak. In the United States, the concerns about earnings were dispelled by reports that generally came out in line with - or slightly above - expectations.
Government bond markets in AEs reacted, initially, in risk-on fashion. After flattening most of the year, yield curves steepened, mainly as a result of increases at the long end (Graph 2, second panel). In the United States, the upswing was driven in part by higher real long-term rates, as indicated by higher yields of Treasury Inflation-protected Securities (TIPS), a market gauge of real rates (third panel, blue line). Yields on 10-year TIPS had been steady since early October, possibly signalling investor confidence in a rebound in activity. The term premium embedded in the yield of the 10-year Treasury nominal benchmark also increased from historical lows - though it stayed negative - suggesting that an upward shift in risk appetite was part of the explanation (third panel, red line). Yet long yields did not sustain the upward momentum, and traced back some of their gains as November moved on.
Sovereign yields in EMEs, for debt denominated both in US dollars and local currency, continued on the downward path that dominated this year (Graph 2, fourth panel, green and red solid lines, respectively). EME yields have been gradually decreasing since the Federal Reserve's policy pivot began last November. The trend steepened especially after the Fed Chairman indicated in June that the central bank would act as appropriate to sustain the expansion in the face of economic challenges, including those emerging from trade disputes.3 Irrespective of still patchy evidence of economic rebound, EME yields were at their lowest levels since 2014.
EME sovereign spreads against US Treasury benchmarks for US dollar-denominated debt also narrowed further, again approaching post-Great Financial Crisis (GFC) lows (Graph 2, fourth panel, dotted green line). Spreads had recently been more volatile than yields, but most of that volatility stemmed from wide fluctuations in US Treasury benchmarks, not in EME yields. These patterns suggested that, in an unusual reversal, swings in market sentiment had a more pronounced effect in the pricing of AE fixed income. Rising EME government debt, which has surpassed 50% of GDP on the global average and was on its way to surpassing 70% of GDP in some regions by year-end,4 did not deter investors: not only emerging market but also frontier, or pre-emerging market, economies were able to place large amounts of debt this year (see next section).
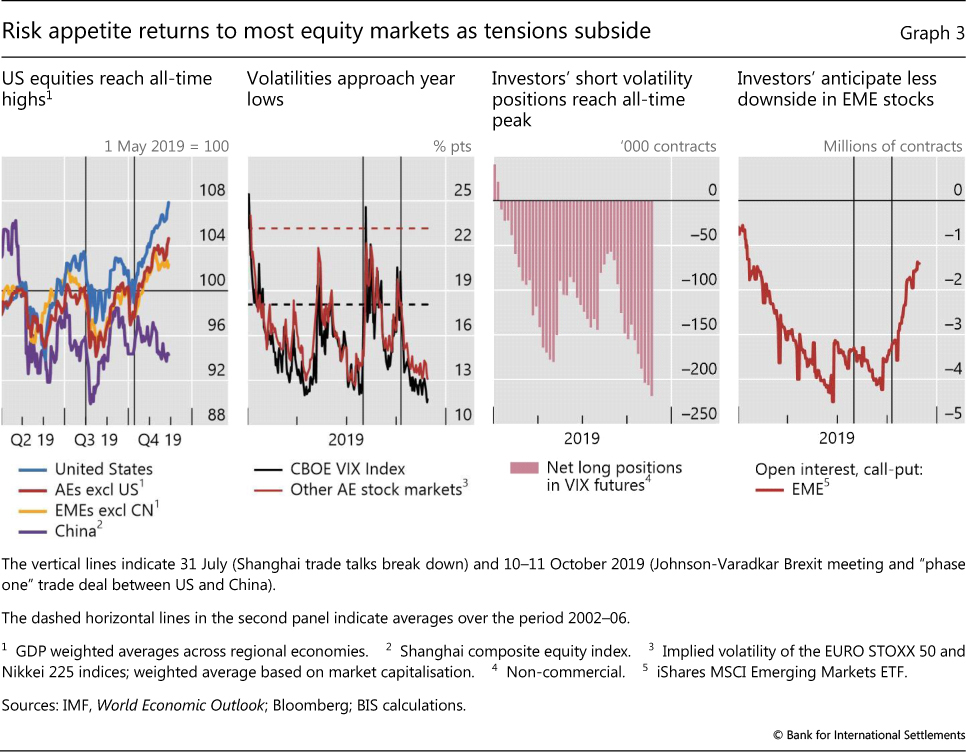
In October, stock markets broke out of the range in which they had been trading since mid-year. Benchmarks in advanced and emerging market economies other than China touched year highs in November (Graph 3, first panel). In the United States, the major stock indices reached new all-time peaks. With investors seemingly convinced that the economic and trade outlook had improved, forward-looking gauges of stock market volatility approached their minima for the year (second panel) and net short speculative positions on VIX futures also reached an all-time high, pointing to investors' renewed appetite for risk (third panel). Improved sentiment about EMEs carried over to option markets, where investors moved away from positions that would protect them from downside risk (fourth panel). Yet the contrast with the restrained response of Chinese stock markets and the still limited evidence of a rebound in global activity begged the question of whether stock prices might be running ahead of themselves in some markets.
Corporate spreads tightened across credit rating categories. Investment grade in the United States and Europe (Graph 4, left-hand panel) and EME corporate debt (centre panel, yellow line) rallied in October and their spreads also approached minima for the year. While it had been broadly stable over the past three years, corporate debt in EMEs remained relatively high, with credit to non-financial corporates around 100% of GDP. Corporate bond spreads continued to be sensitive to developments in trade tensions. In particular, US and European high-yield spreads tightened in October, after widening in September on still disappointing economic data and simmering trade tensions. That said, spreads stayed slightly above the troughs reached earlier in the year and clearly below long-term averages (centre panel, blue and red lines).
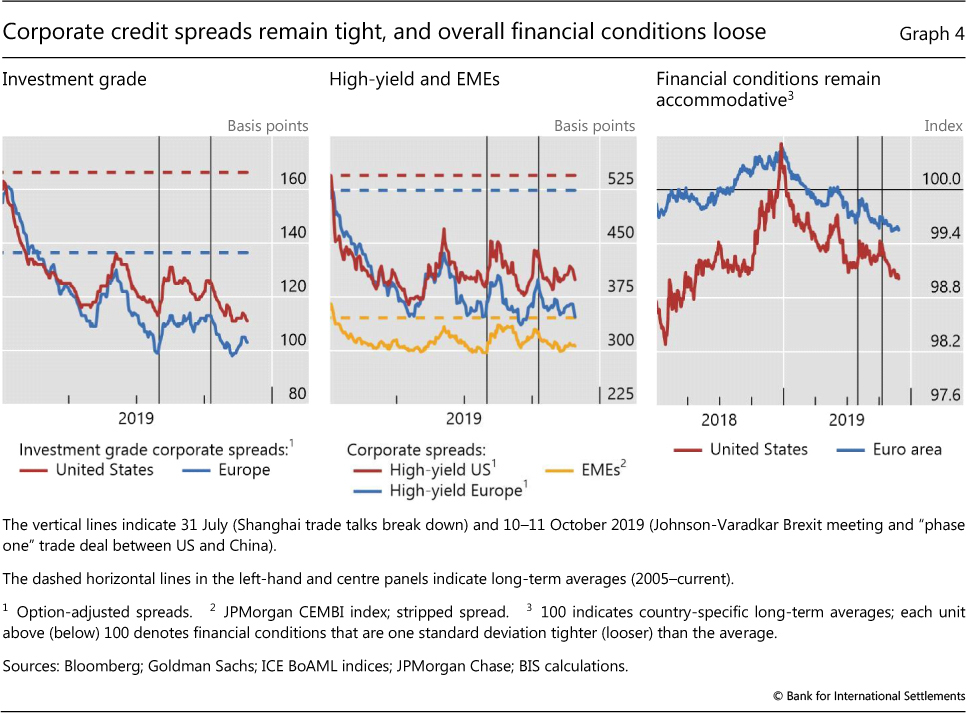
On balance, financial conditions eased further in both the United States and Europe (Graph 4, right-hand panel). In fact, with the exception of a temporary trade tension-induced deterioration in May, financial conditions had been improving since the beginning of 2019. In the United States, they were back to levels similar to those before market volatility spiked in the fourth quarter of 2018. In the euro area, financial conditions were more supportive than they had been since early 2018.
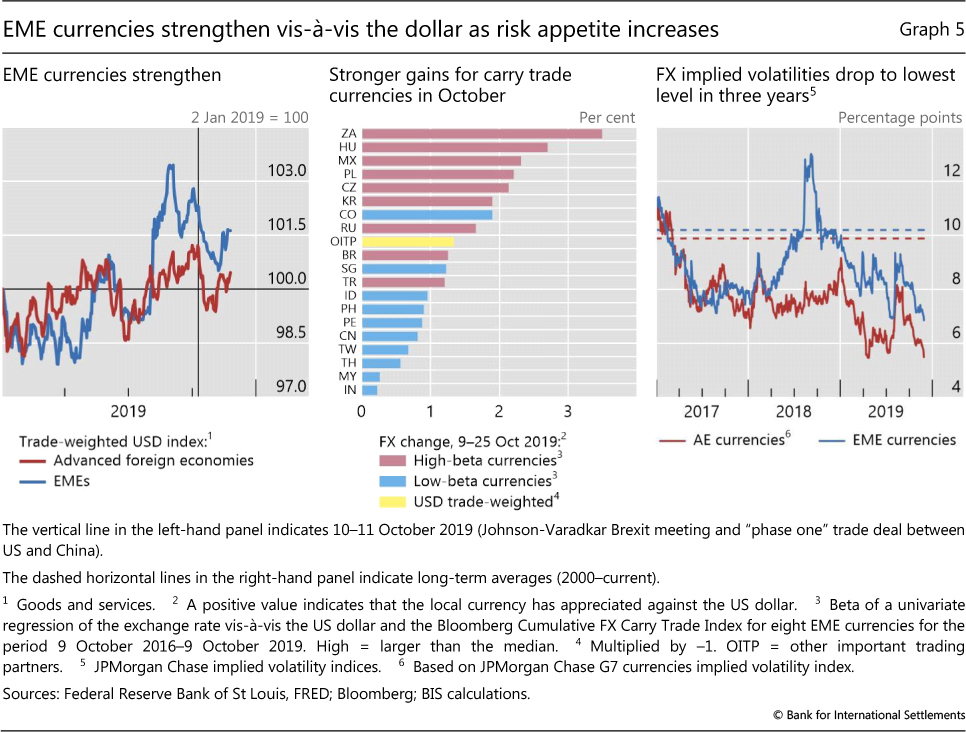
As the risk-on phase in markets gained momentum and safe asset demand retreated, the US dollar weakened. The greenback had lost some ground against EME currencies even before the announcement of the phase one trade deal between China and the United States. But the depreciation became broad-based - including against other AE currencies - after this announcement (Graph 5, left-hand panel). Other traditional safe haven currencies like the yen and the Swiss franc stayed flat or even depreciated vis-à-vis the US currency. In a further sign that risk appetite had turned, riskier EME currencies, which normally rise together with returns on carry trade strategies, gained in October more than the trade weighted benchmark (centre panel). Forward-looking gauges of FX volatility dropped to lows for the year, possibly reflecting the expectation of a sustained truce in US-China tensions (right-hand panel).
Asset valuations reflect a low term premium
As the risk-on phase set in and bond yields edged up, the term premium remained negative - something unique to the post-crisis period. The premium has been declining for about 30 years alongside bond yields. The current debate about the underlying drivers of this trend and likely persistence of the low level has heightened uncertainty about asset valuations.5 A commonly used gauge of the compensation that investors earn for bearing risk compares the yield on risky assets with government bonds. A compressed term premium depresses government bond yields and thus, to the extent that the premium is unusually low, it may flatter valuations. If the term premium is removed, certain assets appear to offer limited risk compensation.
In equity markets, there were noticeable differences in valuations across countries. Valuations were elevated in France and the United States, where in late 2019 the cyclically adjusted price/earnings (CAPE) ratio was higher than in 89% and 86% of the months since 2010, respectively. In other countries, including Germany but particularly China and Japan, CAPE ratios were closer to the bottom of their respective post-GFC ranges (Graph 6, left-hand panel).
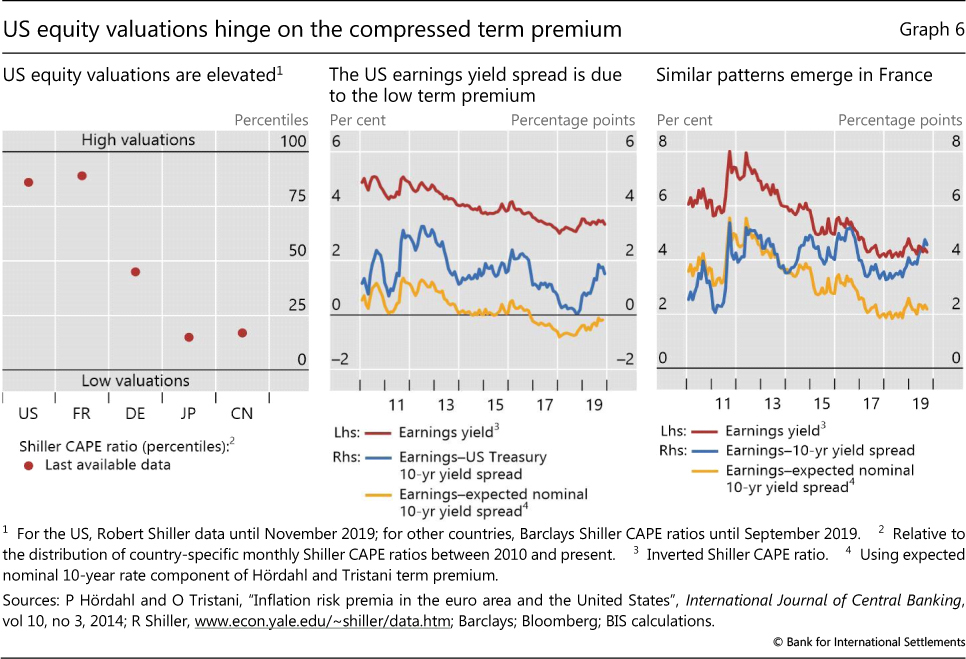
Equity valuations appear more subdued when accounting for low interest rates, in the sense that returns on equities appear to offer a sizeable compensation for risk. The earnings yield, or the inverse of the CAPE ratio, had declined steadily in the United States from the GFC until late 2017, indicating that investors paid increasingly higher prices for US equities given profitability levels (Graph 6, centre panel, red line). Since 2018, the earnings yield has slowly inched up, pointing to slightly decreasing valuations. However, the spread between the earnings yield and the 10-year Treasury yield - a valuation gauge that measures the compensation earned by investors for holding equity risk - stood at about the historical norm in late 2019 (centre panel, blue line). The level of this spread suggests that equities were not particularly expensive given the level of interest rates, and that investors were earning similar compensation for equity risk as in the past.
However, such compensation would be less benign if adjusted for the low level of the term premium. Not only was the improvement in valuations almost fully due to interest rates, it was largely driven by the decline of the term premium, which is a fairly volatile component of interest rates. The earnings yield spread relative to the expected nominal US Treasury rate - that is, after removing the term premium from interest rates - was quite low by historical standards (Graph 6, centre panel, yellow line). In fact, it suggested that investors were receiving little compensation for equity risk. Similar patterns could be observed for French equities (right-hand panel).
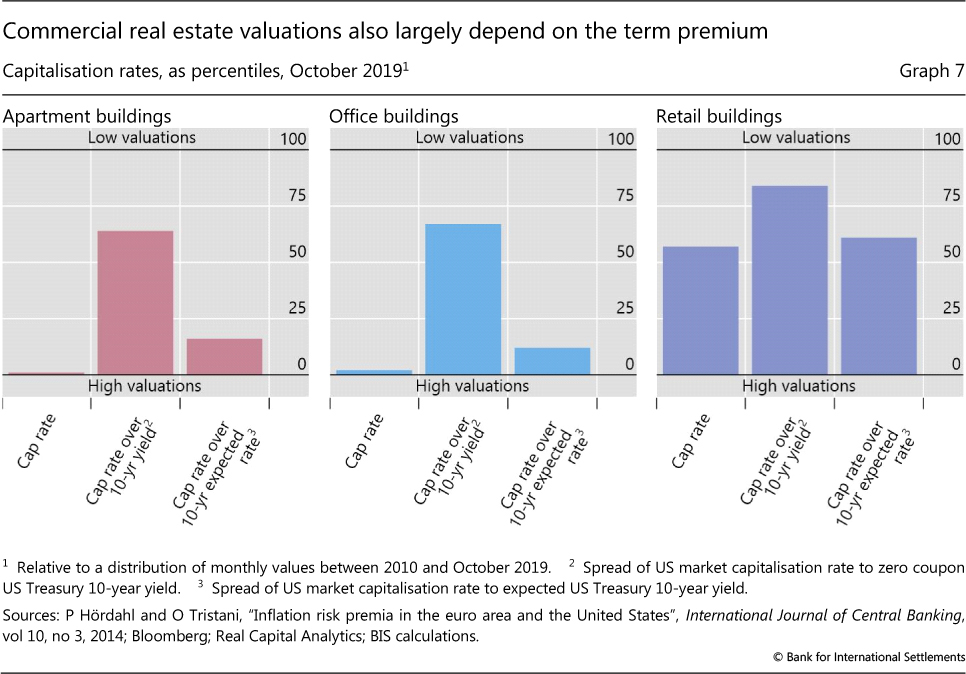
Valuations in US commercial real estate (CRE) markets also seem to hinge on the low level of the term premium. The capitalisation rate (cap rate), calculated as property income over purchase price, is a common measure of CRE valuations. In October, cap rates were compressed, indicating stretched valuations, with the exception of retail properties, whose prices reflected adverse shifts in shopping patterns in favour of online retail (Graph 7, all panels, left-most bars). Like the earnings yield spread for equities, the cap rate spread over the 10-year US Treasury yields suggested much lower valuations, somewhat below the historical norm (all panels, centre bars). As for equities, however, much of the difference in valuations was due to the low term premium, and cap rate spreads over expected nominal rates were compressed and close to the bottom of the post-GFC range, indicating that the recent decline of the term premium was driving valuations (all panels, right-most bars).
In corporate bond markets, various indicators pointed to higher than average valuations. One simple measure is the corporate yield spread relative to government bonds of similar maturity. In late 2019, AE spreads were lower than they had been 80% of the time since 2010 in the investment grade segment (Graph 8, first panel). Valuations were closer to the average for EME and for AE high-yield corporate bonds, with spreads lower than they had been 70% of the time since 2010.
Furthermore, in recent quarters corporate bond valuations showed signs of diverging from their traditional economic drivers. For example, euro area and US valuations appeared rich in relation to the outlook for manufacturing activity. Corporate bonds are often used to finance working capital and investment, and their valuations had tracked manufacturing PMIs closely since the GFC. In particular, periods of relatively strong prospects for manufacturing (ie high PMIs) corresponded to elevated corporate bond valuations in the form of compressed spreads, with a stronger link for US corporate bond spreads between 2016 and 2018 (Graph 8, second panel).
In early 2019, a gap had started opening between high corporate bond valuations and muted prospects for manufacturing activity. In November, this gap was the largest since 2013, indicating that corporate bond valuations were unusually buoyant relative to weak manufacturing. The divide was evident for investment grade and high-yield bonds in both the euro area and the United States (Graph 8, second and third panels).
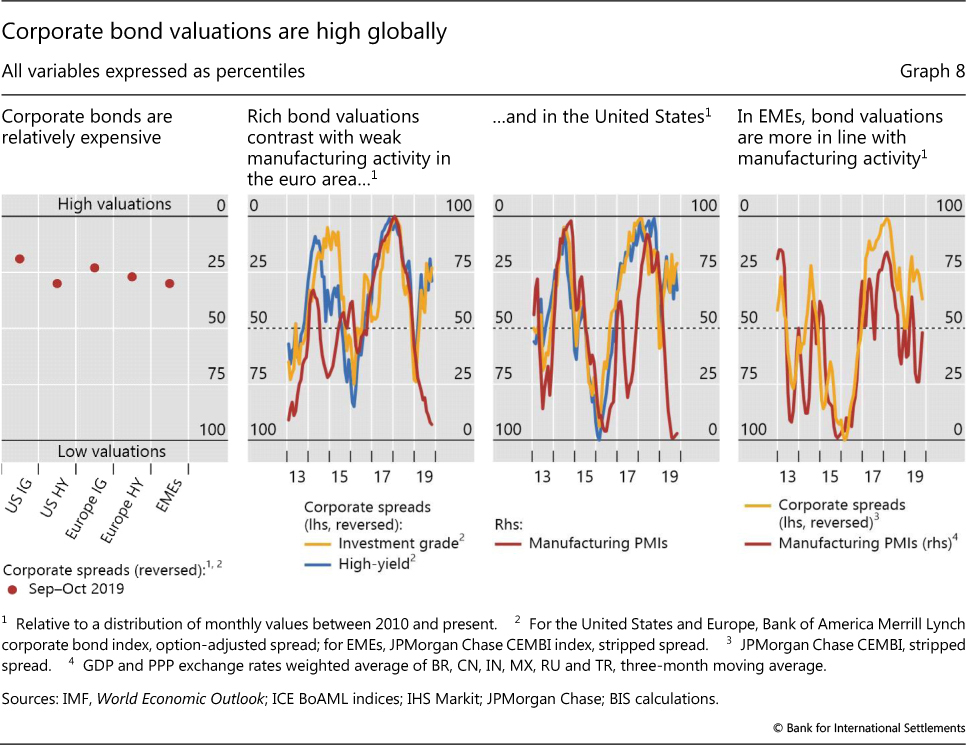
The disconnect between corporate bond valuations and manufacturing activity was less pronounced in EMEs. While bond valuations were above their post-GFC midpoint, manufacturing PMIs were roughly at the middle of their range since 2010, instead of near the bottom as in the United States and euro area (Graph 8, fourth panel). As a result, corporate bond valuations in EMEs appeared more in line with the macroeconomic backdrop.
Corporate bond valuations were not driven by unusually low default risk. Global default rates for speculative grade bonds had been relatively steady for the past several years, picking up in 2016 but settling back in 2018 to levels similar to the 2010-17 average (2.09% compared with 2.35%).6 In September and October, expected default risk and downgrades for US high-yield issuers rose to levels last seen in 2016.7
In a further sign of strong risk appetite, investor demand for higher-risk bonds remained high. The US market for high-yield bonds saw issuance of $34 billion in September, exceeding all monthly totals since January 2018 and well above the $23 billion monthly average between 2010 and 2017. Similarly, in October bond investment funds that focus on countries classified as frontier markets saw the second highest inflow over the previous 12 months. The total assets managed by these funds rose from $3.7 billion in November 2018 to $5.4 billion in October.
September stress in dollar repo markets: passing or structural?
Fernando Avalos, Torsten Ehlers and Egemen Eren
The mid-September tensions in the US dollar market for repurchase agreements (repos) were highly unusual. Repo rates typically fluctuate in an intraday range of 10 basis points, or at most 20 basis points. On 17 September, the secured overnight funding rate (SOFR) - the new, repo market-based, US dollar overnight reference rate - more than doubled, and the intraday range jumped to about 700 basis points. Intraday volatility in the federal funds rate was also unusually high. The reasons for this dislocation have been extensively debated; explanations include a due date for US corporate taxes and a large settlement of US Treasury securities. Yet none of these temporary factors can fully explain the exceptional jump in repo rates.
This box focuses on the distribution of liquid assets in the US banking system and how it became an underlying structural factor that could have amplified the repo rate reaction. US repo markets currently rely heavily on four banks as marginal lenders. As the composition of their liquid assets became more skewed towards US Treasuries, their ability to supply funding at short notice in repo markets was diminished. At the same time, increased demand for funding from leveraged financial institutions (eg hedge funds) via Treasury repos appears to have compounded the strains of the temporary factors. Finally, the stress may have been amplified in part by hysteresis effects brought about by a long period of abundant reserves, owing to the Federal Reserve's large-scale asset purchases.
A repo transaction is a short-term (usually overnight) collateralised loan, in which the borrower (of cash) sells a security (typically government bonds as collateral) to the lender, with a commitment to buy it back later at the same price plus interest. Repo markets redistribute liquidity between financial institutions: not only banks (as is the case with the federal funds market), but also insurance companies, asset managers, money market funds and other institutional investors. In so doing, they help other financial markets to function smoothly. Thus, any sustained disruption in this market, with daily turnover in the US market of about $1 trillion, could quickly ripple through the financial system. The freezing-up of repo markets in late 2008 was one of the most damaging aspects of the Great Financial Crisis (GFC).
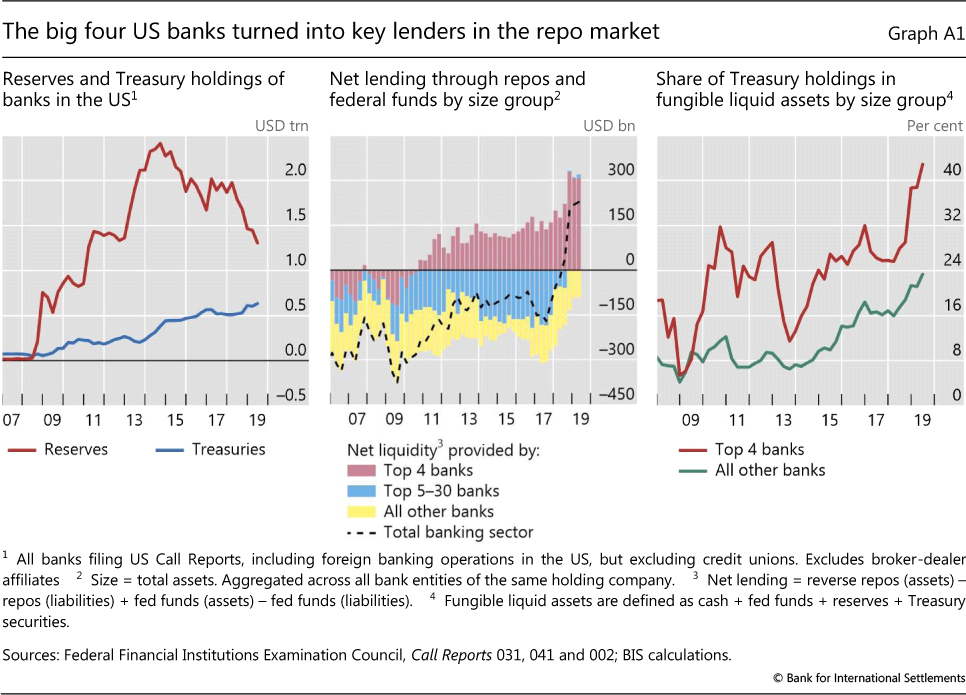
The liquid asset holdings of US banks and their composition have changed significantly since the GFC. Successive rounds of large-scale asset purchases reduced the free float of long-dated US Treasuries available to the market between the end of 2008 and October 2014. On the flip side, banks accumulated large amounts of reserve balances remunerated at the Fed's interest on excess reserves (IOER) (Graph A.1, left-hand panel, red line). After the Federal Reserve started to run down its balance sheet in October 2017, reserves contracted, quickly but in an orderly way as intended. Alongside, banks' holdings of US Treasuries increased, almost trebling between end-2013 and the second quarter of 2019 (blue line).
As repo rates started to increase above the IOER from mid-2018 owing to the large issuance of Treasuries, a remarkable shift took place: the US banking system as a whole, hitherto a net provider of collateral, became a net provider of funds to repo markets. The four largest US banks specifically turned into key players: their net lending position (reverse repo assets minus repo liabilities) increased quickly, reaching about $300 billion at end-June 2019 (Graph A.1, centre panel, red bars). At the same time, the next largest 25 banks reduced their demand for repo funding, turning the net repo position of the banking sector positive (centre panel, dashed line). The big four banks appear to have turned into the marginal lender, possibly as other banks do not have the scale and non-bank cash suppliers such as money market funds (MMFs) hit exposure limits (see below).
Concurrent with the growing role of the largest four banks in the repo market, their liquid asset holdings have become increasingly skewed towards US Treasuries, much more so than for the other, smaller banks (Graph A.1, right-hand panel). As of the second quarter of 2019, the big four banks alone accounted for more than 50% of the total Treasury securities held by banks in the United States - the largest 30 banks held about 90% (Graph A.2, left-hand panel). At the same time, the four largest banks held only about 25% of reserves (ie funding that they could supply at short notice in repo markets).
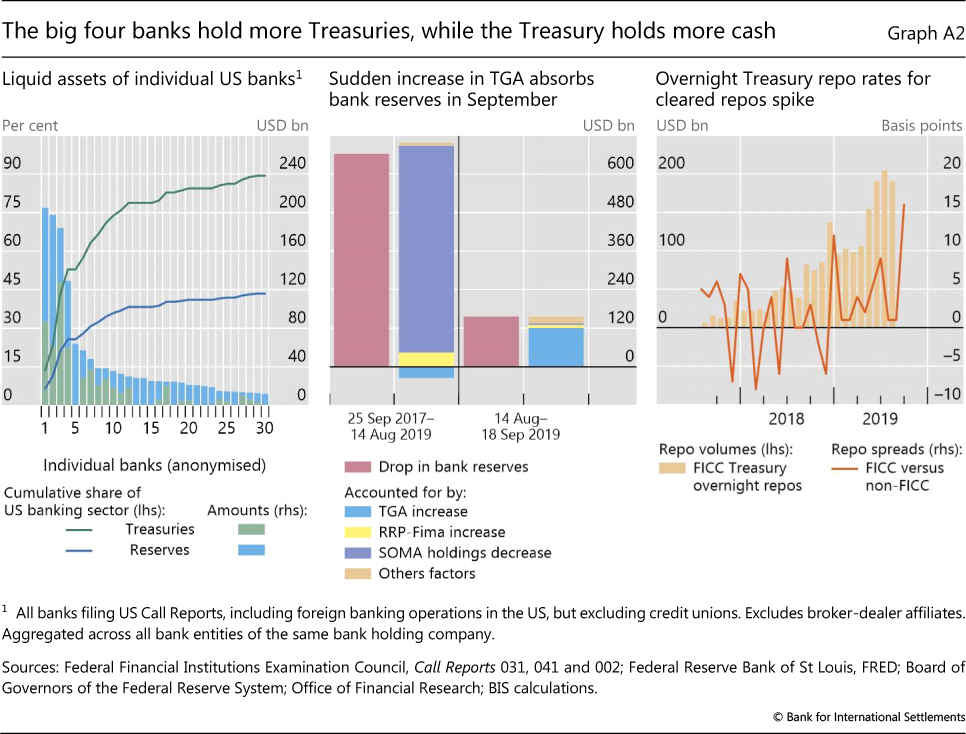
Cash balances held by the US Treasury in its Federal Reserve account (the Treasury General Account, TGA) grew in size and became more volatile, especially after 2015. The resulting drain and swings in reserves are likely to have reduced the cash buffers of the big four banks and their willingness to lend into the repo market. After the debt ceiling was suspended in early August 2019, the US Treasury quickly set out to rebuild its dwindling cash balances, draining more than $120 billion of reserves in the 30 days between 14 August and 17 September alone, and half of this amount in the last week of that period. By comparison, while the Federal Reserve runoff removed about five times this amount, it did so over almost two years (Graph A.2, centre panel).
Besides these shifts in market structure and balance sheet composition, other factors may help to explain why banks did not lend into the repo market, despite attractive profit opportunities. A reduction in money market activity is a natural by-product of central bank balance sheet expansion. If it persists for a prolonged period, it may result in hysteresis effects that hamper market functioning. For instance, the internal processes and knowledge that banks need to ensure prompt and smooth market operations may start to decay. This could take the form of staff inexperience and fewer market-makers, slowing internal processes.
 Moreover, for regulatory requirements - the liquidity coverage ratio - reserves and Treasuries are high-quality liquid assets (HQLA) of equivalent standing. But in practice, especially when managing internal intraday liquidity needs, banks prefer to keep reserves for their superior availability.
Shifts in repo borrowing and lending by non-bank participants may have also played a role in the repo rate spike. Market commentary suggests that, in preceding quarters, leveraged players (eg hedge funds) were increasing their demand for Treasury repos to fund arbitrage trades between cash bonds and derivatives. Since 2017, MMFs have been lending to a broader range of repo counterparties, including hedge funds, potentially obtaining higher returns. These transactions are cleared by the Fixed Income Clearing Corporation (FICC), with a dealer sponsor (usually a bank or broker-dealer) taking on the credit risk. The resulting remarkable rise in FICC-cleared repos indirectly connected these players. During September, however, quantities dropped and rates rose, suggesting a reluctance, also on the part of MMFs, to lend into these markets (Graph A.2, right-hand panel). Market intelligence suggests MMFs were concerned by potential large redemptions given strong prior inflows. Counterparty exposure limits may have contributed to the drop in quantities, as these repos now account for almost 20% of the total provided by MMFs.
Since 17 September, the Federal Reserve has taken various measures to supply more reserves and alleviate repo market pressures. These operations were expanded in scope to term repos (of two to six weeks) and increased in size and time horizon (at least through January 2020). The Federal Reserve further announced on 11 October the purchase of Treasury bills at an initial pace of $60 billion per month to offset the increase in non-reserve liabilities (eg the TGA). These ongoing operations have calmed markets.
On the same day, the effective federal funds rate increased only 5 basis points to 2.30% (above the upper limit of the federal funds target), but the intraday range spiked to almost 200 basis points, from a typical range of less than 10 basis points. J Williams, "Money markets and the federal funds rate: the path forward", speech 332, Federal Reserve Bank of New York, 17 October 2019. Concerns about market functioning due to depressed interbank trading activity in an abundant reserves regime were an important consideration behind Central Bank of Norway's switch to a quota-based system in 2011. Markets Committee, Large central bank balance sheets and market functioning, no 11, October 2019. See I Aldasoro, T Ehlers and E Eren, "Can CCPs reduce repo market inefficiencies?", BIS Quarterly Review, December 2017, pp 13-14. On 18-20 September, it offered overnight repos to primary dealers of up to an aggregate amount of $75 billion against Treasury, agency debt and agency mortgage-backed securities collateral. From 15 November, at least $120 billion in daily overnight repos, in addition to at least $35 billion in two-week term repos, was offered twice a week and at least $15 billion for four- or six-week repos was offered weekly.
1 The period under review extends from 12 September to 27 November 2019.
2 Among other measures, the United States imposed 10% tariffs on $300 billion of Chinese imports and declared China a currency manipulator, while Chinese companies further cut their purchases of US agricultural products, and the government imposed tariffs on $75 billion of US imports and lodged a World Trade Organization tariff case against the United States.
3 See BIS, "Markets swing on trade and monetary policy", BIS Quarterly Review, September 2019, pp 1-14.
4 See the Methodological and Statistical Appendix in International Monetary Fund, Fiscal monitor: How to mitigate climate change, October 2019.
5 For a recent discussion of developments in the term premium, see R Clarida, "Monetary policy, price stability, and equilibrium bond yields: success and consequences", remarks at the High-Level Conference on Global Risk, Uncertainty, and Volatility, Zurich, November 2019. He stresses that, given that the returns on bonds and stocks have become negatively correlated over the last two decades, the explanation for low and even negative term premia could be that bonds have become a hedge for stocks.
6 S&P Global Ratings, 2018 annual global corporate default and rating transition study, 2019.
7 Moody's Analytics, "Worsened fundamentals lift downgrades well above upgrades", 10 October 2019; Moody's Analytics, "Leading credit-risk indicator signals a rising default rate", 5 September 2019.