The global economy: maturing recoveries, turning financial cycles?
Abstract
The global cyclical upswing strengthened considerably during the year under review, with virtually all major economies expanding by early 2017. Consumption was a key factor driving aggregate demand, but business investment also showed signs of a rebound. At the same time, shrinking measures of economic slack suggested that the expansion was maturing. Financial cycles were in the expansion phase in many countries, supporting the economic upswing. In part related to the financial cycle, there are a number of medium-term risks to a sustainable economic expansion. Leading indicators of financial distress signal risks from high private debt and house prices in several economies that were not at the epicentre of the GFC. High household debt might become a drag on demand in some countries, especially if rising interest rates were to boost debt service burdens. Elevated corporate debt, coupled with weak productivity growth, could weigh on investment. And rising protectionist sentiment could hurt economic prospects. Yet the cyclical tailwinds open a window of opportunity to pursue policies that enhance resilience and reduce risks to sustainable growth.
Full text
The global economy's cyclical upswing strengthened considerably during the year under review. By early 2017, virtually all major economies were expanding, and survey data confirmed the favourable short-term outlook. Slack in advanced economies shrank, especially in the labour market, and many emerging market economies (EMEs) benefited from higher commodity prices. Consumption growth was a key driver of demand, but business investment also showed signs of a rebound. Financial cycles were in an expansionary phase in many countries, supporting economic activity. In crisis-hit advanced economies, deleveraging gave way to financial cycle upswings, while in a number of smaller advanced economies and EMEs financial booms moderated or, in some cases, turned into downswings.
Despite the brighter near-term outlook, there are medium-term risks to a sustainable economic expansion. First, leading indicators of financial distress signal risks from high private debt and house prices in several economies that were not at the epicentre of the Great Financial Crisis (GFC). Second, in some countries, high household debt might become a significant drag on demand, especially if rising interest rates boost debt service burdens. Third, persistent weak productivity growth and high corporate debt could weigh on investment. Fourth, the rise in protectionist sentiment could hurt the economic prospects of small open advanced economies and EMEs in particular.
This chapter first provides an overview of global developments in business and financial cycles over the past year. Next, it assesses medium-term risks to the outlook, evaluating aggregate financial cycle risks, the sustainability of consumption and investment growth, and rising protectionist risks. Finally, it highlights the window of opportunity that cyclical tailwinds provide to pursue policies that enhance resilience and sustainable growth.
Macro-financial developments - at inflection points?
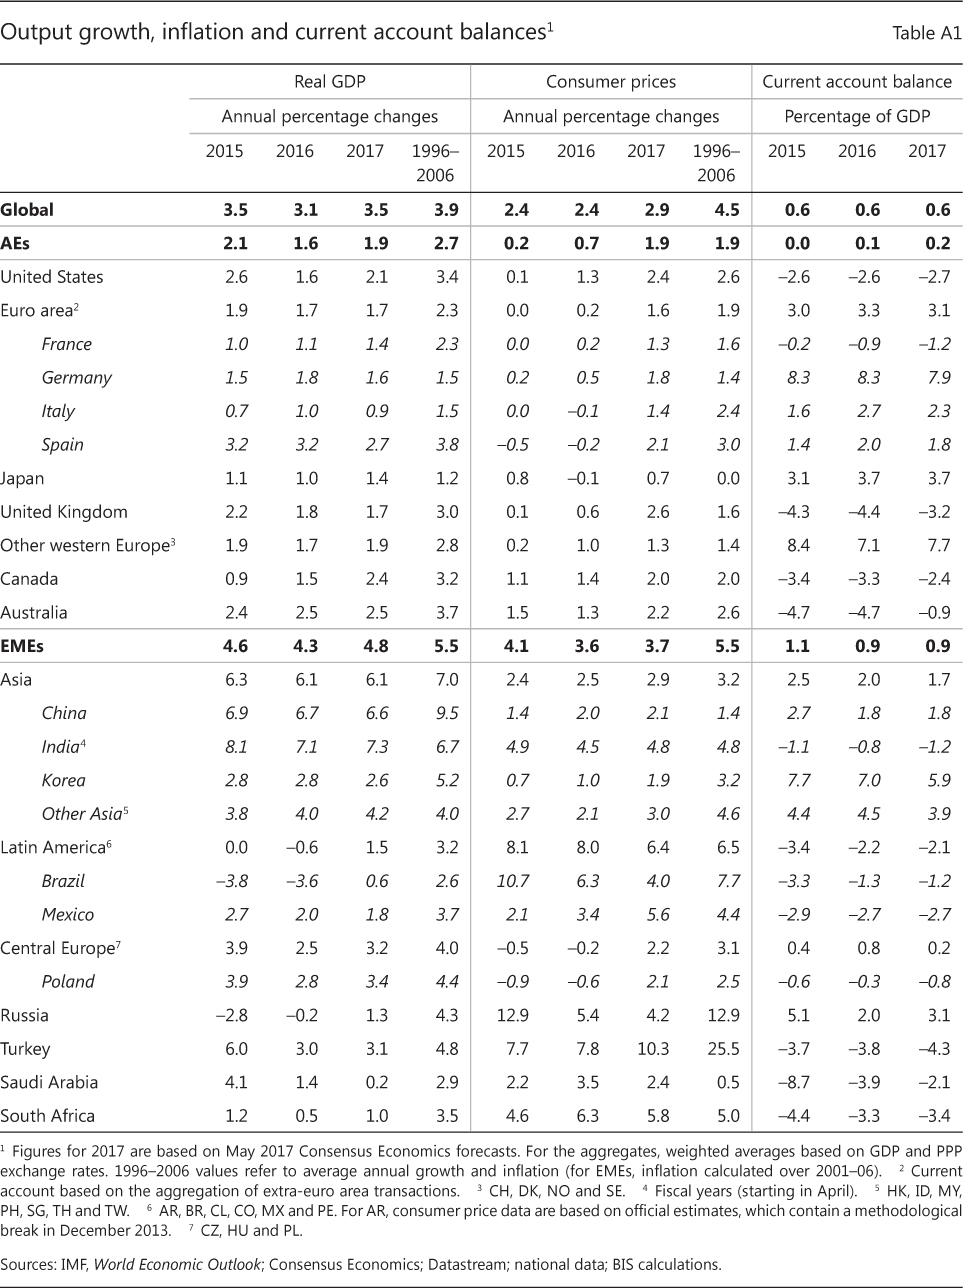
The global economy picked up briskly in the second half of 2016, and by early 2017 virtually all major economies were expanding. While, at 3.1%, global growth was actually slightly lower in 2016 than in 2015, it is expected to rebound to 3.5% in 2017 (Annex Table A1).
Growth in many advanced economies surprised on the upside in the third quarter of 2016 and remained vigorous well into 2017 (Graph III.1, left-hand panel). The US economy grew by 1.6% in 2016, but is forecast to expand by 2.1% in 2017. Euro area GDP increased by 1.7% in 2016, and Japan's by 1.0%. Despite Brexit-related uncertainties, the UK economy rolled ahead by 1.8%. The cyclical upswing continued to push down advanced economies' unemployment rates, in some cases to below pre-crisis levels (centre panel).
The growth momentum in EMEs was somewhat weaker than in advanced economies, but the recovery in energy prices improved the outlook for commodity exporters. China's growth edged up from 6.7% in mid-2016 to 6.9% in the first quarter of 2017, supported by accommodative fiscal policy. India's growth softened in the second half of 2016, to 7.0% in the fourth quarter. Higher oil prices contributed to the growth rebound in oil-exporting countries. Russia's growth turned positive in the last quarter of 2016, while Brazil's downturn seemed to be bottoming out (Annex Table A1).
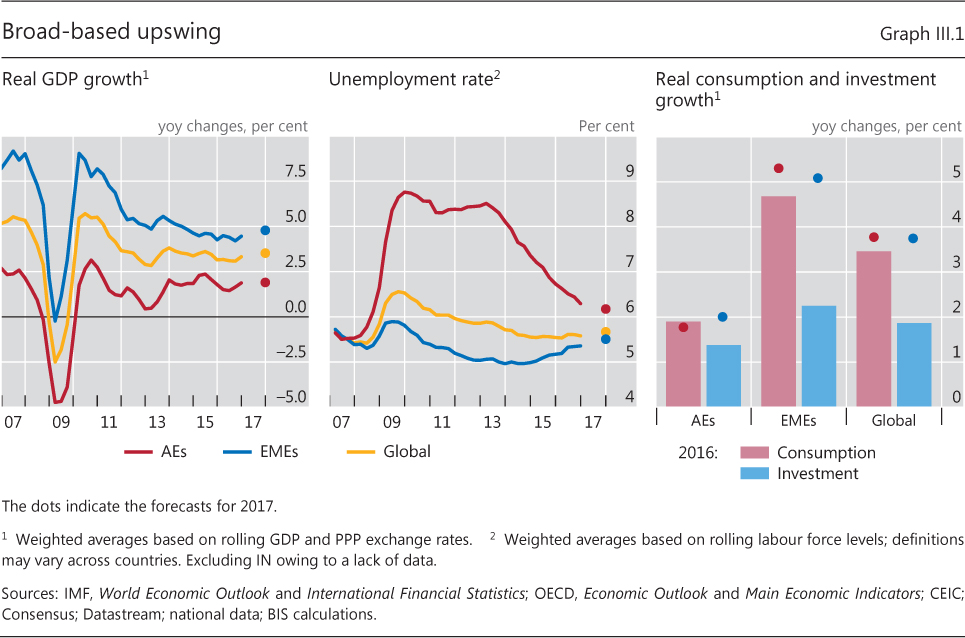
Consumption was the key factor driving demand in both advanced economies and EMEs during 2016. Consumption growth exceeded investment growth by around half a percentage point in advanced economies and by over 2 percentage points in EMEs (Graph III.1, right-hand panel). For 2017, investment is forecast to rebound in both advanced and emerging market economies, alongside continued consumption growth (right-hand panel, dots). In advanced economies, investment growth is forecast to overtake consumption growth, while higher commodity prices should boost capital formation in commodity-exporting countries.
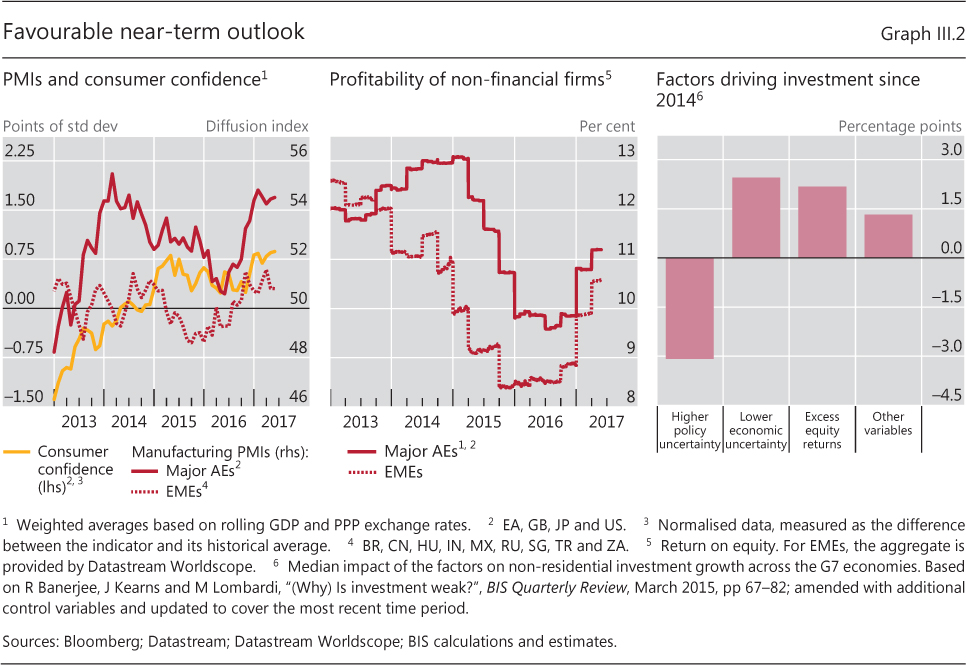
Survey data confirmed the favourable short-term outlook. By early 2017, consumer confidence in advanced economies had risen further above its historical average, supporting the consumption-led expansion (Graph III.2, left-hand panel). Business surveys responded strongly to the favourable macro news in the second half of 2016. In the United States, expectations of corporate tax cuts and deregulation played a role. By early 2017, purchasing managers' indices for manufacturing in the euro area and Japan were at six- and three-year highs, respectively.
Various factors affecting the investment outlook also turned supportive. Non-financial corporations' profitability picked up in both advanced economies and EMEs, reversing the declines of previous years (Graph III.2, centre panel). This is likely to have reinforced the boost from rising equity valuations and reduced demand uncertainty (right-hand panel). However, policy uncertainty increased further (Chapter II), probably exerting a dampening effect on investment (Graph III.2, right-hand panel).
Expectations of shifts in the macroeconomic policy mix also affected the outlook. Policy announcements pointed to fiscal expansion in the United States just as the fiscal policy stance was eased elsewhere. In August, the Japanese government unveiled a fiscal package, including infrastructure spending and transfers. UK authorities abandoned previous plans to close the budget deficit by 2020. In late November, the European Commission recommended a fiscal expansion for the euro area of 0.5% of GDP for 2017. And in mid-December, China's authorities included active fiscal policy among the economic priorities for 2017.
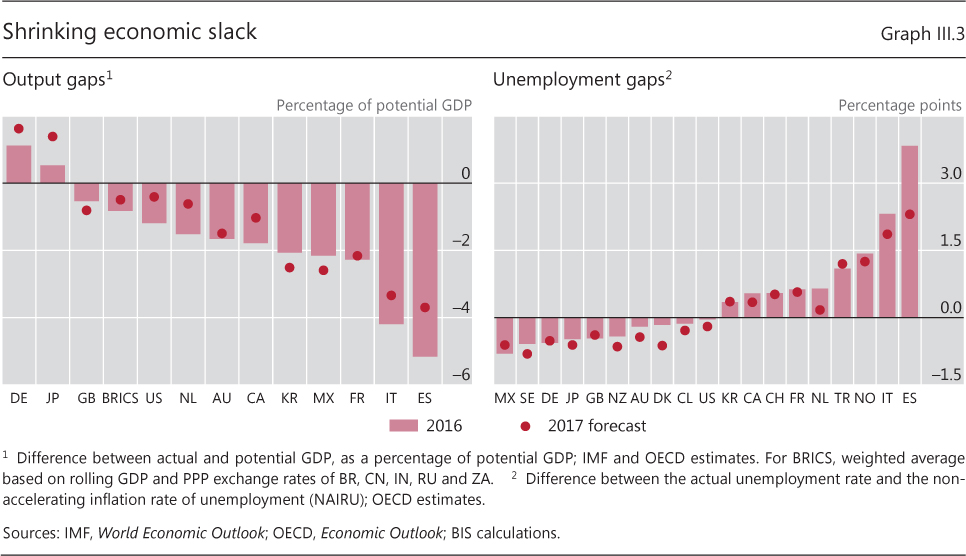
Shrinking measures of economic slack suggested that the expansion was maturing (Graph III.3). To be sure, such estimates should be taken with great caution, not least because they are frequently subject to large revisions. That said, capacity constraints appeared increasingly tight, especially based on labour market indicators, such as the unemployment gap (right-hand panel). By this measure, most major advanced economies had reached full employment by 2016, and a further tightening of labour markets was expected in many countries. However, significant slack seemed to remain in a number of euro area countries, notably Italy and Spain.
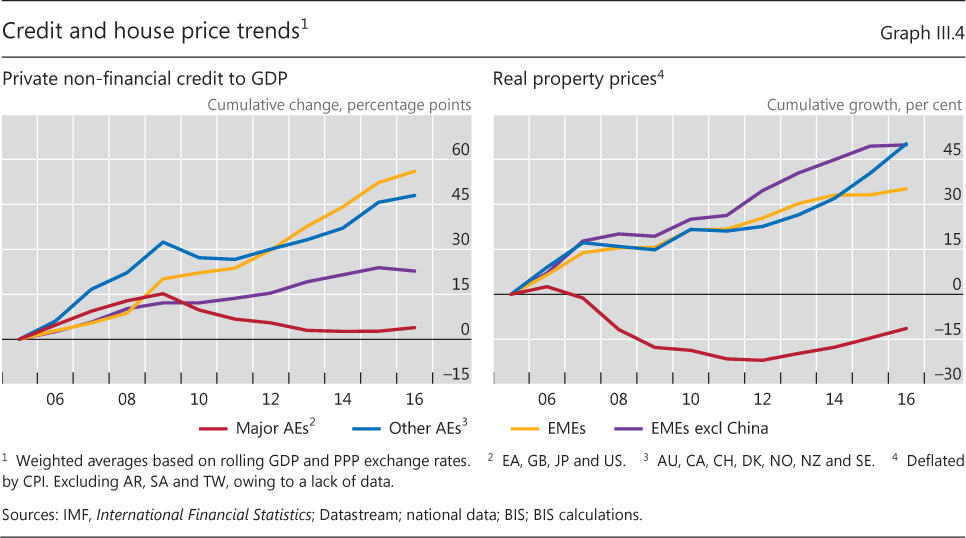
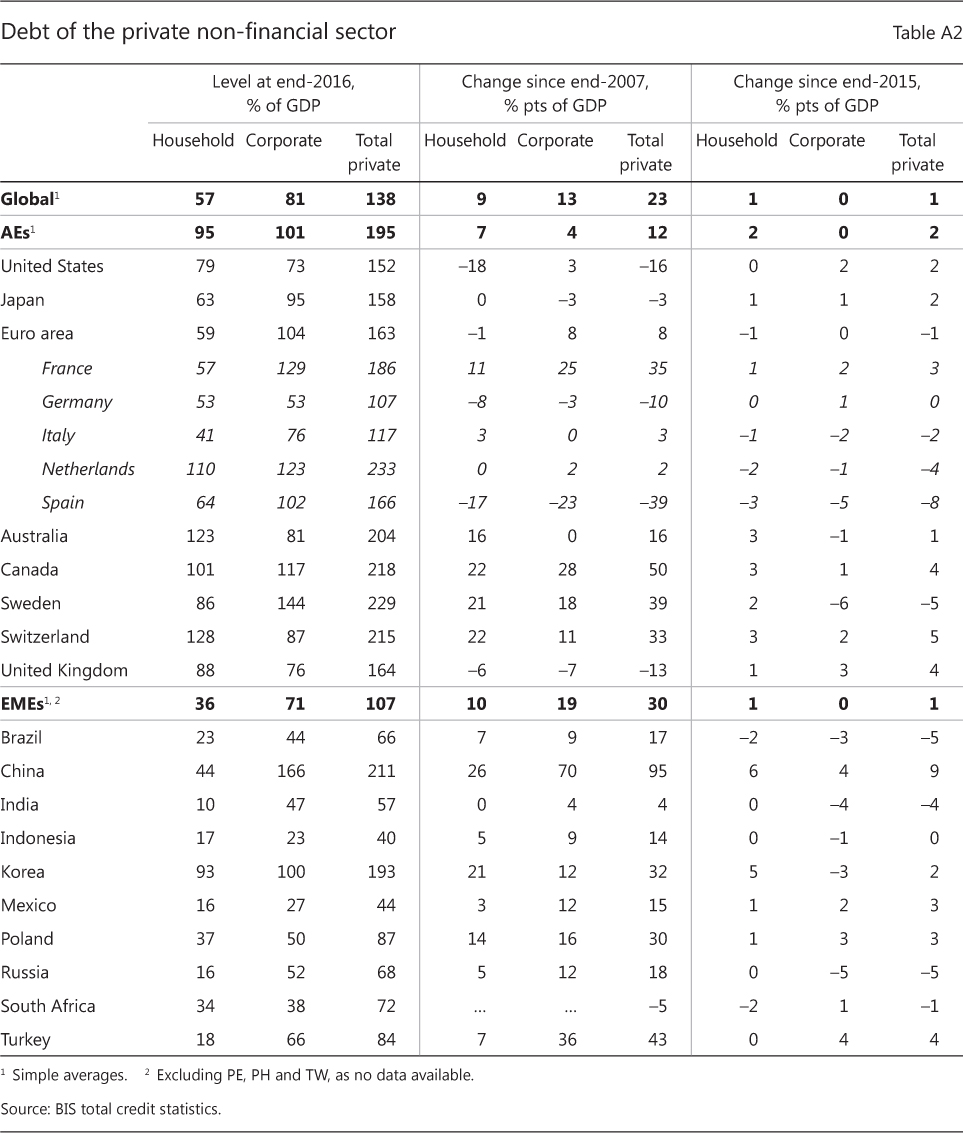
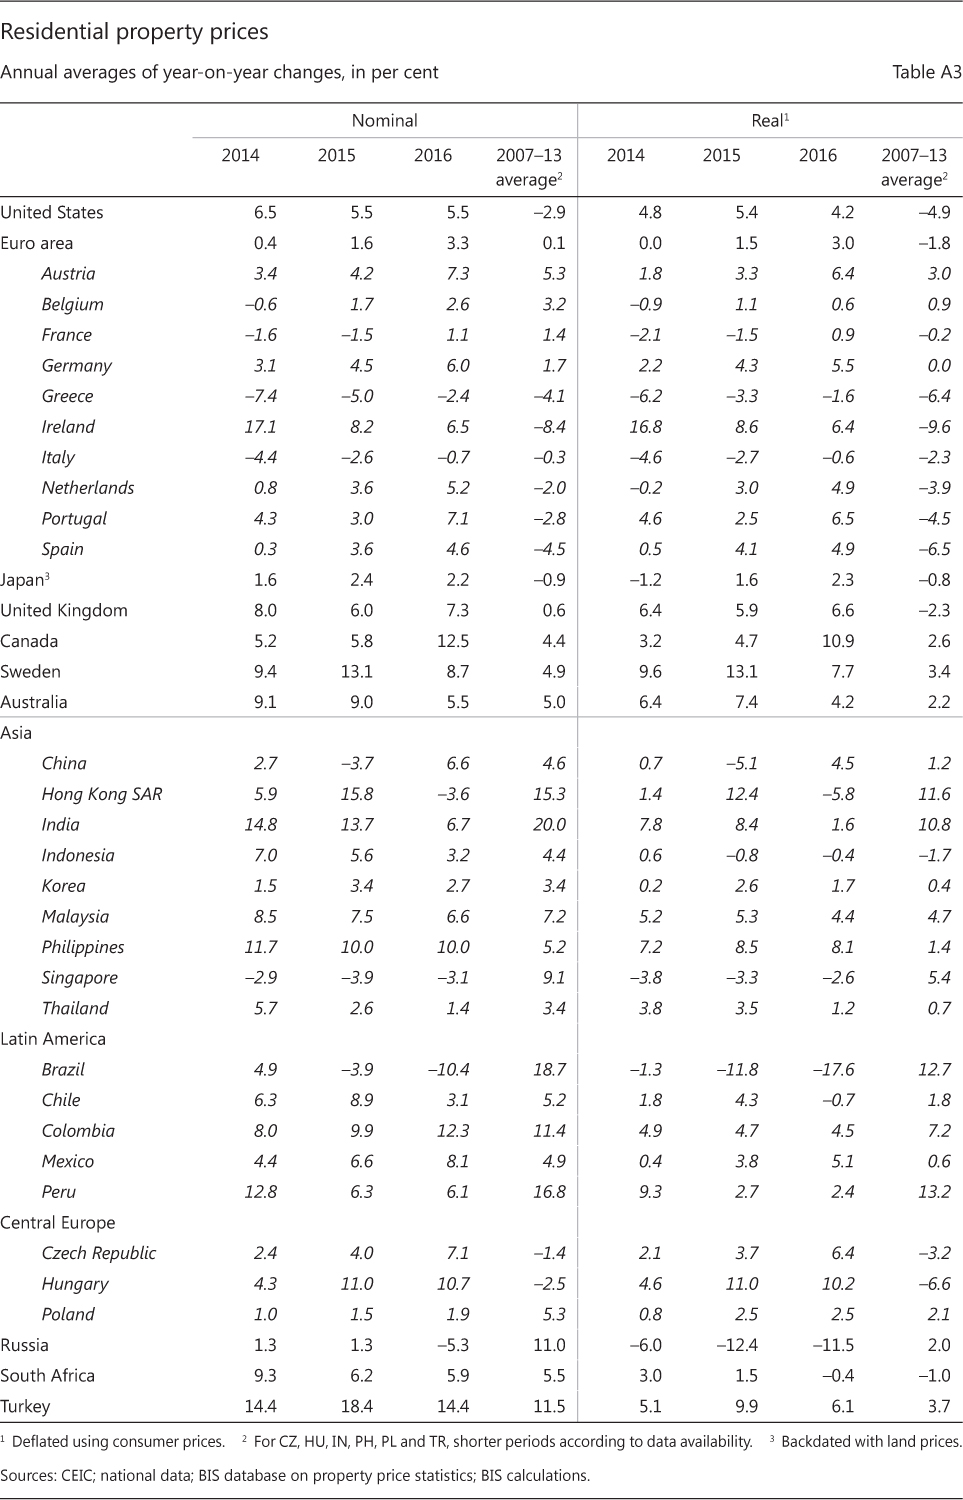
Financial cycles, as represented by credit and property prices, were in the expansionary phase in many countries, supporting the economic upswing (Graph III.4). 1 The major advanced economies at the epicentre of the GFC continued on a moderate financial cycle upswing. After several years of growth in real residential property prices, the ratio of non-financial private credit to GDP edged up modestly in 2016. This reflected a moderate increase in corporate debt ratios, while household debt ratios remained flat, following years of decline (Annex Table A2). Between 2007 and 2016, household debt as a ratio to GDP fell by 18 percentage points in the United States, 6 percentage points in the United Kingdom and 17 percentage points in Spain, providing room for the consumption-led expansion.
In other advanced economies that were less affected by the GFC, financial booms moderated. The growth in the private credit ratio slowed by around 6 percentage points from the previous year, even as property prices continued to rise. The slowdown mainly reflected weaker corporate debt growth, while household debt rose further. In Australia, Canada, Sweden and Switzerland, household debt rose by 2-3 percentage points in 2016, to 86-128% of GDP.
Many EMEs experienced slowing financial booms and some outright downturns in 2016. In aggregate terms, both real house prices and credit relative to output flattened out. Excluding China, EMEs even experienced a small reduction in their credit-to-GDP ratio. This reflected, in particular, downturns in Brazil and Russia, with sustained house price and credit declines (Annex Tables A2 and A3). The corporate debt ratio fell by 3-5 percentage points in Brazil, India, Korea and Russia, but increased further in China. These changes followed rapidly rising corporate debt post-crisis in many EMEs. Between 2007 and 2016, the EME corporate debt ratio rose on average by 19 percentage points, most prominently in China (by 70 percentage points to 166% of GDP). Household debt ratios also rose in some EMEs over the past year, particularly in China and Korea, to 44% and 93% of GDP, respectively.
Risks to the outlook
While the short-term cyclical outlook is increasingly favourable, there are also a number of medium-term risks. This section considers four such risks: (i) financial cycle risks for financial stability; (ii) risks to consumption growth from household debt; (iii) risks to investment from weak productivity growth and high corporate debt; and (iv) risks from rising protectionism.
Financial cycle risks
Financial cycles have been a key determinant of macroeconomic dynamics and financial stability. Peaks in the financial cycle have tended to signal subsequent periods of banking or financial stress. From this perspective, ongoing or prospective financial cycle downturns in some EMEs and smaller advanced economies pose a risk to the outlook.
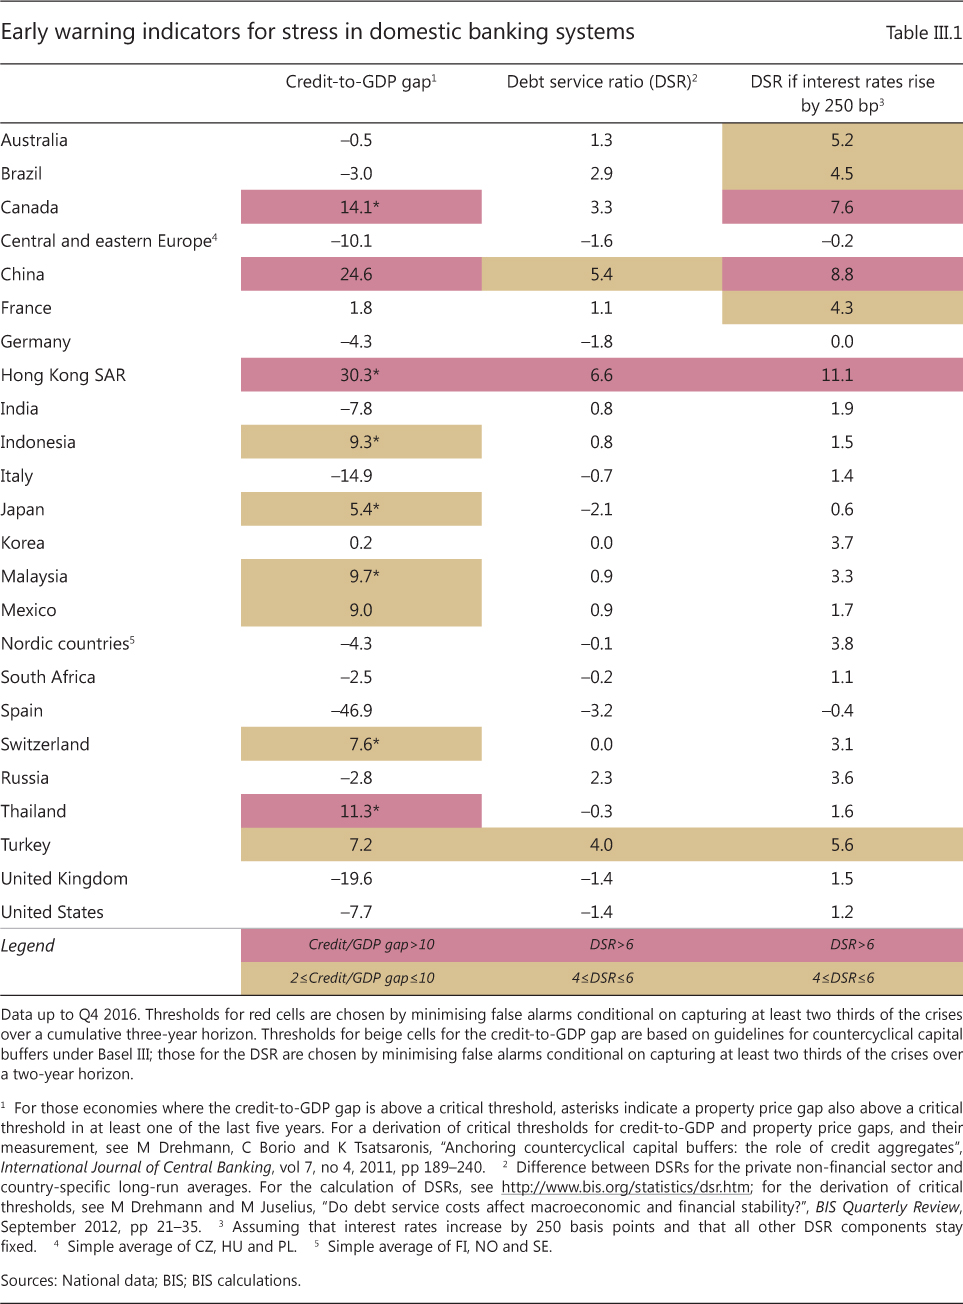
Such risks can be assessed through early warning indicators of financial distress (Table III.1). One such indicator is the credit-to-GDP gap, defined as the deviation of the private non-financial sector credit-to-GDP ratio from its long-term trend. Another is the debt service ratio (DSR), ie the same sector's principal and interest payments in relation to income, measured as deviation from the historical average. These indicators have often successfully captured financial overheating and signalled banking distress over medium-term horizons in the past. Since the late 1970s, the critical thresholds (red cells) were breached at some point in the three years preceding banking distress in more than two thirds of cases, while providing few false alarms. Lower thresholds (beige cells) captured a larger number of banking distress episodes but triggered more false alarms. 2
Credit-to-GDP gaps have reached levels signalling elevated risks in a number of EMEs and smaller advanced economies (Table III.1, first column). In particular, the sizeable credit gaps in several Asian EMEs stand out. In some other EMEs and advanced economies, credit gaps were also large. Moreover, in most cases large credit gaps coincided with sizeable (contemporaneous or recent) property price gaps (asterisks), so that both gap indicators gave a warning signal.
By contrast, DSRs - which can give a better sense of near-term risks over horizons of one year or so - generally remained below levels that would trigger a warning signal. Exceptions were a small number of EMEs where debt service burdens were above their historical norms, even under the assumption of constant interest rates (Table III.1, second column). However, under more stressed conditions - an all-else-equal 250 basis point increase in rates with 100% pass-through - DSRs would rise into risky territory for quite a number of economies (third column).
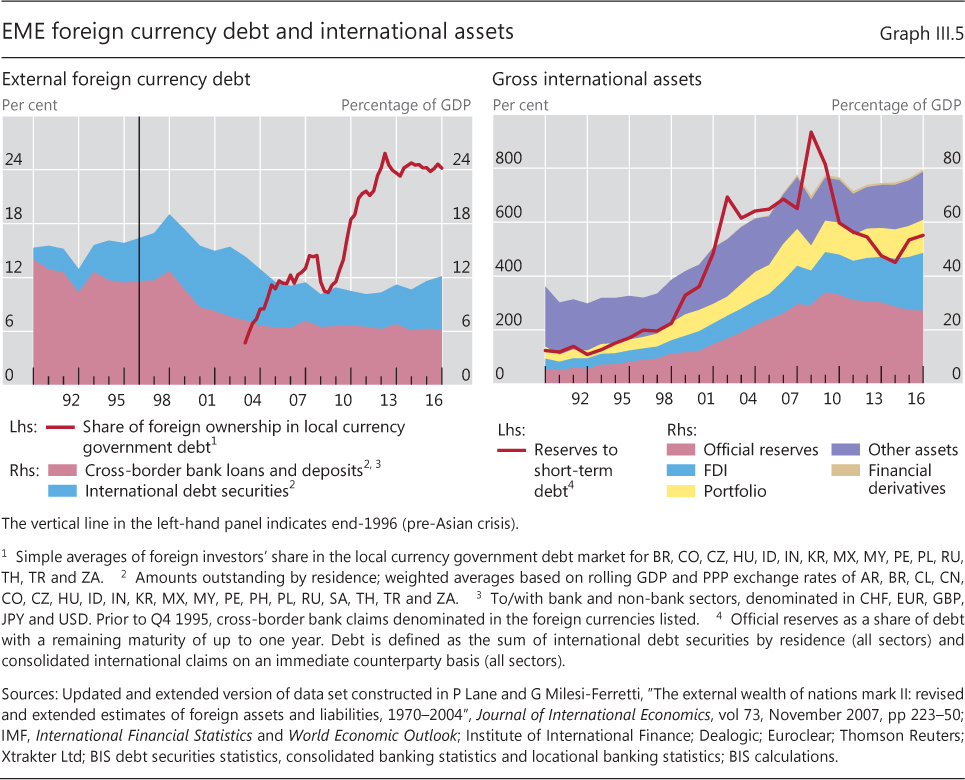
For EMEs with a heavy foreign currency debt burden, the exchange rate can amplify financial cycle risks. A large depreciation against major funding currencies, in particular the US dollar, would inflate debt burdens and could trigger or amplify financial distress. At 12% of GDP, EME external foreign currency debt was on average below levels seen before previous financial crises (Graph III.5, left-hand panel). 3 Thus, in general, vulnerabilities arising from foreign currency debt appeared relatively contained. But at the same time, EMEs have become more integrated into global financial markets, as reflected, for instance, in greater foreign holdings of local currency government debt (left-hand panel). As a result, they continue to be significantly exposed to changes in global investor sentiment.
However, early warning indicators are subject to a number of caveats. On the one hand, they are not comprehensive: they omit other potential sources of financial distress, such as sovereign risk. On the other hand, they need to be interpreted with caution. First, by construction, they balance the risk of issuing false alarms with that of failing to identify future distress: false positives are inevitable. Second, although they can capture the general build-up of financial risks, they cannot identify precisely when the risks will materialise, let alone the intensity of potential strains. Third, their link with financial crisis risks can change over time. Importantly, many countries have developed and implemented macroprudential frameworks to improve financial sector resilience. And, in the wake of the GFC, major steps have been undertaken globally to enhance regulatory and supervisory frameworks more generally (Chapter V).
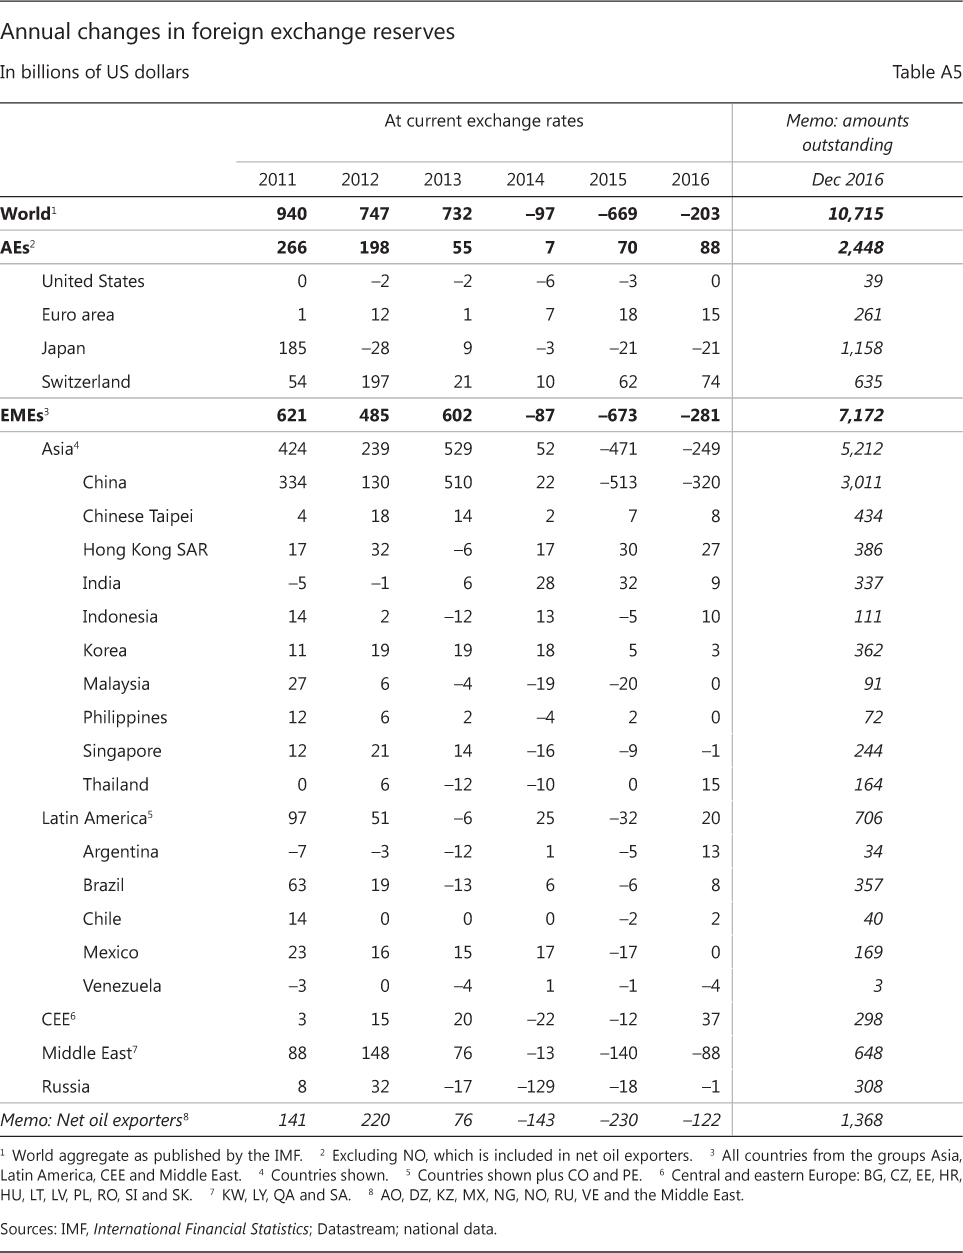
In addition, EMEs have taken steps to reduce their vulnerability to large and abrupt exchange rate depreciations. They have adopted more flexible exchange rate regimes and accumulated large FX reserves (Graph III.5, right-hand panel). As a ratio to GDP, FX reserves have more than tripled since the mid-1990s, reflecting in particular developments in Asian EMEs (Annex Table A5). Moreover, EME private foreign asset holdings have risen, providing an additional potential line of defence.
On balance, the analysis suggests that financial cycle risks are material in a number of economies. Even if, owing to steps to strengthen financial system resilience, outright financial distress did not emerge, financial cycle downturns could weaken demand and growth, not least by dampening consumption and investment.
Box III.A
Excessive household debt and medium-term growth
Excessive indebtedness has been one of the root causes of financial crises and the ensuing deep recessions. In recent years, the focus has been on household debt, as excessive leverage by the household sector was at the heart of the Great Financial Crisis.
It is well recognised that household borrowing is an important aspect of financial inclusion and can play useful economic roles, including smoothing consumption over time. At the same time, rapid household credit growth has featured prominently in financial cycle booms and busts. For one, household debt - or debt more generally - outpacing GDP growth over prolonged periods is a robust early warning indicator of financial stress. Furthermore, there is growing evidence that household indebtedness affects not only the depth of recessions but growth more generally. In an influential paper, Mian et al (forthcoming) find that an increase in the household debt-to-GDP ratio acts as a drag on consumption with a lag of several years.
 BIS research reinforces this conclusion. For instance, based on a panel of 54 advanced and emerging market economies over the period 1990-2015, Lombardi et al (2017) find that rising household indebtedness boosts consumption and GDP growth in the short run, but not in the longer run. Specifically, a 1 percentage point increase in the household debt-to-GDP ratio is associated with growth that is 0.1 percentage point lower in the long run.
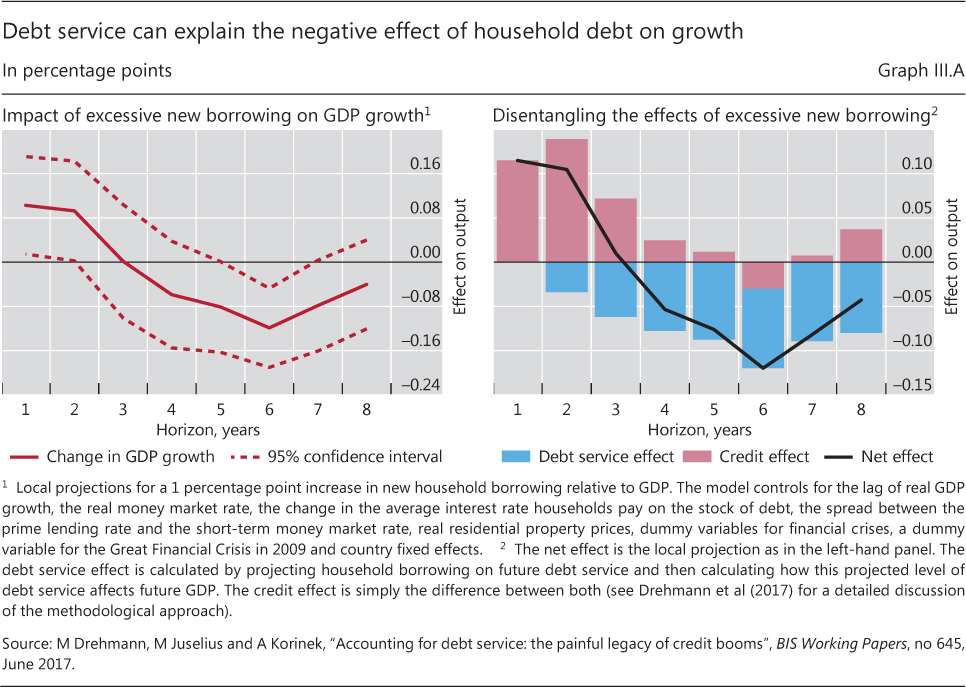
Drehmann et al (2017) shed light on a possible mechanism behind these empirical regularities. When households take on long-term debt, they increase current spending power but commit to a pre-specified path of future debt service (interest payments and amortisations). A simple framework captures this accounting relationship. It highlights two key features. First, if borrowing rises persistently over several years and debt is long-term, as is typically the case, the debt service burden reaches its maximum only after the peak in new borrowing. The lag can be of several years and increase with the maturity of debt and the degree of persistence in borrowing. Second, cash flows from lenders to borrowers reach their maximum before new borrowing peaks. They turn negative before the end of a credit boom, since the positive cash flow from new borrowing is increasingly offset by the negative cash flow from rising debt service.
Empirically, these simple accounting relationships suggest a transmission channel whereby excessive credit expansions lead to future output losses. In particular, using a panel of 17 mainly advanced economies from 1980 to 2016, Drehmann et al (2017) show that an increase in new debt relative to GDP beyond historical norms provides on average a boost to GDP growth in the short run but depresses output growth in the medium term (Graph III.A, left-hand panel and black line in the right-hand panel). As the accounting framework suggests, the increase in new debt feeds into higher debt service burdens. As higher debt service burdens have a strong negative effect on output going forward, this channel explains almost fully the medium-term growth decline (blue bars, right-hand panel). However, the negative effects of high credit growth in the medium term are not unconditional. If households initially have low debt service burdens, additional borrowing continues to be beneficial in the short run without significant adverse effects later on. This suggests, for instance, that there can be room for benign financial deepening in countries where households are not yet constrained.
The adverse effects of excessive credit growth can also be magnified by the economy's supply side response. For example, banks' stronger willingness to extend mortgages may feed an unsustainable housing boom and overinvestment in the construction sector, which may crowd out investment opportunities in higher-productivity sectors. Borio et al (2016), for example, report evidence that credit booms tend to go hand in hand with a misallocation of resources - most notably towards the construction sector - and a slowdown in productivity growth, with long-lasting adverse effects on the real economy.
See eg C Borio and P Lowe, "Assessing the risk of banking crises", BIS Quarterly Review, December 2002, pp 43-54; or M Schularick and A Taylor, "Credit booms gone bust: monetary policy, leverage cycles, and financial crises, 1870-2008", American Economic Review, vol 102, no 2, April 2012, pp 1029-61. See A Mian, A Sufi and E Verner, "Household debt and business cycles worldwide", Quarterly Journal of Economics, forthcoming. See M Lombardi, M Mohanty and I Shim, "The real effects of household debt in the short and long run", BIS Working Papers, no 607, January 2017. See M Drehmann, M Juselius and A Korinek, "Accounting for debt service: the painful legacy of credit booms", BIS Working Papers, no 645, June 2017. See C Borio, E Kharroubi, C Upper and F Zampolli, "Labour reallocation and productivity dynamics: financial causes, real consequences", BIS Working Papers, no 534, January 2016.
Risks to consumption
Private consumption has been a key contributor to global demand in the past few years. However, the main factors that supported consumption growth could weaken going forward. Given the evidence of diminishing labour market slack, employment dynamics could turn less supportive. Rising wages might partly compensate for slower employment growth, but the associated upward pressure on inflation could lead to tighter monetary policy. At the same time, the consumption boost from buoyant household credit and asset prices could weaken, especially in countries with indications of turning financial cycles.
Additional risks to consumption arise from elevated levels of household debt, in particular given the prospect of higher interest rates. Recent evidence from a sample of advanced economies suggests that increasing household debt in relation to GDP has boosted consumption in the short term, but this has tended to be followed by sub-par medium-term macroeconomic performance (Box III.A). The main channel appears to be the weight of debt service burdens, which increases alongside the accumulation of debt and higher interest rates.
It is possible to assess the effect of higher interest rates on debt service burdens through illustrative simulations. These capture the dynamic relationships between the two components of the DSR (the credit-to-income ratio and the nominal interest rate on debt), real residential property prices, real GDP and the three-month money market interest rate (Graph III.6). Crisis-hit countries, where households have deleveraged post-crisis, appear relatively resilient to rising interest rates. In most cases considered, debt service burdens remain close to long-run averages even in a scenario in which short-term interest rates increase rapidly to end-2007 levels. By contrast, in countries that experienced rapid rises in household debt over recent years, DSRs are already above their historical average and would be pushed up further by higher interest rates. This could act as a significant drag on consumption and output (Box III.A). 4
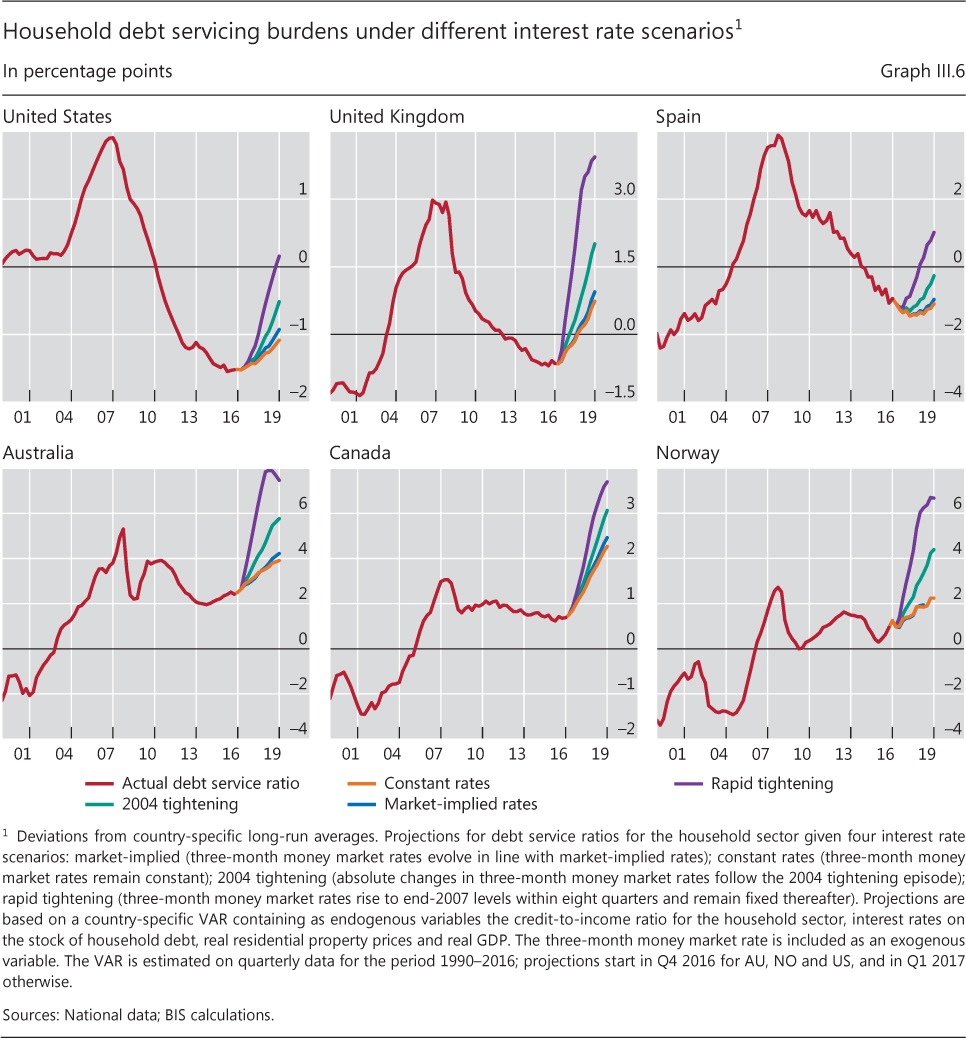
To be sure, as the simulations embed the historical interactions since 1990 in reduced form, they provide only an initial gauge of the underlying dynamics. For instance, a long period of unconventional monetary policy could have altered the interactions between the variables. Moreover, the rapid tightening scenario is probably not very likely and might trigger macroeconomic dynamics different from those captured by historical relationships. That said, the results point to headwinds in some economies were interest rates to rise significantly.
Risks to investment
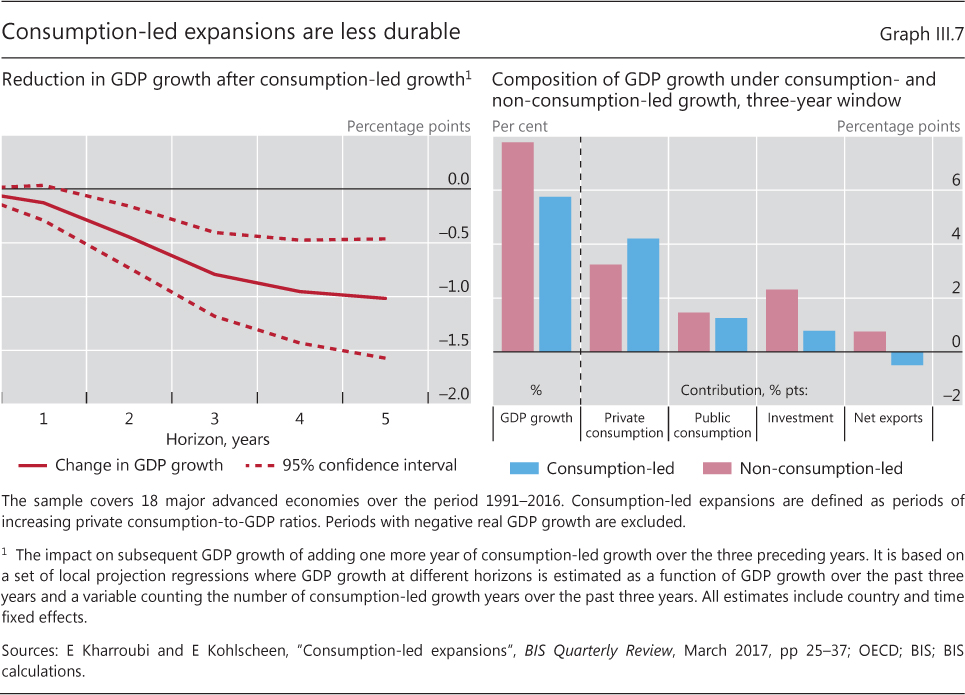
A rotation from consumption- to investment-led growth would support the medium-term sustainability of the current upswing. A higher stock of productive capital enhances growth potential and alleviates capacity constraints, helping to prevent a build-up of inflationary pressures. Indeed, consumption-led expansions - defined as private consumption growing more rapidly than output - appear to be less durable than those driven by other components of demand. Evidence for advanced economies indicates that consumption-led growth heralds below-average output growth down the road (Graph III.7, left-hand panel). One potential factor is excessive accumulation of household debt, as discussed above. 5 Another is weak investment activity and thus a slow accumulation of productive capacity (right-hand panel).
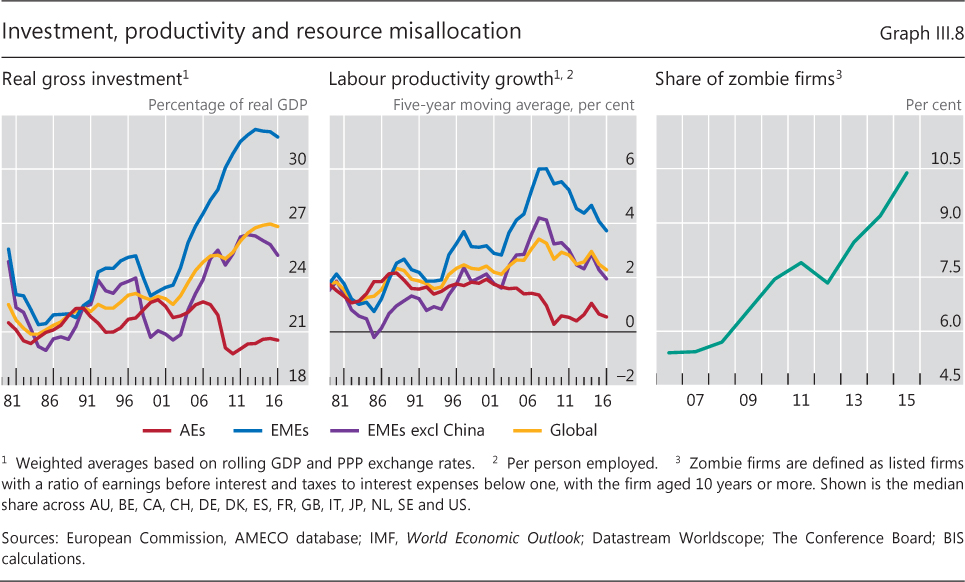
Recent signs of an investment rebound have followed protracted weakness post-crisis in the advanced economies and a slowdown of investment growth in the EMEs more recently. In advanced economies, the ratio of real investment to real GDP, which accounts for changes in the relative price of investment goods, fell by around 3 percentage points to just below 20% in the immediate aftermath of the crisis (Graph III.8, left-hand panel). This drop reflected in part the correction observed in residential investment after the pre-crisis boom, but also a decline of the non-residential component. In EMEs, investment ratios rose throughout the crisis, driven in particular by strong expansion in China, but started to level off after 2013. Several factors were at work, including adverse terms-of-trade changes for commodity exporters, a slowdown in FDI flows to non-commodity exporters and an investment slowdown in China. 6
Weaker investment in recent years has coincided with a slowdown in productivity growth. Since 2007, productivity growth has slowed in both advanced economies and EMEs (Graph III.8, centre panel). One potential factor behind this decline is a persistent misallocation of capital and labour, as reflected by the growing share of unprofitable firms. Indeed, the share of zombie firms - whose interest expenses exceed earnings before interest and taxes - has increased significantly despite unusually low levels of interest rates (right-hand panel). 7 Another factor holding back productivity appears to be a stagnant diffusion of new technology. 8 At the same time, low investment and weak productivity growth are likely to reinforce each other: investment can raise productivity through capital deepening and embedded technological progress, while higher productivity can boost the returns on investment. Persistent weak productivity growth could therefore cloud the medium-term investment outlook.
Looking ahead, several other factors could weigh on investment. One, as already noted, is policy uncertainty, should it persist. Another is demographic change. Slower population growth should weaken aggregate demand, although it could also reinforce the need for labour-saving capital investment to compensate for a shrinking labour force. A third factor is high corporate debt.
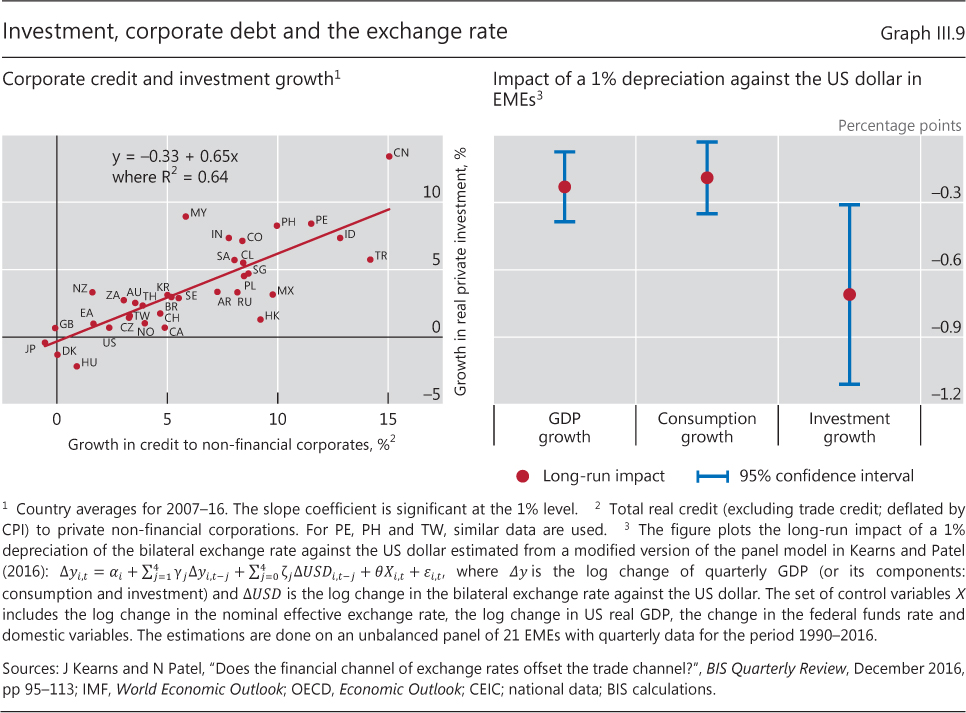
Over the past 10 years, there has been a close positive correlation between the growth of corporate credit and investment (Graph III.9, left-hand panel). A build-up of corporate debt has financed investment in many economies, particularly in EMEs, including high investment rates in China. Turning financial cycles in these economies could therefore weigh on investment.
As with consumption, the level of debt can affect investment. Rising interest rates would push up debt service burdens in countries with high corporate debt. Moreover, in EMEs with large shares of such debt in foreign currency, domestic currency depreciation could hurt investment. As mentioned before, an appreciation of funding currencies, mainly the US dollar, increases debt burdens where currency mismatches are present and tightens financial conditions (the exchange rate risk-taking channel). 9 Empirical evidence suggests that a depreciation of EME currencies against the US dollar dampens investment significantly (Graph III.9, right-hand panel), offsetting to a large extent the positive impact of higher net exports. 10
Box III.B
How sensitive are US production costs to tariffs on imports from China and Mexico?
Barriers to trade can reduce the competitiveness of domestic industries as internationally sourced inputs become more expensive and firms cannot substitute away easily. Moreover, in the global network of input-output trade, tariffs targeted at specific trade partners also inevitably affect other economies that supply inputs to them.
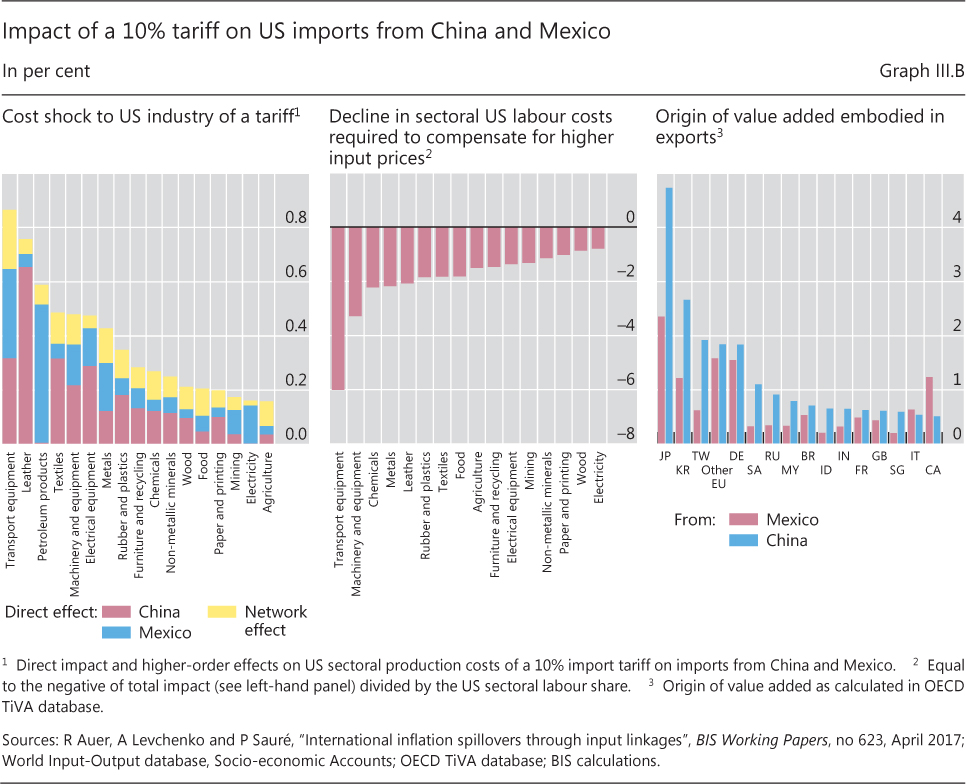
It is possible to illustrate the propagation of protectionist measures via global value chains (Graph III.B, left-hand panel). The hypothetical example is a shock to US sectoral production costs resulting from a hypothetical tariff of 10% on imports originating from China and Mexico.
Both direct and indirect effects are at play. The direct effects result from bilateral links (Graph III.B, red and blue bars in the left-hand panel). If, say, 10% of the cost of a given industry were due to inputs sourced from Mexico, a 10% import duty would increase total production costs by 1%. The indirect effects capture the impact on the rest of the production network, as US sectors source from each other and the rest of the world (yellow bars). For example, if a tariff increases the cost of oil imports from Mexico, US production costs of goods, such as chemicals or plastics that use oil as an input, increase. And the tariff would also have higher-round effects via subsequent nodes of the production chain, as chemicals and plastics are, in turn, used as inputs into production.
Overall, this simulation reveals a comparatively large sensitivity of US production costs to tariffs on imports from Mexico or China. To put the resulting cost shocks in context, the centre panel of Graph III.B displays the reduction in US wages that would be required to fully compensate for the increasing costs of imported inputs. For example, such tariffs would lead to a 0.86% cost increase in the US transportation industry. To fully offset this increase, US labour costs would have to decrease by around 6%, satisfying 0.86% - 6% * 0.14 ≈ 0, where 0.14 is the labour cost share in the US transportation equipment industry.
Third countries would also be affected. Mexico and China are important entry points for intermediate goods, which are further processed and then shipped to the United States. The right-hand panel of Graph III.B shows the share of foreign value added that is embodied in exports from Mexico (red bars) and China (blue bars) by origin. For example, intermediate goods and services sourced from Japan account for 2.4% of the value of Mexican exports and for 4.7% of the value of Chinese exports. If exports from China and Mexico decrease by $1 billion, demand for Japanese inputs decreases by $47 million and $24 million, respectively.
Risks from rising protectionism
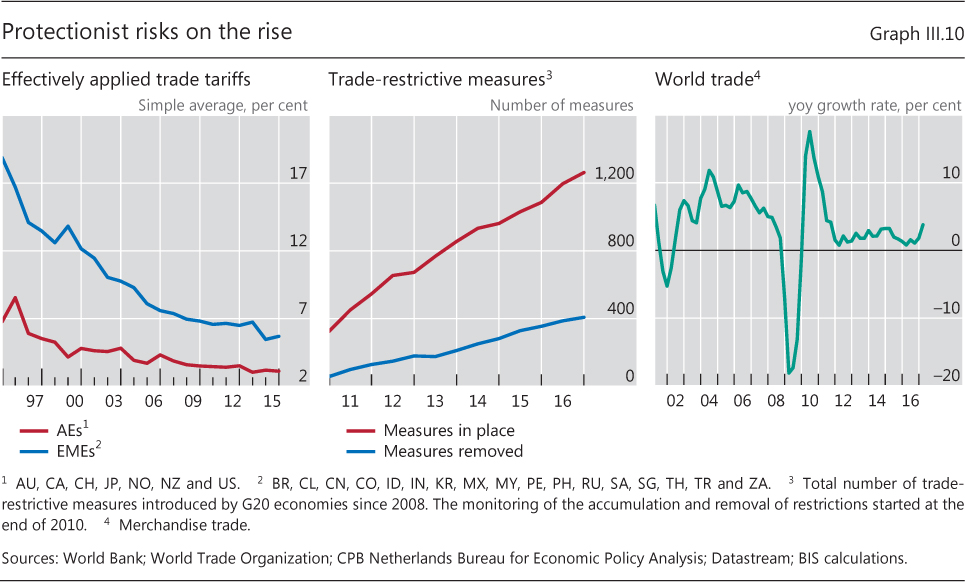
A broader risk for the current expansion is protectionism. The reduction in overall trade tariffs has slowed over the past decade (Graph III.10, left-hand panel). Moreover, trade-restrictive measures, such as regulations and targeted tariff hikes, have risen substantially since end-2010 (centre panel). And a greater emphasis on measures that would hinder free trade in national policy agendas suggests that the risk of protectionism may be growing further.
A rise in protectionism would add to the cyclical and structural factors that have held back global trade post-crisis (Graph III.10, right-hand panel and Chapter VI). These have included: aggregate demand weakness, especially in trade-intensive business investment; income-driven demand shifts, notably from manufacturing goods to less traded services; and the maturing of the Chinese economy, which has boosted domestically produced intermediate inputs at the expense of imported ones.
Protectionism could hurt growth and welfare through various channels (Chapter VI). One is slower productivity growth due to reduced competition and a more constrained international division of labour. Another is weaker competitiveness of domestic industries: internationally sourced inputs would become more expensive and would not be easily substituted with domestic ones. And global value chains (GVCs) represent a potentially powerful amplification mechanism. Costs from trade barriers would propagate both nationally and internationally through production chains (Box III.B).
Rising protectionism could also exacerbate the risks to the medium-term outlook discussed earlier. To the extent that it reduced profits and incomes, it would weaken corporate and household balance sheets, sap debt servicing capacity and heighten financial cycle risks. The balance sheet effects, in turn, could be a drag on global demand, amplified by policy and economic uncertainty. Protectionism could hit import-intensive business investment and FDI particularly hard, further retarding technological diffusion. Such effects are also relevant for economies where a high degree of competitiveness has fostered rapid export growth and rising incomes in the recent past.
Cyclical tailwinds open a window of opportunity
The favourable short-term outlook presents a valuable opportunity to pursue policies conducive to sustainable long-term growth. The general goal of such policies would be to lift the economy's growth path and counter the trend towards weaker productivity growth. One precondition for achieving this goal is strengthening the economy's resilience, including its capacity to cope with shocks, to contain the build-up of financial cycle risks and other financial imbalances, and to adapt to structural changes in the global economy.
A policy mix rebalancing towards structural policies would help revive productivity and sustain the investment recovery. Indeed, the pace of labour productivity-enhancing reforms appears to have slowed notably during 2015-16. 11 This contrasts with somewhat better progress in reforms aimed at boosting labour utilisation, as reflected in the favourable employment performance during the recent upturn.
One relevant set of structural policies includes measures to increase business dynamism. More efficient bankruptcy procedures can reduce the strain on resources and productivity caused by unviable enterprises. And removing administrative red tape can encourage the entry of productive firms.
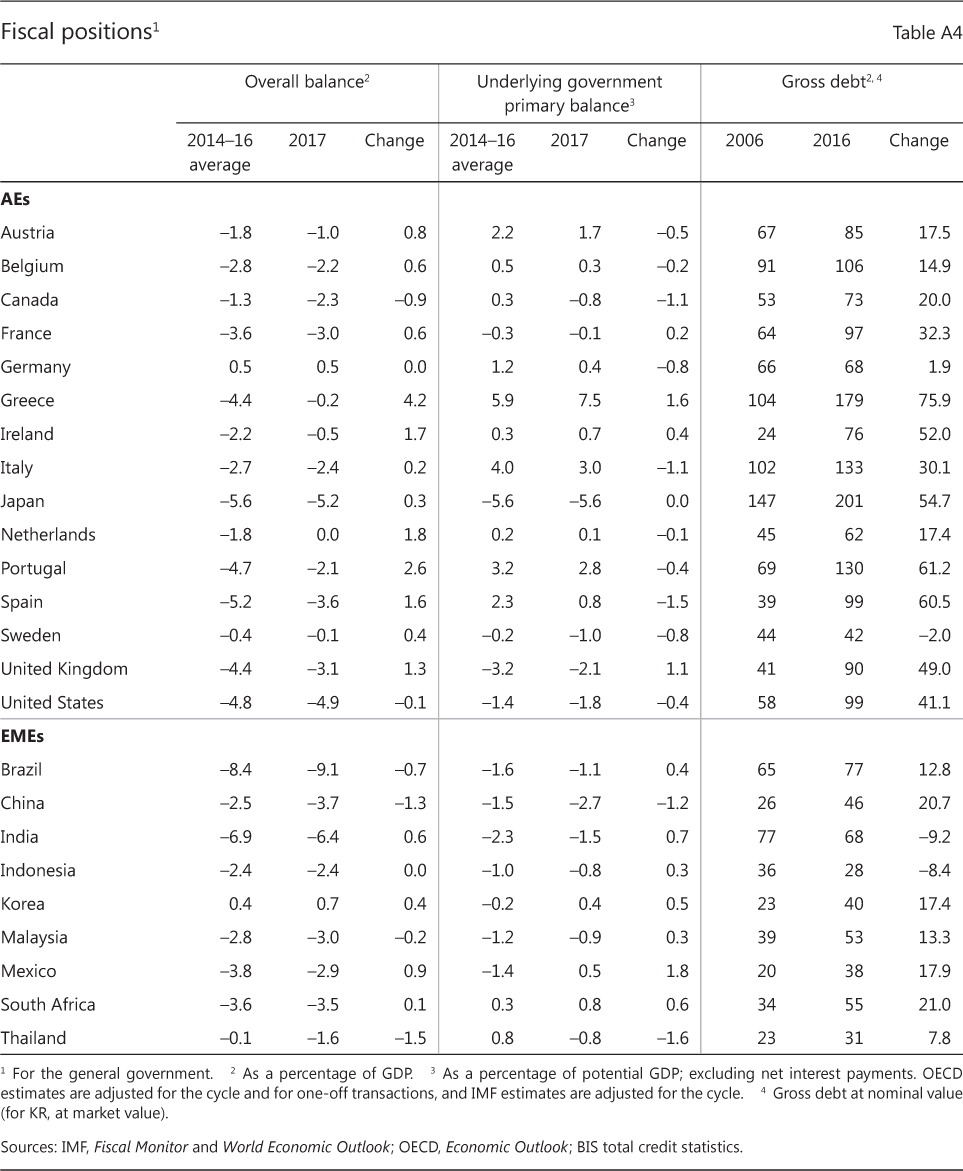
Fiscal policy can also play an important role. It can generally support structural adjustment, notably measures to increase the labour and product markets' ability to reallocate resources. Moreover, the composition of fiscal expenditures could be adjusted to favour investment in both human (eg education) and physical (eg infrastructure) capital. And tax systems could be streamlined and made more growth-friendly and resilience-enhancing. One example is shifting from direct to consumption-based taxation. Another is reducing the widespread debt bias in tax codes. In evaluating such policies, it is important to recognise that in many countries the fiscal room for manoeuvre is rather limited due to high debt burdens (Annex Table A4), pointing to the need for long-term fiscal consolidation. 12 Moreover, interest rate normalisation could further reduce fiscal space. This suggests that changes in the composition of expenditures and taxes are superior to deficit- boosting measures, especially in countries where economic slack is limited.
Endnotes
1 Financial cycles are best measured by the co-movement of a broad set of financial variables. But the most parsimonious representation is in terms of credit and property prices, with the latter typically leading the former around financial cycle turning points. See Chapter IV in the 84th Annual Report for further elaboration.
2 See M Drehmann, C Borio and K Tsatsaronis, "Anchoring countercyclical capital buffers: the role of credit aggregates", International Journal of Central Banking, vol 7, no 4, 2011, pp 189-240; and M Drehmann and M Juselius, "Do debt service costs affect macroeconomic and financial stability?", BIS Quarterly Review, September 2012, pp 21-35.
3 The median level of FX debt to GDP prior to financial crises in major EMEs since the 1990s was about 21%, with an interquartile range of 14-26%.
4 The long-run average is used as a benchmark here because DSRs are stationary, or mean-reverting. See M Juselius and M Drehmann, "Leverage dynamics and the real burden of debt", BIS Working Papers, no 501, May 2015.
5 See also A Mian, A Sufi and E Verner, "Household debt and business cycles worldwide", Quarterly Journal of Economics, forthcoming.
6 For a detailed analysis of the investment slowdown in EMEs and its implications, see World Bank, "Weak investment in uncertain times", Global Economic Prospects, January 2017.
7 See also M Adalet McGowan, D Andrews and V Millot, "The walking dead? Zombie firms and productivity performance in OECD countries", OECD Economics Department Working Papers, no 1372, January 2017. For more evidence on the effect of post-crisis resource misallocation on productivity growth, see C Borio, E Kharroubi, C Upper and F Zampolli, "Labour reallocation and productivity dynamics: financial causes, real consequences", BIS Working Papers, no 534, January 2016; and G Adler, R Duval, D Furceri, S Kiliç Çelik, K Koloskova and M Poplawski-Ribeiro, "Gone with the headwinds: global productivity", IMF Staff Discussion Note, no 17/04, April 2017.
8 For evidence relating to stagnant technology diffusion, see D Andrews, C Criscuolo and P Gal, "Frontier firms, technology diffusion and public policy: micro evidence from OECD countries", OECD Productivity Working Papers, no 2, November 2015.
9 For an overview of the mechanisms operating through banking flows and capital market financing, respectively, see V Bruno and H S Shin, "Global dollar credit and carry trades: a firm level analysis", BIS Working Papers, no 510, August 2015; and B Hofmann, I Shim and H S Shin, "Sovereign yields and the risk-taking channel of currency appreciation", BIS Working Papers, no 538, January 2016, revised May 2017.
10 For a more detailed analysis of the impact of currency movements on economic activity, see J Kearns and N Patel, "Does the financial channel of exchange rates offset the trade channel?", BIS Quarterly Review, December 2016, pp 95-113.
11 See OECD, Economic policy reforms 2017: going for growth, March 2017.
12 See BIS, 86th Annual Report, June 2016, pp 96-8.