The financial sector: time to move on
Abstract
The Basel III framework is nearing completion. In addition to finalising the remaining calibration decisions, consistent and thorough implementation is now key, alongside more rigorous supervision. With regulatory uncertainty receding, banks need to keep adjusting their business models to the new market environment. This includes addressing legacy problems, such as those related to non-performing loans - an adjustment that will have to take place in challenging macroeconomic conditions linked to low, or even negative, interest rates. Once financial sector repair is completed, safer and stronger banks will unambiguously contribute to a more resilient economy. At the same time, as risks continue to migrate from banks to non-bank intermediaries, additional prudential challenges arise. Key areas include insurance supervision and mutual fund regulation.
Full text
The Basel III framework is nearing completion. In addition to finalising the remaining calibration decisions, consistent and thorough implementation is now key, alongside more rigorous supervision. With regulatory uncertainty receding, banks need to keep adjusting their business models to the new market environment. This includes addressing legacy problems, such as those related to non-performing loans (NPLs). Once financial sector repair is completed, safer and stronger banks will unambiguously contribute to a more resilient economy.
Any remaining adjustments to bank business models will have to be implemented in a challenging macroeconomic environment. Various factors, such as low or, in some cases, negative interest rates (Chapter II), will complicate adjustment for those banks that have yet to fully implement balance sheet repair.
Institutional asset managers, particularly life insurers and pension funds, are subject to very similar pressures. Since their performance is driven largely by the interest rate environment and their product mix, persistently low rates make it more difficult to maintain target returns and traditional asset-liability structures. As risks continue to migrate from banks to these and other non-bank players, additional prudential challenges arise. Key areas include insurance supervision and mutual fund regulation.
This chapter investigates the challenges the financial sector is facing. First, it reviews recent developments among international banks as well as in the insurance and pension fund sectors. It then discusses the nearing completion of the Basel III regulatory framework and assesses the macroeconomic impact of the resulting transition to a more robust, better capitalised banking system. It ends with a discussion of the prudential implications for the non-bank sector.
Coping with a challenging environment
Banks: dealing with stiff headwinds
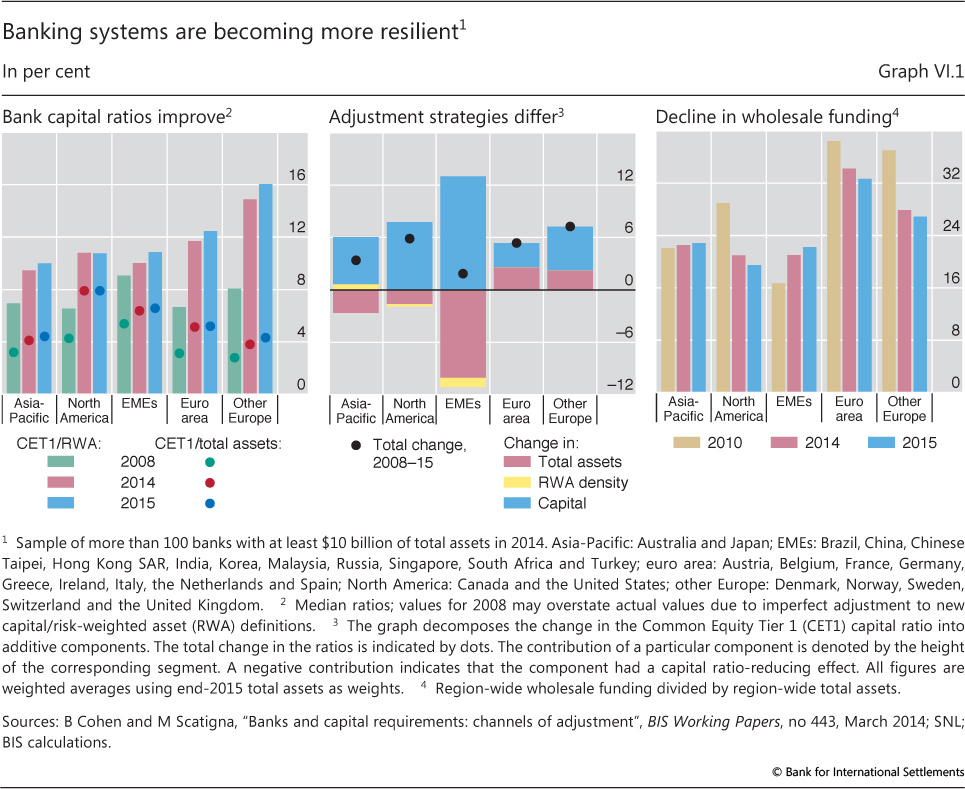
The process of strengthening bank balance sheets continues. Banks, most notably in Europe, have further raised their capital ratios, reducing balance sheet leverage (Graph VI.1, left-hand panel). A variety of forces are driving this adjustment. Clearly, the phasing-in of the new regulatory framework is an important one. In addition, the losses incurred during the recent crises have enhanced investor incentives to scrutinise banks' risk-return trade-offs, favouring higher levels of capitalisation.
Banks have opted for different adjustment strategies to improve capital ratios, reflecting the varied economic environment they faced (Graph VI.1, centre panel). While retained earnings have represented an important source of capital for most banks, capital ratios in Europe, for example, have tended to improve in a context of balance sheet compression. By contrast, large banks in North America and many emerging market economies (EMEs) have generally improved their ratios against the backdrop of growing balance sheets and robust loan demand.
Bank funding models have also been put on a more stable footing, further adding to bank resilience. Reliance on short-term wholesale funding, a key channel of contagion during recent crises, has declined markedly in many advanced economies (Graph VI.1, right-hand panel). Likewise, banks' holdings of high-quality liquid assets (HQLA) have continued to grow, providing additional buffers. The majority of banks monitored by the Basel Committee on Banking Supervision (BCBS) already meet the fully phased-in Liquidity Coverage Ratio (LCR) requirement, well ahead of its full implementation on 1 January 2019.1
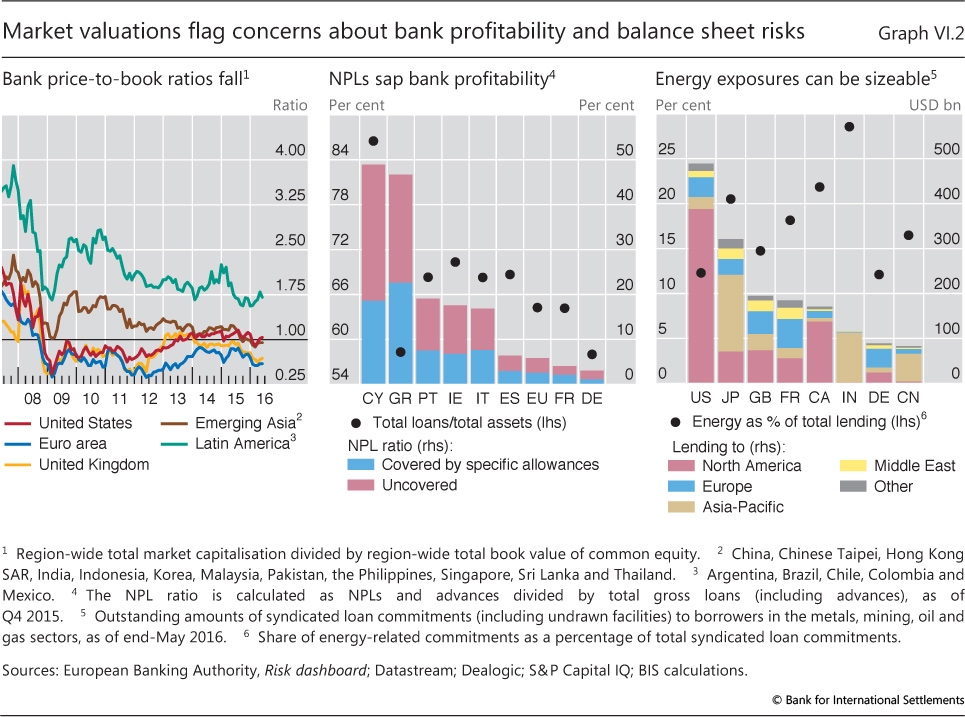
Given the progress made in transitioning to stronger bank balance sheets, ensuring sustained profitability is now the key issue in maintaining the sector's resilience. Empirical evidence suggests that better capitalised banks enjoy lower funding costs and lend more (Box VI.A). Yet equity investors remain generally cautious about the outlook for bank profitability, suggesting that the necessary adjustments to business models have so far proceeded unevenly. Price-based indicators highlight that bank equity valuations of many advanced economy banks, in particular, have yet to recover from their collapse during the Great Financial Crisis, with market values below book values in a number of economies (Graph VI.2, left-hand panel).
A complicating factor is that efforts to complete balance sheet repair and bolster profitability face a confluence of both cyclical and structural headwinds. Key challenges include the prospect of persistently low interest rates amid an often subdued growth outlook. These factors can affect bank profitability through a variety of channels2 whose strength depends on the individual bank's balance sheet composition, its business model and the surrounding macroeconomic environment. Reflecting differences among these factors, major banks' profitability has recently improved in some jurisdictions, while showing persistent signs of weakness in others.
Box VI.A
Bank capital and lending behaviour: empirical evidence
Discussions of the macroeconomic impact of higher bank capital sometimes presume that higher bank capital increases total (equity plus debt) funding costs, which then translate into higher lending spreads and less lending. The argument invokes observed deviations from the Modigliani-Miller (MM) theorem, which posits that the capital structure is irrelevant for the cost of funding.
Deviations from the MM theorem are indeed well documented, but this is not sufficient to establish that higher bank capital entails reduced lending. Indeed, recent research suggests the opposite may be true: higher bank capital goes hand in hand with higher lending. For one, a study by the EBA (2015) finds substantial positive credit supply effects from higher bank capital for a sample of European banks. In addition, Michelangeli and Sette (2016), using granular data on internet-brokered mortgages, show that better capitalised banks lend more.
One potential mechanism driving the positive relationship between loan supply and bank capital is the lower borrowing costs of better capitalised banks. Gambacorta and Shin (2016) find that a 1 percentage point increase in the equity-to-total assets ratio is associated with a 4 basis point reduction in borrowing (non-equity funding) costs. Given that non-equity funding represents, on average, around 86% of total bank liabilities, the resulting effects on the overall cost of funding can be sizeable and will mitigate any assumed cost of raising additional equity.
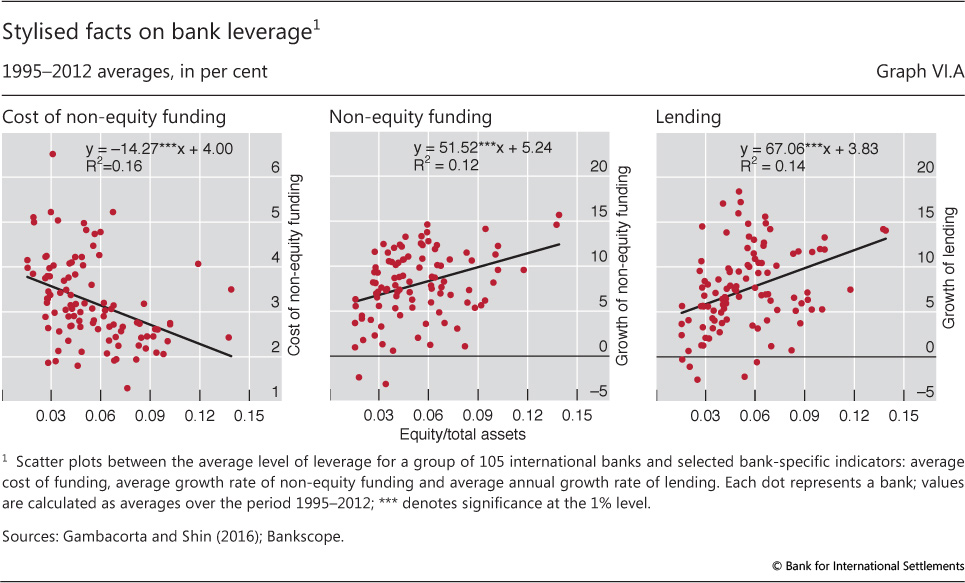
Graph VI.A plots average levels of leverage (defined as the ratio of equity to total assets) for a sample of banks over the period 1995-2012. The three panels show how bank leverage is related to non-equity funding costs (left-hand panel), non-equity funding (centre) and lending (right-hand panel). Being based on raw data without statistical controls, the scatter plots overstate the noise in the observed relationships. Yet it is apparent that lower leverage is associated with lower debt funding costs and a higher growth rate of both non-equity funding and lending.
See F Modigliani and M Miller, "The cost of capital, corporation finance and the theory of investment", American Economic Review, vol 48, no 3, 1958, pp 261-97. See eg D Miles, J Yang and G Marcheggiano, "Optimal bank capital", The Economic Journal, no 123, 2013, pp 1-37. European Banking Authority, "2015 EU-wide transparency exercise results", London, 2015; V Michelangeli and E Sette, "How does bank capital affect the supply of mortgages? Evidence from a randomized experiment", BIS Working Papers, no 557, April 2016. L Gambacorta and H S Shin, "Why bank capital matters for monetary policy", BIS Working Papers, no 558, April 2016. The results shown are reinforced after controlling for business cycle conditions and bank-time fixed effects: a 1 percentage point increase in the equity-to-total assets ratio is associated with a 0.6 percentage point higher annual growth rate in lending.
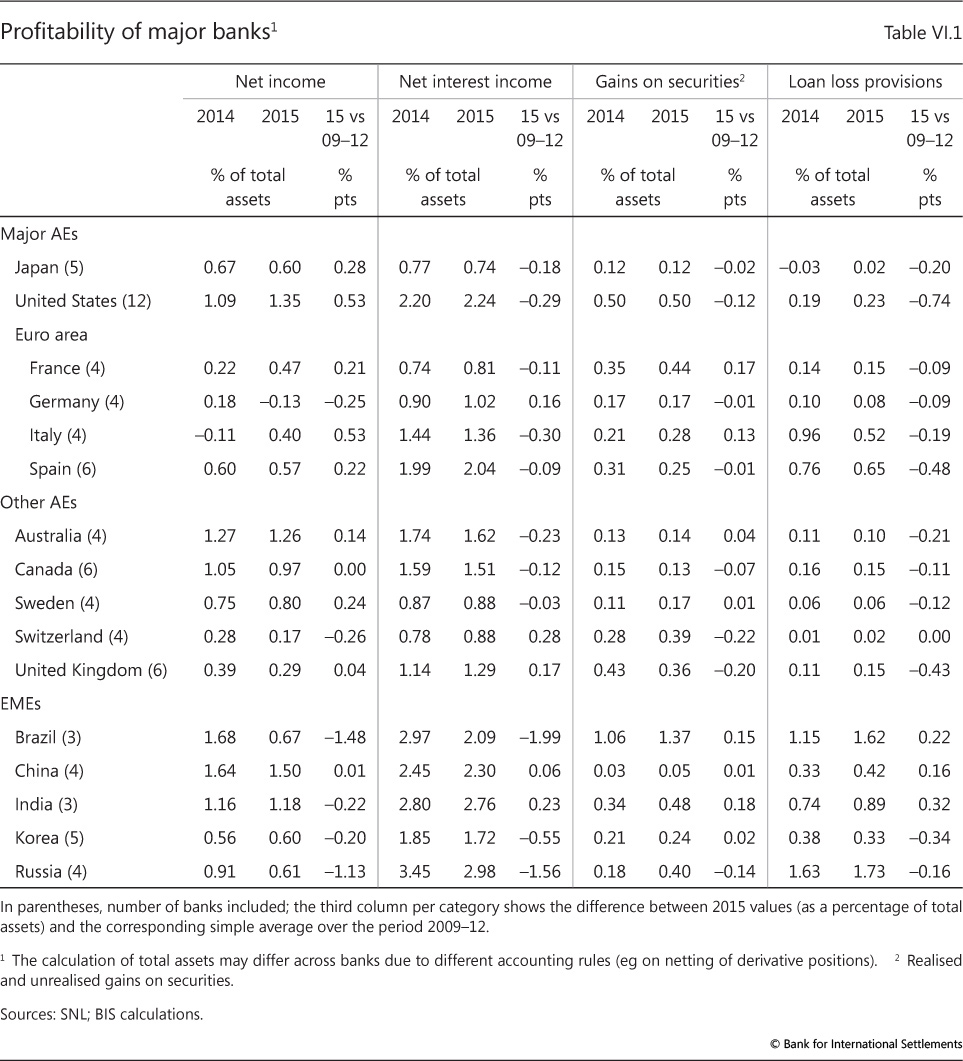
One channel through which low interest rates are affecting bank profitability is via their impact on net interest margins, the main source of revenue for many banks. Weak credit demand, paired with declining interest rates on new loans or existing floating rate loans, compresses banks' interest revenue. Unless counterbalanced by other factors, this can squeeze margins, as is apparent for major banks in several economies (Table VI.1).
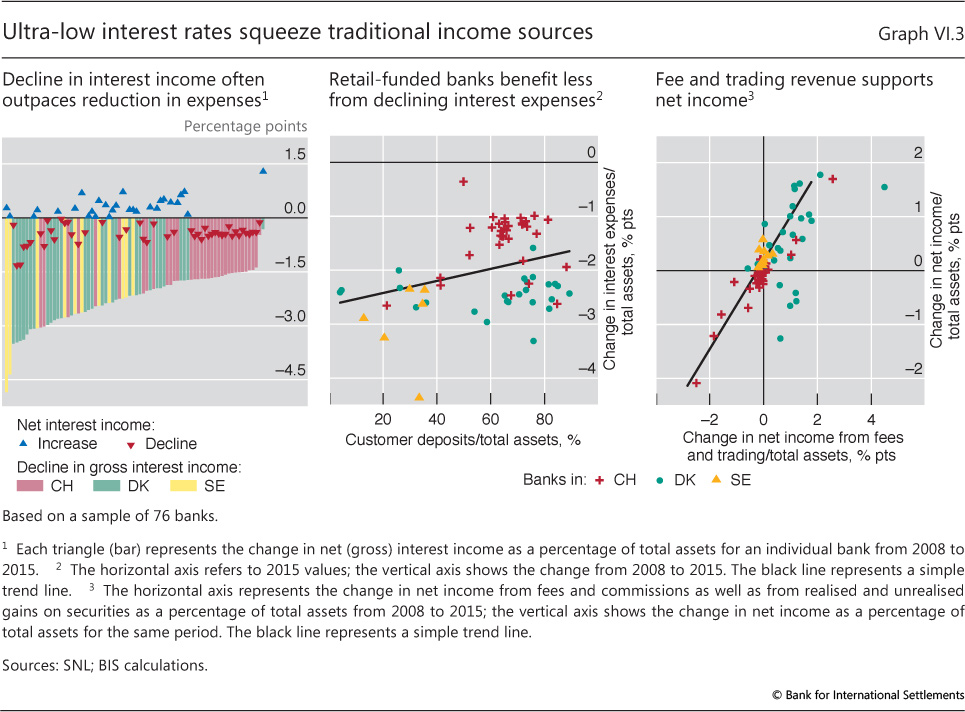
Pressures on net interest margins are particularly pronounced among banks from jurisdictions that now face negative short-term rates (Chapter II, Box II.A). Many banks in Denmark, Sweden and Switzerland, for example, have experienced declining net interest margins over recent years, with the compression in interest income often outpacing the reduction in interest expenses (Graph VI.3, left-hand panel).
More recently, banks have typically refrained from cutting retail deposit rates below zero in order to retain customers. By contrast, passing through negative rates to institutional clients has generally been easier. Thus, banks that rely heavily on retail deposits have seen their interest expenses decline less than their more wholesale-funded peers (Graph VI.3, centre panel). Yet many banks have still managed to protect their profits by tapping other revenue sources, for example by encouraging retail clients to shift to fee-generating investment products.
In some cases, revenues have also been supported by a buoyant housing market and strong demand for mortgage loans. But, while boosting income in the short run, increasing such exposures may eventually weigh on earnings via high loan write-offs, especially if balance sheet expansion coincides with declining lending standards or aggressive pricing.
A second channel through which low interest rates are affecting profitability is banks' capital market activities (Table VI.1 and Graph VI.3, right-hand panel). Over the past few years, with corporate issuers seeking to lock in favourable market funding, the persistent expansion in non-financial corporate bond issuance has bolstered banks' underwriting business and trading revenues. In addition, banks in many jurisdictions have benefited from mark-to-market gains on their securities portfolios, with the global decline in interest rates pushing asset valuations to new highs. The flip side, however, is that these valuation gains are one-off and bound to reverse if the underlying assets are held to maturity. Growing holdings of low coupon bonds, in turn, will weigh on banks' future portfolio returns. Rising issuance of such bonds has increased substantially the duration of outstanding securities, making unhedged securities positions vulnerable to mark-to-market losses even for small increases in yields. Indeed, banking sectors in a number of economies posted declining revenues from fees and trading over the last year, reflecting volatile conditions and weaker client activity in several major bond markets (Chapter II).
Cyclical factors are adding to concerns about legacy assets, particularly in the euro area. A sluggish recovery continues to weigh on borrowers' repayment capacity in a number of euro area countries, as rising non-performing loans (NPLs) remain unresolved. In this context, low interest rates may initially mask looming credit risks by compressing borrowers' debt service burdens. They also provide incentives for banks to postpone write-offs by lowering the cost of keeping troubled borrowers afloat. While some progress has been made to address NPLs, recent data from the European Banking Authority highlight that such exposures remain a major impediment to European banks' profitability (Graph VI.2, centre panel).3 They can also make banks more vulnerable to borrowers' fortunes and restrain new lending.
Varied NPL patterns suggest that there are no "one size fits all" solutions. Past experience shows that authorities can help improve banks' incentives via changes to the tax code, by reducing impediments to collateral sales, and by addressing obstacles to debt restructuring. This includes the use of public sector funds, subject to strict conditions and proper incentives - an effective catalyst of balance sheet repair in past crises.4 In making the relevant policy decisions, the benefits of reducing systemic risks and unlocking economic activity are likely to dominate any constraints implied by competition policy considerations.
With the global growth outlook softening, rising NPLs are also expected to weigh on EME banks' performance. Most vulnerable are banks in countries where financial booms have been turning or are in the late stages, such as China and other East Asian economies (Chapter III), or where large exposures to commodity- and energy-related sectors bulk large. NPLs and other borrower risk metrics in some major EMEs have already worsened, requiring banks to step up their loan loss provisioning (Table VI.1) as equity price-to-book ratios have weakened (Graph VI.2, left-hand panel).
Exposures to commodity risks extend beyond EME banks. A number of regional financial institutions in Canada and the United States, in particular, have a relatively high concentration of lending to the energy sector. And internationally active banks had energy-related syndicated loan commitments (including undrawn facilities) amounting to some $2.2 trillion at end-May 2016. Geographical diversification of such loans may turn out to be ineffective in mitigating risk if commodity price weakness is prolonged (Graph VI.2, right-hand panel).
Persistent structural challenges to bank profitability are reinforcing the effect of these cyclical factors. One such challenge is the ongoing shift in intermediation towards non-banks (see below), which, in the medium term, could be further amplified by new financial technologies (Box VI.B). Maintaining profitability will therefore require banks to identify overcapacity and cut costs, while seeking to reap the efficiency gains of technological innovation.
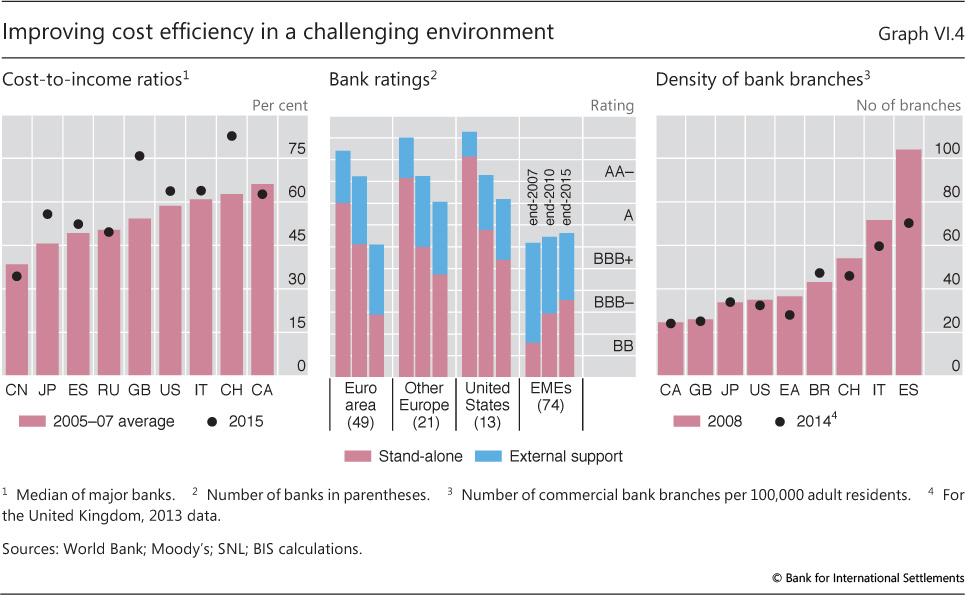
Advances in this area have been mixed. For many banking systems, cost-to-income ratios have broadly remained on an upward path post-crisis (Graph VI.4, left-hand panel). Often, subdued revenues and the associated downward pressure on banks' ratings have offset cost-cutting gains (Graph VI.4, centre panel).
Box VI.B
Digitalisation in the financial sector: opportunities and challenges
Digitalisation and "fintech" are umbrella terms that encompass a wide range of technological innovations affecting the financial sector. A shared feature of all these innovations is that the volume of related activities remains small, while being potentially transformative in terms of banks' business models and corporate cultures. They all tend to provide new ways to communicate, store and process information, and to access financial services. As such, they are changing the way banks interact with each other and with their customers. In addition, many of these new technologies were created by non-financial firms and, in some cases, provide ways for customers to access financial services without bank involvement, adding to competition. Digitalisation thus provides the banking sector with both opportunities and challenges.
Matching services. One area of particular importance to the banking industry is matching technologies. Over the last few years, several electronic venues have started offering services providing such matching, often referred to as "crowdfunding" or "peer-to-peer" lending. Under a pure matching model, the firms providing these services do not actually borrow or lend themselves and thus do not take any risk onto their own balance sheets. Some crowdfunding services have begun to move beyond debt contracts, expanding into services such as equity financing and even some types of structured financial products, and are thus competing more directly with traditional bank-intermediated products. In response, some banks have started to integrate crowdfunding technologies into their business models, for example by entering into formal partnerships with matching platforms or similar venues.
Big data. This term refers to huge data sets that contain massive amounts of detailed information on a large number of individuals, often in the form of multiple linked databases. To the extent that banks accumulate such data on their customers, big data technology can be used to tailor banks' services more effectively (eg by evaluating the credit quality of their borrowers on a larger number of metrics). As a result, individual loan terms and risk factors are likely to be better aligned, improving risk management and pricing. However, as non-financial companies are accumulating big data sets about their own customers and are building the capacity to analyse them, they may be able to compete with banks to offer financial services, putting pressure on bank margins.
Digital payments. In digital payments, smartphones and other electronic devices are now providing access to various banking services and the established payments system. Even though the payment service components of these applications are typically routed through the banking sector, service providers may offer additional financial services, such as means of saving or storing funds. This can increase competition and the cost pressures banks face.
Distributed ledgers. A potentially more substantial development in the payments area is the more widespread use of distributed ledger and blockchain technologies. This innovation provides an alternative means of recording financial information without recourse to trusted intermediaries. With a distributed ledger, it is possible for everyone in a given financial network to know the resources of all parties in the network as well as the history of all transactions. This technological ability to uniquely and verifiably execute transactions could be applied to a wide range of financial products. Some financial institutions, for example, have experimented with distributed ledgers to place and trade certain types of securities, such as syndicated loans, or are considering offering features such as "smart contracts" that allow automated execution and verification once certain conditions are met. In general, the decentralised nature of distributed ledgers would reduce the need for certain record keeping and back office services, suggesting that trading and settlement might be provided more quickly and at a lower cost.
Digitalisation trends are evolving rapidly and any net effects remain unclear. While some aspects of digitalisation appear to increase competition for banks, significant resources are already invested in these technologies so as to utilise them to enhance bank business models and cut costs. Authorities will have to monitor these effects with a view to expanding the sectoral scope of regulation should less regulated service providers gain a significant foothold in the provision of digitally based financial services.
See eg European Banking Federation, The digital transformation of banks and the Digital Single Market, June 2015. See Committee on Payments and Market Infrastructures, Digital currencies, November 2015.
Improving cost efficiency will thus require a mix of strategies. These will include further operational enhancements, such as raising the efficiency of back office functions, as well as continuous evaluation of the product and service portfolio. Another key element is strengthening bank resilience, which can help offset the impact of reduced implicit government guarantees on bank funding costs.
In all this, it will be critical to cut excess capacity. One gauge of potential overcapacity is the density of bank branches. This measure, while broadly declining post-crisis, is still high for several European countries by international standards (Graph VI.4, right-hand panel). And the overall scale of the adjustment so far appears rather limited compared with historical crisis experience. After the onset of the Nordic crisis in 1991, for example, banks in Finland reduced the number of branches by more than 40% within four years, while cutting operating expenses by more than 50%.
Other financials: more of the same?
Financial institutions outside the banking sector face challenges from the same macro-financial factors as their bank peers. The current low interest rate environment, in particular, makes it more difficult for insurers to maintain targeted profitability levels, by reducing demand for their life insurance products and their fee-charging ability. As a result, traditional savings products are waning and some insurers have responded by shifting to so-called unit-linked (ie mutual fund-style) products. Defined benefit (DB) pension plans (whose liabilities reflect member benefits that accrue over a long period of time after retirement) are facing similar pressures.
A key challenge to balance sheet management for insurers and pension funds (IPFs) is the interest rate sensitivity of their liabilities, which tend to be very long-term. Fixed income securities on the asset side, in contrast, typically have shorter maturities. This gives rise to a duration mismatch. As a result, the present discounted values of these client claims can be rather volatile and, unless immunised (eg via the use of derivatives), move more strongly than those of the corresponding assets. This applies to life insurance and DB pension plans, but also to products such as long-term care and disability insurance. Thus, risk profiles in both sectors depend primarily on the interest rate environment and firms' product mix.
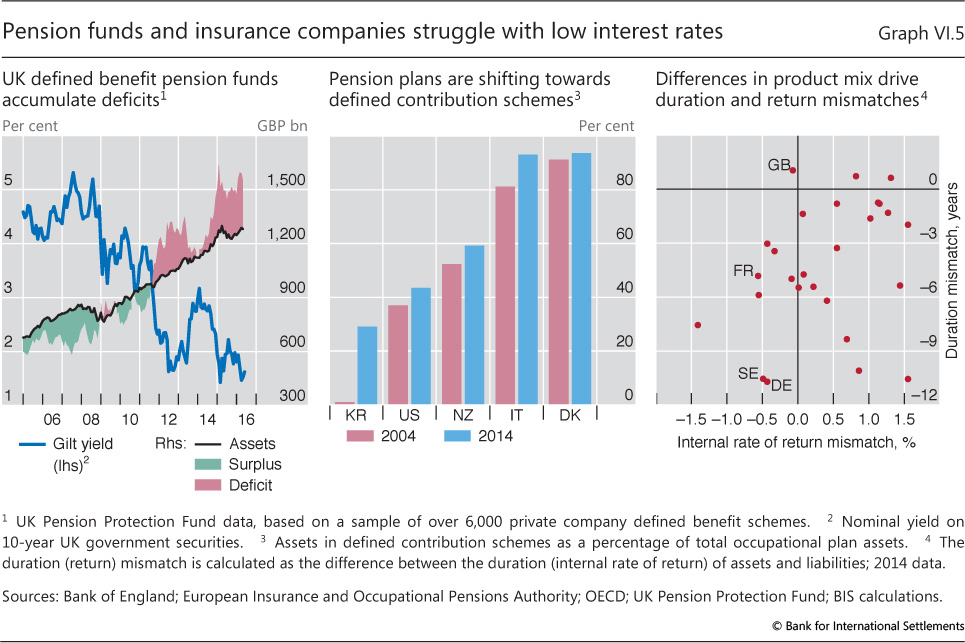
Recent developments in DB pension schemes illustrate some of these balance sheet pressures. Given the discounting of projected financial obligations with market yields and the underlying duration mismatches, lower interest rates have boosted pension fund liabilities relative to assets, generating large deficits in some cases. In the United Kingdom, for example, 82% of a sample of about 6,000 private company DB schemes were underfunded at the end of the first quarter of 2016, with the aggregate deficit at around £302 billion (Graph VI.5, left-hand panel) in March. Likewise, S&P 500 companies' estimated pension deficits totalled about $455 billion at the end of the same quarter. Developments in other jurisdictions have been similar.
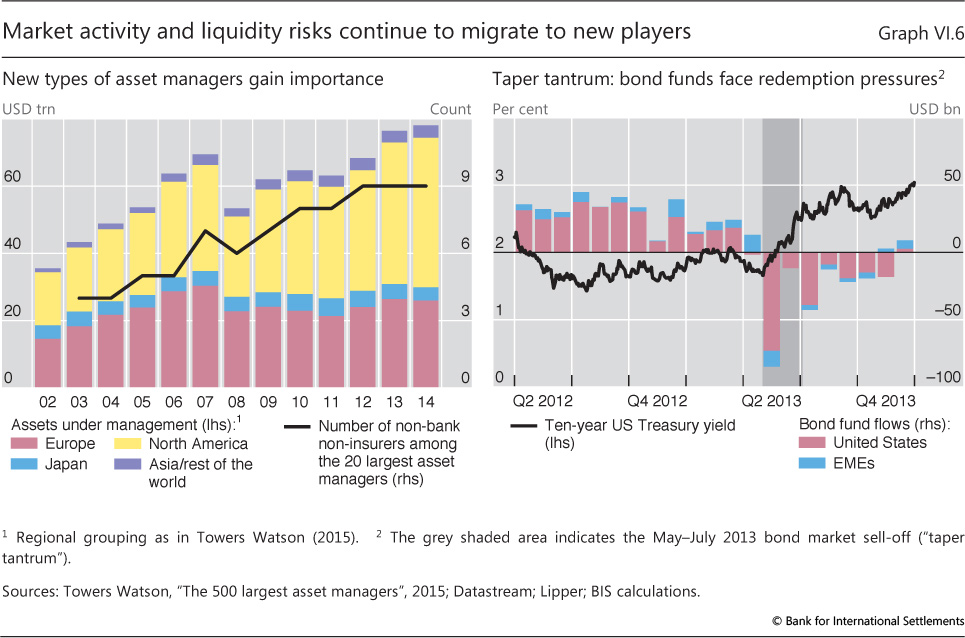
In response, firms have begun to adjust their product mix and asset composition. In insurance, this has added to the general shift towards unit-linked products, which generate higher fees and are less capital-intensive because investment risks are not borne by the insurance company. Pension funds, in turn, have continued to shift towards defined contribution (DC) schemes, which, like unit-linked insurance, shift investment risks onto pension plan members (Graph VI.5, centre panel). The resulting flows into mutual funds and similar investment vehicles have further boosted their assets under management - a trend that predates the financial crisis (Graph VI.6, left-hand panel).
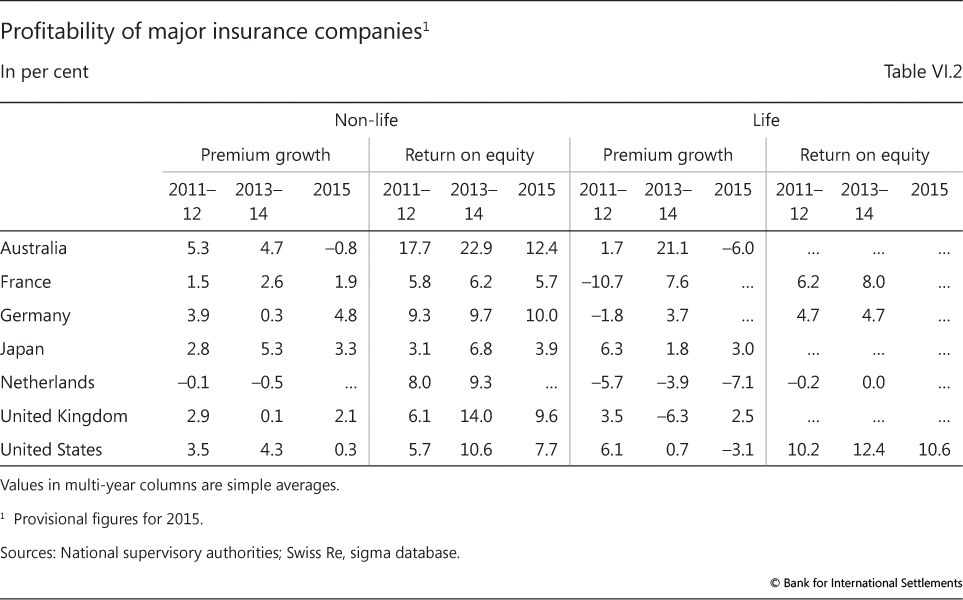
As shifts in the product mix take time, the low interest rate environment has so far left its imprint mainly on the asset side of IPFs' balance sheets. For one, across various jurisdictions, low rates have depressed portfolio yields as well as premium growth and, hence, earnings (Table VI.2). Because substantial parts of IPFs' investment portfolios are allocated to fixed income instruments, persistently low rates make it much more difficult for them to invest at original yields as investments mature. This encourages them to search for yield (as discussed in last year's Annual Report), especially if they have to generate returns above those guaranteed on liabilities (see below). They could also respond by reaching for longer duration (eg low coupon bonds or equities) to better match liabilities and hence reduce risk.
Some European IPFs, for example, have sought to counter growing liabilities durations by shifting into sovereign bonds. These bonds typically have longer maturities and, hence, durations than corporate bonds and are more liquid. The entry into force of the new Solvency II regulatory standard on January 2016, in turn, strengthened such incentives for European insurers, given relatively favourable risk weights for sovereign and certain corporate exposures (Box VI.C). As a result, according to EU flow of funds statistics, the IPFs' share of euro area government debt outstanding rose from about 19% in 2009 to 23% at end-2015. As yields have been declining, this has been hurting interest rate income and profitability, possibly contributing to feedback effects and short-term asset price volatility.5
The performance of the sector has differed across institutions and jurisdictions, reflecting differences in market structures and product mix.6 For one, despite their interest rate risk immunisation attempts, life insurers in most European countries continue to have negative duration gaps, implying net valuation losses if interest rates decline further. Many of these insurers also face an investment return mismatch (eg in France, Germany and Sweden). That is, the embedded return guarantees on their liabilities exceed the returns on their assets, raising questions about the sustainability of their business models in the current low interest rate environment (Graph VI.5, right-hand panel). UK insurers, by contrast, appear to be less exposed - in part because of their greater reliance on unit-linked products.
Box VI.C
Solvency II: overview of key elements
Solvency II is the new regulatory framework for insurance undertakings in the European Economic Area (comprising the EU countries as well as Iceland, Liechtenstein and Norway). It was first adopted in 2009. The new rules seek to harmonise the regulation of insurers across the EEA, while introducing the concept of risk-based solvency requirements. In doing so, Solvency II adopts a total balance sheet approach that aims to reflect the full range of risks on both the asset and liability side of insurers' balance sheets, based on market-consistent valuations. The new rules apply at both group and solo insurance levels. They are due to be phased in over an extended period, beginning in January 2016, and are expected to significantly affect insurers' asset allocations and reserving.
Risk-based capital requirements. Much like banking regulation, Solvency II organises capital requirements in three pillars: quantitative requirements (pillar 1), qualitative aspects and supervisory review (pillar 2), and disclosure requirements (pillar 3). Capital adequacy is part of the first pillar and based on two sets of rules: the Solvency Capital Requirement (SCR) and the Minimum Capital Requirement (MCR), along with a "ladder of intervention" for supervisors tied to both capital measures. The SCR can be regarded as a solvency buffer which, when breached, triggers supervisory intervention; the MCR is the minimum level of capital below which a firm is put into run-off. The SCR stipulates that an insurer is sufficiently capitalised when it covers unexpected losses with a probability of 99.5% over a one-year horizon. Eligible capital items are classified into three tiers, according to their loss-absorbing capacity. As under Basel II/III, insurance undertakings can calculate SCR charges through internal models, subject to regulatory approval, or apply standardised formulae.
Risk modules. Risks are divided into six risk modules - market, counterparty (default), life, non-life, health and intangible risk - and each module is further divided into sub-modules. Diversification effects between these risks are recognised, which will tend to benefit insurance conglomerates. In addition, there is a capital charge for operational risk and an adjustment for loss-absorbing effects (eg from deferred taxes). The design of market risk charges is perhaps the most important innovation in the new framework. The market risk module is itself divided into seven sub-modules: equity, spread, interest rate, property, currency, concentration and illiquidity risk (relating to the illiquidity premium in the discount rate). Given the relevance of fixed income products for insurance portfolios, the spread and interest rate sub-modules are key. In the spread risk module, which covers the risk of a change in value due to a deviation of the actual from the expected market price of credit risk, capital requirements under the standardised formula are mainly driven by external ratings and duration. Both sovereign and (investment grade as well as unrated) corporate bonds receive relatively favourable treatment. The interest rate risk (ie changes in value caused by a deviation of actual interest rates from expected ones) sub-module, in turn, addresses risks on both the asset and liability side. In order to assess net interest rate risk, all relevant exposures are stress-tested by applying up-/downward stress to the yield curve. Capital charges are then calculated on this basis.
Market-consistent valuations. While many assets are traded in markets deep enough to yield reliable prices and market values, the same may not apply to liabilities. In determining the value of insurance liabilities, Solvency II thus requires insurers to forecast expected future liability-related cash flows and discount them with a risk-free interest rate (plus a risk margin) to obtain market-consistent values. Because different discount rates for matched assets and liabilities can create a valuation mismatch and cause artificial balance sheet volatility, matching adjustments to insurers' discount rates may then be used to offset part of this impact of short-term asset price fluctuations.
New disclosures, the first-time use of internal models and national regulators' different interpretations of individual rules may complicate the transition to the new standard from a stakeholder perspective. A key question concerns the extent to which capital positions and thus solvency margins will turn out to be more volatile than under previous standards. In addition, with group-based and solo treatment placed on the same footing, the new standard is likely to generate significant diversification benefits for large insurers, adding to consolidation pressures. Questions about international equivalence, in turn, should provide additional impetus to the finalisation of the globally harmonised Insurance Capital Standard (ICS) by the International Association of Insurance Supervisors (IAIS).
See European Commission, Directive 2009/138/EC and Directive 2014/51/EU. See Committee on the Global Financial System, Fixed income strategies of insurance companies and pension funds, July 2011. See CGFS (2011); bonds issued by member states' central governments and central banks denominated and funded in the governments' domestic currency receive a zero risk charge, irrespective of their external rating.
Going forward, countries with insurance sectors that suffer from both duration and return mismatches appear particularly vulnerable. This will tend to weigh on the profitability of sectors with a larger share of traditional guaranteed-return savings products and with smaller, standalone life insurers. Authorities there may have to exploit any available leeway to help adjust IPFs' minimum return guarantees. Supervisors, in turn, may have to increase their scrutiny of the insurance sector's duration and return mismatches, especially for smaller players, while standing ready to accommodate the consolidation pressures that weakening profitability generates. In Europe, the adoption of Solvency II, by introducing market-consistent valuations, might accelerate this consolidation process via the diversification benefits that derive from group-level regulation and by encouraging a secondary market in insurance liabilities (Box VI.C).
Finalising the post-crisis reforms
Finishing the job on banking regulation
The overhaul of the Basel regulatory framework is nearing completion. The BCBS has committed to finalise its post-crisis reforms by end-2016, with the phase-in extending to 2019.7 Other regulatory measures, such as new or enhanced resolution regimes, will be implemented in parallel. This will help to gradually remove regulatory uncertainty and support banks' capital and liquidity planning. In taking the final calibration decisions, the BCBS will focus on not significantly increasing overall capital requirements. However, ample room is available for national authorities to further raise regulatory capital, providing sufficient flexibility to activate countercyclical capital buffers and similar requirements, as needed. The result will be a stronger and more resilient banking system, which ensures individual institutions are less likely to fail and reduces the impact on the economy in case they do. Banks will also be able to support the real economy through greater lending than otherwise. Hence, even under very conservative assumptions, the substantial longer-term benefits for the real economy should outweigh any short-term transitional adjustment costs.
Following the January 2016 decision on the calibration of the minimum leverage ratio (LR) and the subsequent publication of the BCBS's new market risk standard, the post-crisis bank regulatory framework is now almost complete. To be sure, work on specific items is continuing, notably on new standardised approaches for credit and operational risk as well as on risk weight floors and the treatment of sovereign exposures (Chapter V). But the main calibration decisions are due by year-end.
The new framework addresses important weaknesses of the international banking system revealed by the 2007-09 financial crisis. Uppermost among these are insufficient loss-absorbing bank capital and liquidity buffers. As part of enhanced risk-weighted capital requirements (RWRs), banks now have to comply with a minimum ratio of 4.5% Common Equity Tier 1 (CET1) capital to risk-weighted assets (RWAs) and a 6% Tier 1 capital ratio (comprising a broader capital definition). They also have to maintain an additional CET1 capital conservation buffer of 2.5%. As a result, the new framework sets significantly higher loss absorption requirements and puts greater emphasis on capital quality, while broadening the coverage of bank risks.
The RWRs are complemented with a number of additional requirements. These include: (i) the new minimum LR requirement that backstops the existing RWRs with a simple, non-risk-based measure; (ii) capital surcharges for systemic risk (eg the countercyclical capital buffer and additional requirements for global systemically important banks (G-SIBs)); and (iii) standards for short-term funding and maturity transformation risk (ie the LCR and NSFR). Complementary measures to these core elements comprise improved resolution regimes that support authorities in dealing with failing financial institutions, including via a requirement for G-SIBs to have greater Total Loss-Absorbing Capacity (TLAC) in resolution.8
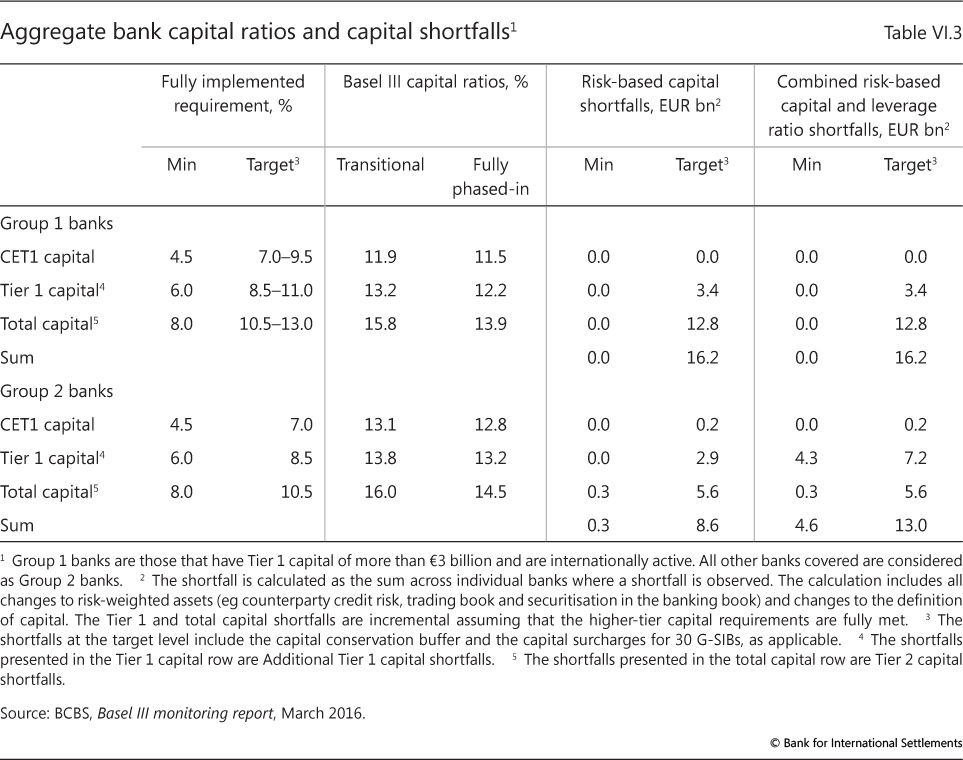
While the full phase-in of these requirements will take several years, many banks have already completed most of the adjustment. As a result, capital levels have increased and reliance on wholesale funding has declined (Graph VI.1). Remaining capital shortfalls are now at or close to zero on most measures (Table VI.3). For example, even on a fully phased-in "target" basis (ie ignoring any transitional arrangements and including the 2.5% capital conservation buffer and G-SIB capital surcharges, where they apply), the aggregate CET1 shortfall is now only €0.2 billion. Moreover, all of it is due to the smaller of the 230 banks the BCBS monitors. In terms of total capital requirements, which include CET1 as well as additional Tier 1 and Tier 2 capital instruments, the aggregate capital shortfall has declined to €29.2 billion. This is equivalent to less than 0.1% of banks' total RWAs, according to the most recent BCBS (2016) data.
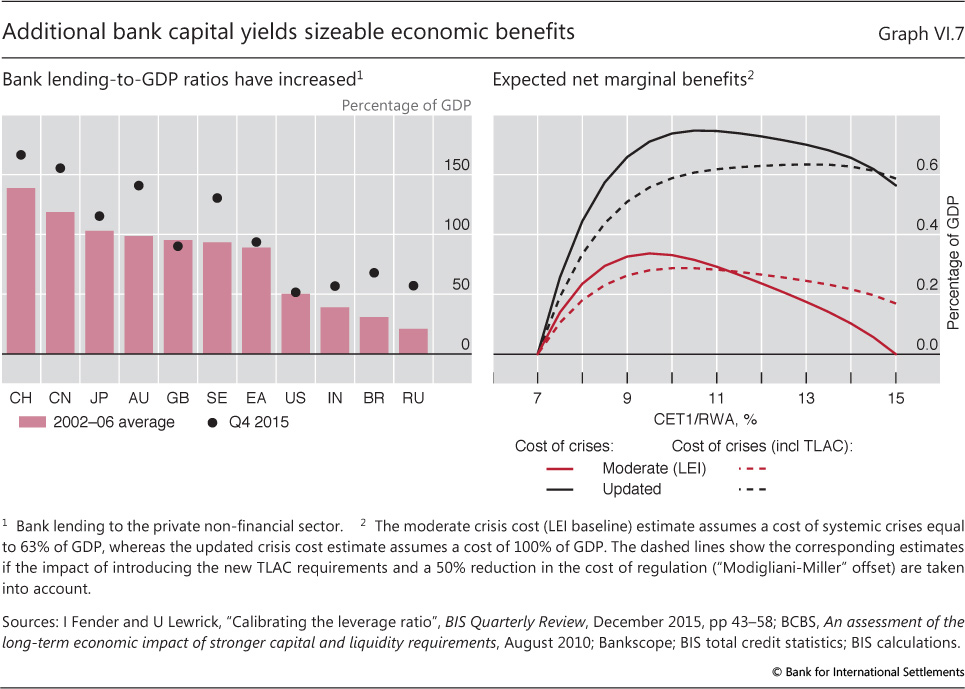
Importantly, raising capital has been achieved without much sign of an adverse shorter-term impact on bank lending to the real economy. For example, bank lending to the private non-financial sector as a share of GDP has continued to grow in many jurisdictions (Graph VI.7, left-hand panel). That is, any short-term impact of the new regulations was either small to begin with, or has been mitigated by offsetting macroeconomic policies.9
Macroeconomic impact
A key policy question is whether these higher target capitalisation levels are likely to be beneficial from a macroeconomic perspective. The BCBS's long-term economic impact (LEI) assessment provides a suitable framework to formulate an answer.
On this basis, analysing the effects of higher bank capital levels comprises three main elements (see Box VI.D for details): (i) an estimate of the increase in capital associated with the new minimum requirements (the implied "capital shortfall"); (ii) the benefits from higher capital in the form of lower (expected) crisis costs (ie the reduction in the crisis probability times costs in terms of output losses for a given increase in bank capital); and (iii) the possible output loss from any increase in lending spreads that might result from the same increase in bank capital. The LEI provides very conservative estimates for the latter two elements. Once adjusted for more stringent capital definitions and RWA calculations under Basel III, these can then be combined into a net benefits schedule that indicates the estimated macroeconomic impact from rising minimum CET1/RWA requirements.
Graph VI.7 (right-hand panel) depicts two sets of marginal net benefit schedules, given alternative crisis cost estimates and a starting point of 7% CET1/RWA (as per Table VI.3). The first schedule (solid red line) reports the baseline results from the original LEI, which are based on moderate crisis costs of 63% of GDP in net present value terms. The second one (solid black line) uses a higher cost estimate of 100% of GDP, which seeks to incorporate also the more recent - very costly - crises. Even for the moderate crisis cost estimate, the benefits of rather large additional minimum regulatory requirements clearly outweigh the costs.
Notably, these figures intentionally overstate the likely cost of higher capital ratios, while failing to reflect the effects of the new TLAC requirement for G-SIBs. The LEI estimates assume away the reduction in borrowing costs linked to higher capital, confirmed by recent BIS research (Box VI.A). The two alternative schedules (Graph VI.7, right-hand panel, dotted lines) seek to take at least part of this effect into account by applying a capital cost "offset" of 50%, as the academic literature suggests (Box VI.D). This halves the estimated impact on output. They also adjust marginal benefits for the effects of TLAC, which is likely to reduce both crisis costs and probabilities for any given capitalisation level.10
The resulting range of estimates suggests that there is ample room for the BCBS to make its final calibration decisions. The net economic benefits (measured by the impact on the level of output per year) of higher capital requirements are exhausted only after a substantial increase from the baseline level of 7% for the CET1/RWA ratio. Within that range, more stringent regulatory standards are growth-friendly, in particular if phased in gradually.
Shifting the prudential focus
As bank prudential reform is nearing completion, regulatory attention is being refocused. One key area comprises efforts to end regulatory fragmentation. Another relates to the interplay of banking regulation with financial markets, and how banking sector developments may interact with those in the non-bank sector.
Regulatory fragmentation is likely to remain an issue for internationally active insurance groups for some time, but efforts to address it are progressing. In Europe, Solvency II is establishing a new harmonised regulatory regime for the entire insurance sector (Box VI.C). While this will eventually end fragmentation for European insurers, the new rules allow rather stretched-out phase-in arrangements subject to regulatory approval, which can lead to transitional implementation differences. In this context, both insurance company managements and investors will have to adjust to the volatility of capital positions and, hence, of solvency margins that the new standard implies. At the international level, efforts to establish a new global Insurance Capital Standard (ICS) seek to address fragmentation by establishing broad-based equivalence among national regulations. Technical development continues. Once finalised, the ICS would be the first comprehensive, group-wide capital standard that is broadly applicable to internationally active insurance groups. Implementation is planned for 2019, following an initial testing and refinement process.11
Box VI.D
The long-term economic impact (LEI) of stronger capital and liquidity requirements
The LEI methodology proceeds in two steps: (i) it assesses the long-term expected benefits of higher bank capital requirements via the reduction in expected output losses from systemic banking crises; and (ii) it compares these benefits with the expected costs in terms of forgone output. In deriving these estimates, the LEI adopts an explicitly very conservative approach by making assumptions that overestimate costs and downplay expected benefits.
Expected benefits. Conceptually, the expected benefits are based on multiplying the probability of systemic banking crises, given different minimum capital ratios, by the expected macroeconomic costs (lost output) of such crises should they occur. To link crisis probabilities with capitalisation levels, the LEI uses a range of models and credit risk analyses. Averaging the results from these models, it then derives a benefit schedule. The schedule exhibits diminishing marginal returns (ie the extra effect of additional capital declines as the capital level increases). For the starting capital ratio of 7% CET1/RWA (see main text), this yields a crisis probability of 1.6%, after taking the effects of the NSFR into account. Later studies broadly confirm these results.
Crisis cost estimates are derived from academic studies of crisis experiences. The LEI report finds that the median output cost of systemic banking crises is 63% of GDP in net present value terms. Yet the variation in cost estimates is large, as subsequent studies have confirmed. A shortcoming of most of these studies is that they rely only on pre-2007 data, missing the impact of the most recent crisis episode. An exception is Ball (2014), with results that imply a weighted average cumulative loss across all OECD countries of about 180% of pre-crisis GDP. Adding this estimate to the pre-crisis median will increase crisis costs. The analysis here assumes an updated cost estimate of 100%.
Expected costs. If higher bank capital requirements raise banks' costs, banks may respond by raising their lending spreads to offset the decline in their return on equity (ROE). As a result, borrowing costs for households and firms may rise, leading to lower investment and output. To estimate the size of this effect in the long run, the LEI assumed that banks maintain a constant ROE by passing on to their customers all additional costs due to higher capital requirements. The estimated increases in lending spreads were then fed into a variety of macroeconomic models to assess the resulting impact on GDP.
The headline result of this exercise is that a 1 percentage point increase in the CET1/RWA ratio translates into a 0.12% median decline in the level of output relative to its baseline, if converted into Basel III terms (with the corresponding value for the liquidity requirements being a one-off 0.08% output decline). By design, these results are likely to overstate the true costs, given that the LEI methodology abstracts from Modigliani-Miller effects. In practice, banks' required ROE can be expected to decline as their leverage and the risks to their shareholders fall.
Other factors. The conservative nature of the LEI approach also implies that any indirect effects of increased bank capital requirements are unlikely to materially affect the overall impact assessment. One such effect could arise from any regulatory impact on banks' market-making activities (see main text). Any reduction in such activity might imply higher liquidity premia and, ultimately, increased costs of issuing debt in normal times. For banks, however, these costs are counterbalanced by reduced balance sheet risk. For non-bank issuers, in turn, any increase in costs would be expected to be smaller than the LEI-implied increase in bank lending spreads. This is because these issuers can revert to banks as an alternative source of funding. The impact on both crisis costs and probabilities, finally, would depend on the degree to which non-bank investors underestimate the cost of having to liquidate assets during stressed market conditions ("liquidity illusion") - a risk that should decline as liquidity premia increase.
See BCBS, An assessment of the long-term economic impact of stronger capital and liquidity requirements, August 2010. See I Fender and U Lewrick, "Calibrating the leverage ratio", BIS Quarterly Review, December 2015, pp 43-58; original LEI results are converted into CET1/RWA terms using a conversion factor of about 0.78. L Ball, "Long-term damage from the great recession in OECD countries", European Journal of Economics and Economic Policies, vol 11, no 2, 2014, pp 149-60. Converted from the original LEI results using a conversion factor of about 0.78. The Modigliani-Miller theorem states that, under certain assumptions (such as the absence of taxes, bankruptcy costs, agency costs and asymmetric information), the value of a firm is unaffected by how that firm is financed. See F Modigliani and M Miller, "The cost of capital, corporation finance and the theory of investment", American Economic Review vol 48, no 3, 1958, pp 261-97. See eg D Miles, J Yang and G Marcheggiano, "Optimal bank capital", The Economic Journal, no 123, 2013, pp 1-37, who document a capital cost offset in the range of 45-75% for a sample of UK banks.
In addition, concerns over market liquidity have come to the fore (Chapter II). They have highlighted the role that institutional investors and collective investment vehicles may play in future market adjustments. Given these institutions' growing allocations to corporate bonds and other comparatively illiquid assets, their portfolio decisions may challenge market liquidity under stress. This raises the question of whether regulation has kept pace with these players' increasing importance.
A key structural feature of fixed income and, in particular, corporate bond markets is their continued reliance on market-makers. Market liquidity generally hinges on whether these specialised dealers respond to temporary imbalances in supply and demand by stepping in as trading counterparts. Market liquidity conditions in fixed income and repo markets have tightened somewhat over the last few years, at least on some metrics and when compared with pre-crisis times of overly ample market liquidity and compressed liquidity premia. While the overall evidence for any structural change in market liquidity remains scant, it is apparent that market-maker behaviour is changing (Chapter II).12 Less clear are the underlying causes and implications for regulation, if any.
There are both supply and demand factors at play, with net effects likely to differ across market segments. On the supply side, market-makers appear to be raising the price for their services, even though this may not be readily visible in the usual market liquidity indicators. This adjustment reflects both cyclical and structural factors. As regards cyclical ones, dealer banks in many jurisdictions have reportedly reappraised their risk tolerance in the wake of the financial crisis, cutting back on various activities, including market-making. Given that dealers adjust their leverage procyclically, financial markets tend to exhibit cycles in liquidity conditions.
Monetary policy will influence these cyclical effects, both by supporting market confidence and by easing banks' funding conditions. The latter, if passed through, also support the financing of other (non-bank) market-makers. At the same time, the current environment of low yields and rising market risks is affecting the risk-return trade-off of market-makers by reducing revenues from carrying inventory, while raising their exposure to interest rate movements. This will offset at least part of the supporting effect of ample bank funding.
On the structural side, in addition to the recent growth in electronic trading and non-bank intermediation (Chapter II), bank regulators are requiring key market-making institutions to strengthen their balance sheets and funding models. By preventing the build-up of excessive leverage and funding mismatches, the new regulatory framework aims at containing the risk that banks are forced to suddenly compress their balance sheets in response to adverse shocks, as was, for example, the case for US broker-dealers at the onset of the Great Financial Crisis.13 Such structural improvements also protect the financial system more broadly, by reducing the risk that liquidity crises and any associated "fire sales" spread contagiously across institutions and markets. This will support the robustness of market liquidity, though possibly at the cost of somewhat lower activity in normal times.14 That is, stronger market-makers make for more robust market liquidity.
Importantly, these developments are taking place just as demand for, and dependence on, market liquidity are on the rise. Asset managers' assets under management have been growing steadily in recent years (Graph VI.6, left-hand panel), signalling a large increase in the potential demand for liquidity. Funds that promise daily redemptions have been quite prominent, as suggested by the increasing presence of open-end mutual funds in corporate bond markets. In the United States, for example, they now hold some 22% of corporate debt according to financial accounts data - up from about 8% in 2005. Investors may thus find that liquidating positions proves more difficult than expected, particularly when market sentiment turns.15 An example is the May-July 2013 "taper tantrum" (Chapter II), when bond funds faced significant redemption pressures (Graph VI.6, right-hand panel).
What do these developments imply for regulation? A key point is that, regardless of regulatory constraints, market-makers will not be "catching a falling knife".16 That is, in transitioning to an environment that avoids unduly compressed liquidity premia, it is investors, not market-makers, who need to internalise the risk that liquidity will evaporate whenever everybody heads for the exits. For this, liquidity risk management needs to be up to the task. Market-based initiatives, such as liquidity stress tests and associated disclosures, are a vital tool. This should help market participants better understand each other's behaviour, which would also help inform their own responses. Regulatory measures can provide support, for example, by developing standardised disclosures or guidance for liquidity management.17
In addition, regulators may also want to more directly incentivise investors to better align their asset holdings and liquidity risks. One example is recent regulatory measures targeting open-end US mutual funds. The measures aim to address externalities (eg from fire sales) that may be arising from the redemption risks the industry faces.18 The new rules would require fund managers to hold a minimum amount of liquid assets that can be sold within three days to satisfy immediate liquidity needs, similar in spirit to the Basel III LCR requirement, along with a cap on illiquid assets. In addition, the new regulations would allow, but not require, implementation of "swing pricing" - a mechanism to pass on the trading costs associated with redemptions to those investors that are redeeming their positions in order to protect other investors from net asset value dilution. The feature is well known in Europe: asset managers operating under UCITS rules have been utilising variants of swing pricing for some time. Available disclosures, however, have generally been limited, making it difficult to reliably assess the effectiveness of the mechanism. Going forward, regulators will need to keep monitoring the impact of these measures on the mutual fund sector, while considering the implementation of similar requirements in other parts of the asset management industry, as needed.
1 For details, see BCBS, Basel III monitoring report, March 2016. The report also indicates that, on average, banks already maintain a Net Stable Funding Ratio (NSFR) above the minimum requirement, which is to become effective by 1 January 2018.
2 For a more detailed discussion, see C Borio, L Gambacorta and B Hofmann, "The influence of monetary policy on bank profitability", BIS Working Papers, no 514, October 2015.
3 For several large banks, legacy issues also include dealing with litigation related to past misconduct. For major UK banks, for example, supervisory fines and similar conduct costs were equivalent to some 3% of their equity between 2011 and 2015.
4 See C Borio, B Vale and G von Peter, "Resolving the financial crisis: are we heeding the lessons from the Nordics?", BIS Working Papers, no 311, June 2010.
5 See D Domanski, H S Shin and V Sushko, "The hunt for duration: not waving but drowning?", BIS Working Papers, no 519, October 2015.
6 See eg IMF, "Chapter 3: The insurance sector - trends and systemic risk implications", Global Financial Stability Report, April 2016.
7 BCBS, "Revised market risk framework and work programme for Basel Committee is endorsed by its governing body", press release, 11 January 2016.
8 As of 1 January 2022, all G-SIBs will be required to have eligible TLAC instruments equal to a minimum of at least 18% of their RWAs, not including any applicable regulatory capital buffers. TLAC will also need to be equivalent to at least 6.75% of the Basel III leverage ratio exposure measure. For more details, see Financial Stability Board, Summary of findings from the TLAC impact assessment studies, November 2015.
9 See eg S Cecchetti, "The jury is in", CEPR Policy Insights, no 76, December 2014.
10 TLAC is estimated to reduce crisis costs by 5.4 percentage points of GDP, whereas the probability of systemic crises is reduced by 26% relative to the LEI estimates. See BIS, Assessing the economic costs and benefits of TLAC implementation, November 2015.
11 International Association of Insurance Supervisors, First public consultation on global insurance capital standard, December 2014, and Annual Report 2013-14, September 2014.
12 See Committee on the Global Financial System, Market-making and proprietary trading: industry trends, drivers and policy implications, CGFS Papers, no 52, November 2014, and Fixed income market liquidity, CGFS Papers, no 55, January 2016.
13 See H S Shin, "Market liquidity and bank capital", speech given at the London Business School, 27 April 2016.
14 Empirical research on the impact of recent regulatory changes on market liquidity remains inconclusive. While J Dick-Nielson ("Dealer inventory and the cost of immediacy", paper presented at the Midwest Finance Association Annual Meeting, 2013) conjectures that recent regulatory adjustments may have raised transaction costs for US corporate bonds, F Trebbi and K Xiao ("Regulation and market liquidity", mimeo, 2016) find no evidence of negative effects from US regulatory action on US fixed income market liquidity.
15 For evidence on mutual fund fragility due to strategic complementarities among investors, see Q Chen, I Goldstein and W Jiang, "Payoff complementarities and financial fragility: evidence from mutual fund outflows", Journal of Financial Economics, vol 97, 2010, pp 239-62.
16 See I Fender and U Lewrick, "Shifting tides - market liquidity and market-making in fixed income instruments", BIS Quarterly Review, March 2015, pp 97-109.
17 See CGFS (2014, 2016), and FSB, Strengthening oversight and regulation of shadow banking, August 2013.
18 Securities and Exchange Commission, SEC proposes liquidity management rules for mutual funds and ETFs, 22 September 2015.