Calibrating the leverage ratio
The Basel III leverage ratio (LR) is designed to restrict the build-up of leverage in the banking sector and to backstop the existing risk-weighted capital requirements (RWRs) with a simple, non-risk-weighted measure. But how should a minimum LR requirement be set? This special feature presents a conceptual framework for the calibration of the LR, focusing on the LR's cyclical and structural dimensions as well as its consistency with the RWRs. It then applies the framework to historical bank data. Subject to various caveats, it finds that there is considerable room to raise the LR requirement above its original 3% "test" level, within a range of about 4-5%. Doing so should help to constrain banks' risk-taking earlier during financial booms, providing a consistent and more effective backstop to the RWRs.1
JEL classification: E44, E61, G28.
The Basel III framework is a central element of the post-crisis financial reform agenda. Developed by the Basel Committee on Banking Supervision (BCBS), the framework seeks to address the weaknesses of the international banking system as revealed by the 2007-09 Great Financial Crisis. These include insufficient loss-absorbing bank capital, unsustainable leverage and credit growth, and inadequate liquidity buffers.
The cornerstone of the Basel III framework is enhanced risk-weighted capital requirements (RWRs). Relative to pre-crisis regulations, the RWRs have been substantially tightened for all three of their components: the RWR numerator (ie the definition and quality of bank capital), the denominator (ie the computation of risk-weighted assets (RWA)), and the required capital ratio itself. Banks now have to: (i) comply with a minimum RWR of 4.5% Common Equity Tier 1 (CET1) capital to RWA; (ii) meet a 6% Tier 1 capital ratio (comprising a more broadly defined Tier 1 capital element as numerator); and (iii) maintain an additional capital conservation buffer of 2.5% (in terms of CET1 capital to RWA).2
Box 1
The Basel III leverage ratio: logic and design
The leverage ratio (LR) is defined as the ratio of Tier 1 capital (numerator) and an exposure measure (denominator). The latter is equal to the sum of the following items (BCBS (2014)):
- on-balance sheet exposures (eg loans);
- derivatives exposures at replacement cost (net of cash variation margin, meeting a set of strict eligibility criteria) plus an add-on for potential future exposure;
- exposures from securities financing transactions, with limited recognition of netting of cash receivables and cash payables with the same counterparty under strict criteria; and
- off-balance sheet items (eg standby letters of credit).
Given its broad scope and the fact that it does not try to account for the riskiness of assets, the LR ensures greater robustness of capital requirements against uncertainties and risks that are difficult to model within the risk-weighted framework. Its relative simplicity makes it easier for supervisors and market participants to understand and compare leverage across banks. That said, the LR does not provide information about banks' underlying risk profiles. This insensitivity to risk may incentivise banks to take on riskier positions. Risk-weighted capital requirements and the LR, therefore, are complements - and not substitutes - within the broader regulatory framework.
Several components of the Basel III framework serve to further raise the effectiveness of the RWRs. The leverage ratio (LR) requirement, in particular, is designed to restrict the build-up of leverage in the banking sector and to backstop the existing RWRs with a simple, non-risk-based measure. The LR is defined as Tier 1 capital divided by an exposure measure, which consists of the sum of all on-balance sheet exposures, derivatives positions, securities financing transactions and certain off-balance sheet items (Box 1).
In view of the instrument's novelty, the BCBS and national authorities started testing the LR at an initial minimum level of 3% from 1 January 2013 (the so-called parallel run). Banks began publicly disclosing their consolidated LRs on 1 January 2015. Final adjustments to the definition and calibration are scheduled to be carried out by 2017, with a view to establishing the LR as a Pillar 1 requirement on 1 January 2018 (BCBS (2014)).
This special feature examines a number of considerations for LR calibration. The next section presents a conceptual framework to help inform the calibration of the LR. In the second section, the framework is applied to historical bank data (from both publicly accessible and vendor sources) in order to derive a range of LR calibration benchmarks, which are then set against measures for the LR's impact on bank resilience and macroeconomic costs and benefits. The final section concludes.
A simple conceptual framework
Calibrating a minimum LR requirement involves several considerations: clarifying the LR's objectives; choosing a calibration consistent with the notion of it being a backstop to the RWRs; and assessing the costs and benefits of different calibrations. In what follows, each of these is discussed in turn.
Objectives
The LR's main objective is to prevent damage to the financial system and the economy by containing build-ups of leverage in the banking sector that could ultimately result in destabilising deleveraging spirals (BCBS (2014)). While the RWRs are also designed to contain leverage, the models used to generate the risk weights may understate risk. That is, measured risks tend to become artificially compressed in times when credit spreads are tight, defaults are rare and volatility is low. In addition, models may provide incentives for "gaming" (ie by making assumptions that are hard to verify and result in artificially low risk weights (see eg Behn et al (2014)).
Hence, LR calibration should consider two dimensions: (i) a cyclical (or time series) dimension, suggesting that a minimum LR requirement should backstop (ie provide insurance against) declines in measured RWA during financial booms; and (ii) a cross-sectional (or structural) dimension, based on the idea that the LR can provide additional benefits to RWRs in terms of bank resilience. Both dimensions, in turn, suggest that consistency with the RWRs should be a central building block of LR calibration.
Consistency
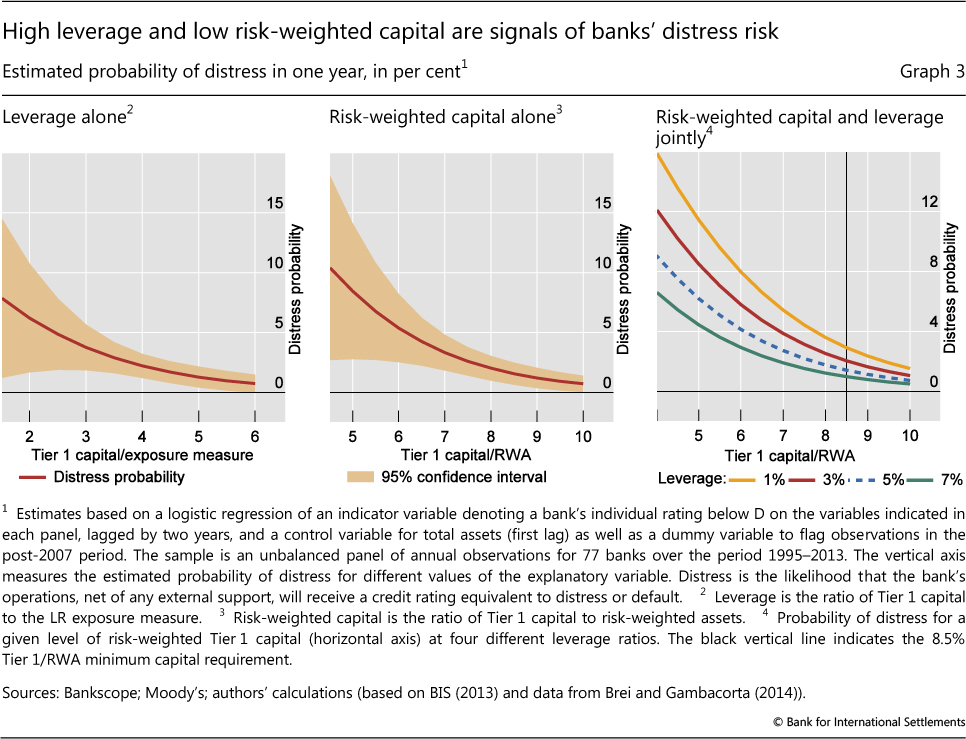
A helpful concept in calibrating the LR in a manner consistent with the existing RWRs (ie by taking possible interactions into account) is the "RWA density" or "density ratio" (DR), defined as the ratio of RWA to the LR exposure measure (EXPLR; see Box 1). The DR denotes the average risk weight per unit of exposure for any given bank or banking system. The relationship between the LR and the DR can be obtained by expanding the LR definition as follows:
The LR can thus be expressed as the product of the risk-weighted Tier 1 capital ratio (ie T1/RWA) and the DR. The relationship can help inform the calibration of a consistent minimum LR requirement, in terms of both its cyclical and its cross-sectional dimensions.
A necessary condition for the minimum LR requirement to be a cyclical backstop to the RWRs is that banks' leverage expands more strongly during a financial boom than the corresponding increase in RWA. Indeed, empirical evidence (Brei and Gambacorta (2014)) suggests that, after controlling for other factors, EXPLR co-moves with various proxies of the economic cycle. Moreover, the cyclicality in the EXPLR measure is more pronounced than the one found for RWA. As a result, entering into a boom, observed DRs across banks will tend to fall and LRs will decline for any given T1/RWA. A minimum LR, therefore, becomes more likely to constrain banks' risk-taking. This is consistent with the idea of the LR restricting the build-up of risks during cyclical upswings, safeguarding against the tendency of the RWRs to insufficiently limit such build-ups. On this basis, calibrating the LR requires the DR to be set at a level consistent with a cyclically adjusted value of RWA/EXPLR, as explained in more detail in the next section.3
The above equation also shows how the LR and the RWRs complement each other from a cross-sectional point of view. If, all else equal, a bank's risk models underestimate its risk weights, this will bias the Tier 1 capital ratio upwards. Yet, at the same time, the DR is biased downwards, making a minimum LR requirement relatively more constraining.4 Conversely, for a given LR requirement, a bank with a relatively low DR will have an incentive to shift its balance sheet towards riskier assets to earn more income - a type of behaviour that the RWRs would constrain. This suggests that banks' risk-weighted capital ratios and the LR provide complementary information when banks' resilience is assessed.
Selecting a consistent LR benchmark requires the relevant backstop concept to be defined. There are two main alternatives.
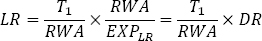
The first approach is to calibrate the LR so that it is the binding constraint on a given average share of banks at any given point in time. Accordingly, calibrating the LR involves choosing the share of banks that, on average, would have been bound by the minimum LR requirement (subject to the RWR being met), based on historical data. The area shaded in dark blue in Graph 1 illustrates combinations of the LR and RWRs for which this is the case. A target share of 50% would imply that, over a full cycle, about half the banks of a given sample are bound by the LR. The share would then rise (fall) as the economy strengthens (weakens), counteracting the corresponding increase (decrease) in banks' incentives to increase risk-taking and leverage. That is, a 50% target is the highest share that is still consistent with the concept of the LR serving as a backstop for the RWRs.
An alternative approach is to calibrate the LR so that it is more constraining than the RWRs for a given target share of banks. For any target percentage, this - less stringent - criterion would result in a lower minimum requirement because the LR can be relatively more constraining even if it is not binding, capturing a larger share of banks. Whether the LR is constraining depends on how a bank's DR compares with the threshold DR (or "critical" average risk weight) implied by combining the minimum RWR and LR requirements (Bank of England (2014)). For the current "test" level, with the minimum LR requirement set at 3% and Tier 1 RWR at 8.5%, the threshold DR is equal to about 35% (3% divided by 8.5%, as per the above equation). A bank with a DR below this threshold would find itself relatively more constrained by the LR (see Bank A, which is located below the line implied by the threshold DR; Graph 1). This means that the amount of capital it needs to hold due to the minimum LR requirement is higher than the amount due to the minimum RWR. By comparison, a bank with a DR above the threshold DR would be more constrained by the RWR (see Bank B, Graph 1). Again, target shares of up to 50% would be consistent with the backstop concept underpinning the LR.
Costs and benefits
Having operationalised the backstop concept, the next step is to evaluate the costs and benefits of introducing alternative minimum LR requirements. The BCBS's long-term economic impact (LEI) assessment provides a suitable framework. This study, conducted in 2010, evaluates the macroeconomic impact of higher bank capital requirements (BCBS (2010); see Box 2 for details).
On this basis, the cost-benefit analysis comprises three main elements: an estimate of the increase in capital associated with different levels of the LR (the implied "capital shortfall"); the benefits in the form of lower (expected) crisis costs, equal to the reduction in the crisis probability times costs; and the expected output loss which might result from higher lending spreads.
Deriving benchmarks for the leverage ratio
This section starts with a brief description of the data set. Next, different LR benchmarks are presented, applying the conceptual framework discussed above. The section concludes by illustrating the costs and benefits associated with a minimum LR set within the range implied by these benchmarks.
Data
A challenge for LR calibration is the lack of consistent historical time series on RWA and the exposure measure across countries and over time. To overcome this problem, the analysis presented below draws on data compiled by Brei and Gambacorta (2014), who combine information from the Bankscope vendor database with aggregate data based on the BCBS's Quantitative Impact Study (QIS).
Specifically, the QIS data are employed to generate a set of country-level scaling factors that, combined with Bankscope data, are used to calculate proxies for the LR's exposure measure for a sample of more than 100 banks from 14 advanced economies covering mainly the period from 1995 to 2012.5 The re-scaled series are then grouped across banks by country and across four different regions (Asia-Pacific, euro area, North America, Other Europe). These are combined with the corresponding measures of RWA for the same set of banks to generate the calibration benchmarks described below.6
Box 2
The long-term economic impact of stronger capital and liquidity requirements
A useful template for an analysis of the macroeconomic costs and benefits of the new leverage ratio (LR) requirement is the BCBS's 2010 long-term economic impact (LEI) report, which investigates the impact of the core Basel III capital and liquidity requirements.
The LEI methodology separates the assessment into two steps by: (i) assessing the expected benefits of higher capital requirements in the new steady state, specifically the reduction in the expected output losses from systemic crises; and (ii) comparing this with the expected costs of higher capital requirements in terms of forgone output. In deriving these estimates, the LEI adopts an explicitly conservative approach - making assumptions that tend to raise cost estimates and downplay expected benefits, introducing a downward bias into the estimates of expected net benefits. The key finding is that even large increases in bank capital requirements from their pre-crisis levels are unlikely to result in macroeconomic costs that outweigh the associated benefits in terms of reduced crisis costs.
Expected benefits. Conceptually, the expected benefits are based on multiplying the probability of systemic financial crises, given different minimum capital ratios, by the expected macroeconomic costs of such crises should they occur. To derive a link between crisis probabilities and different capitalisation levels, the LEI uses a range of probit models as well as portfolio credit risk analyses that treat the banking system as a portfolio of banks. Averaging the results from these models, it then derives a schedule with diminishing marginal returns (ie the extra effect of additional capital declines as the capital level increases). Later studies broadly confirm these results (eg Junge and Kugler (2013)).
Crisis cost estimates, in turn, are derived from academic studies of historical crisis experiences. The LEI study found that the median cost of systemic banking crises in these studies is 63% of GDP in net present value terms. But the variation in these cost estimates is large, and later studies have generated both higher and lower estimates (see Romer and Romer (2015) for an example at the lower end). A shortcoming of these studies of the cost of financial crises is that they rely only on pre-2007 data, missing the impact of the most recent crisis episode. An exception is Haldane (2010), who estimates the present value of output losses from the recent crisis to be between 90 and 350% of world GDP, depending on the strength of permanent effects. More recently, Ball (2014) confirms these results, with estimates implying that the weighted average cumulative loss across all OECD countries amounts to about 180% of pre-crisis GDP. Ball also finds that the growth rate in potential output has declined by 0.7 percentage points per year since the crisis and that, so far, there has been no reversal. If this decline in potential output is permanent, this would significantly increase potential crisis costs and would strengthen the case for action to prevent them.
Expected costs. If higher bank capital requirements raise banks' costs, banks may respond by raising their lending spreads to counterbalance the decline in their return-on-equity (RoE). As a result, real economy borrowing costs may rise, translating into lower investment and equilibrium output. To estimate the magnitude of this effect in the long run, the LEI assumes that banks maintain a constant RoE by passing on to their customers all additional costs that are due to higher capital requirements. The estimated increase in lending spreads is then fed into a variety of macroeconomic models (that is, the dynamic structural general equilibrium models and semi-structural and reduced form models in use at participating central banks) to assess the resulting impact on GDP.
The headline result of this exercise is that a 1 percentage point increase in the CET1/RWA ratio translates into a 0.12% median decline in the level of output relative to its baseline (with the corresponding value for the liquidity requirements being a one-off 0.08% decline in the output level). In addition, a companion study (BIS (2010)) found that the macroeconomic impact of the transition to higher capital requirements was expected to be limited. By design, these results are likely to overstate the true costs, given the underlying assumption that the Modigliani-Miller theorem
 is violated even in the long run and that the cost of issuing equity does not change with capital levels. In fact, banks' required RoE can be expected to decline as their balance sheet leverage and the riskiness of their equity fall.
For more details, see BCBS (2010). The original result of 0.09% is stated in terms of tangible common equity over Basel II RWA, which corresponds to about 0.12% in terms of CET1/RWA given our estimated conversion factor of about 0.78. The Modigliani-Miller theorem states that, under certain assumptions (such as the absence of taxes, bankruptcy costs, agency costs and asymmetric information), the value of a firm is unaffected by how that firm is financed (Modigliani and Miller (1958)).
Applying the conceptual framework
Cyclical dimension: leverage over time
As discussed in the previous section, calibrating the LR to backstop the RWRs implies a close link between both regulatory requirements. Specifically, to ensure consistency, the minimum LR requirement needs to be set at a level that is commensurate with both the Basel III minimum Tier 1 capital target ratio of 8.5% and through-the-cycle values of the DR.7
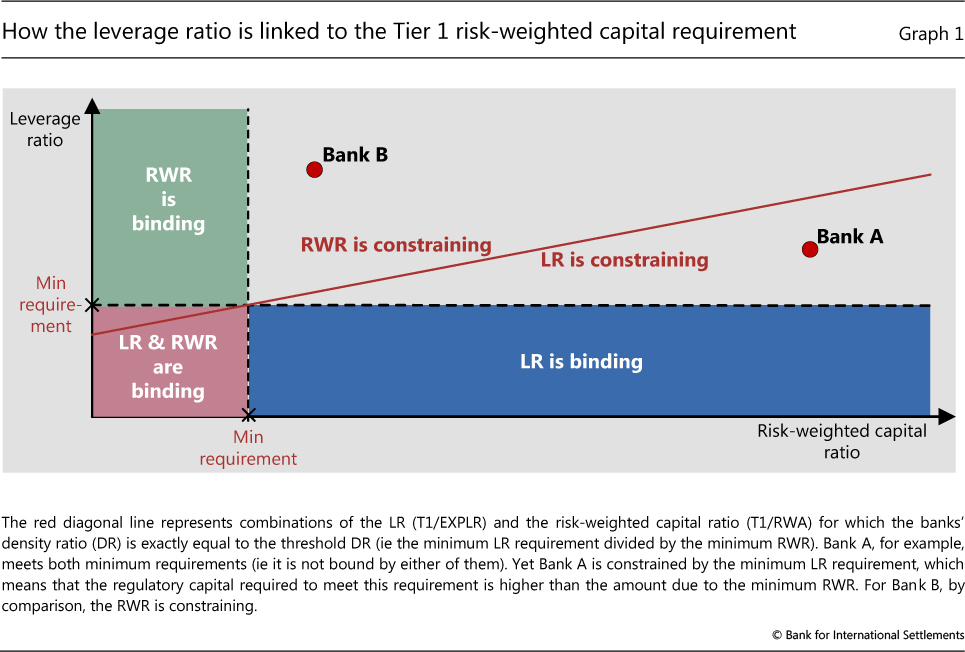
As a preliminary step, to provide a sense of the range of possible minimum LR requirements, Graph 2 portrays scaled DRs (ie values for RWA/EXPLR multiplied by the Tier 1 capital target ratio of 8.5%). The series indicate, for different points in time (Graph 2, left-hand panel) and geographical regions (centre panel), the LR value under the assumption that banks are operating at the Tier 1 RWR of 8.5%.
As expected, the values of these aggregates vary, across both time and regions. Overall, there appears to be a broadly declining trend, particularly for the larger banks, reflecting the pre-crisis boom as well as post-crisis business model adjustments and regulatory responses. In particular, many banks shifted their balance sheets towards assets with lower risk weights during and after the Great Financial Crisis (see eg BIS (2013)). As a result, scaled DRs are generally lower at the end of the sample than at the start. This would tend to skew analyses based only on the current low observations in the direction of low minimum LR requirements.
Median values by region (based on annual cross-sectional averages) range from around 3.7% (for Other Europe) to about 5.0% (for Asia-Pacific) for the full sample; whereas the most recent observations are equal or close to the minimum values observed over the full period (1995-2012). Country-level data show similar patterns (not pictured), with the cross-country average at 3.9% for 1995-2012 and 4.2% for 1995-2007.
Hence, across regions and time, a Tier 1 RWR of 8.5% has historically been consistent with scaled DRs in a range of about 4-5%. This is true in the aggregate (red line in the left-hand panel of Graph 2) as well as across regions (the median values in the centre panel) and countries. Interpreting these results as through-the-cycle values provides a set of calibration benchmarks for the LR, given the framework discussed above.
Backstop concepts
What does this imply for the two backstop concepts (ie whether the minimum LR requirement should, on average, be a binding or a constraining factor for banks' asset allocation decisions)? Graph 2 (right-hand panel) illustrates the results, based on the historical data described above.
The graph suggests that, at 3% - the current "test" level - the percentage of banks for which the LR would have been binding is rather low. Specifically, the ratio would have been binding for less than 15% of the bank-year observations (111 banks from 1995 to 2012) for banks meeting an 8.5% Tier 1 RWR (ie banks located in the blue-shaded area in Graph 1), and constraining for less than 25% (ie banks located below the red diagonal line in Graph 1; see Bank A).
For comparison, raising the LR to a minimum level of 4% would have resulted in the LR becoming a binding constraint for about 30% of the observations, while it would have constrained banks about 45% of the time. Setting an LR at 4.5%, ie towards the centre of the range implied by the historical data, raises these figures to about 45% and 55%, respectively. That is, calibration at these levels would have, from a historical perspective, resulted in the LR becoming as equally constraining a requirement on average as the RWR.
While this is technically at the top of the target range that still qualifies as a backstop, note that these are conservative numbers. The share of bound banks is biased upwards, because most of the banks in the sample did not face an LR constraint during the period of observation. This will have skewed their business models in the direction of operating with a lower LR (ie a more leveraged balance sheet). Indeed, as suggested by end-2014 data (BCBS (2015)), a 3% minimum LR requirement would have been binding for only about 5% of the banks monitored by the BCBS, ie about one third of the 15% implied by using the historical data. Given the adjustments in bank capital levels since the crisis, any given minimum LR requirement has become less likely to bind. This suggests that a calibration aimed at binding or constraining a certain percentage of banks on average would need to set a minimum LR requirement above the values implied by historical observations.
Cross-sectional dimension: leverage and bank distress
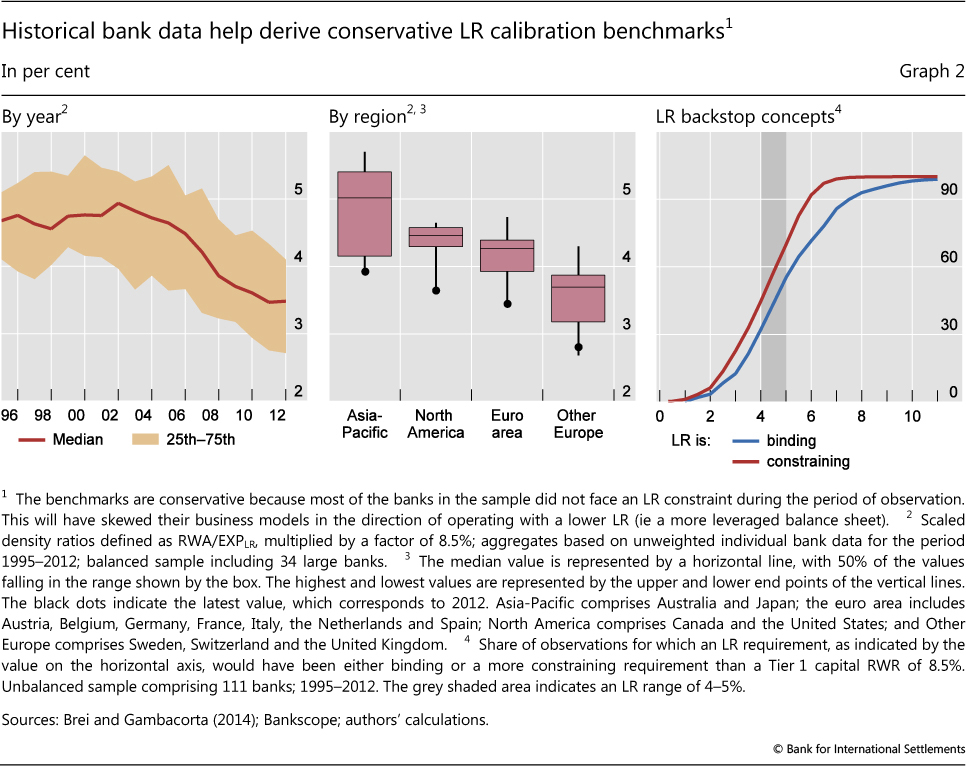
Calibration should also be informed by any additional benefits in terms of improved bank resilience that result from the LR. One way to include this cross-sectional dimension in LR calibration is to study the combined marginal predictive power of the RWRs and a corresponding minimum LR requirement for bank distress (BIS (2013)). Graph 3, which is based on a simple set of logistic regressions run on the bank data set described above, indicates how a low LR is associated with the likelihood that the bank will be facing distress within two years. An increase in the ratio from, for example, 3% to 5% lowers the likelihood of distress from about 3.8% to below 1.3% (red line, left-hand panel). By comparison, an increase in Tier 1 capital/RWA from 8.5% to 10% reduces the estimated probability of distress from about 1.6% to less than 1% (red line, centre panel).
Importantly, the signals produced by the two ratios are complementary (Graph 3, right-hand panel). In particular, if both ratios are low, this provides a stronger signal of future distress than would each ratio considered separately. Thus, a possible strategy for LR calibration is to set an objective in terms of distress probabilities and then estimate the LR that would have achieved this level of safety for a given RWR (eg a Tier 1/RWA ratio of 8.5%), based on historical data.
For the banks included in the data set available for this analysis, increasing the minimum LR requirement from 3% to 5% (ie to the upper end of the range provided above) is estimated to reduce banks' distress probability from about 2% to 1.4%. This implies that choosing a more conservative approach to LR calibration (ie targeting a higher share of bound or constrained banks) is likely to provide additional benefits in terms of bank resilience - an argument in favour of a calibration level at the higher end of the historically implied calibration range.
Macroeconomic impact: cost-benefit analysis
The third part of this section applies the BCBS's LEI framework (Box 2) to evaluate the costs and benefits of the LR and to provide a complementary calibration benchmark. The analysis presented here adds to the original LEI assessment by: (i) incorporating the recent academic literature; and (ii) accounting for the costs and benefits associated with the extra cushion of capital added via alternative minimum LR requirements.
Before starting the assessment, two effects of the Basel III reforms need to be taken into account. The first is the change in the definitions and calculation of capital and RWA. Specifically, all LEI estimates, which are based on a measure of tangible common equity (TCE) to RWA under the then prevailing definitions, need to be transformed into the new CET1/RWA metric. The second effect is the increase in minimum capital ratios due to more stringent RWRs. These new requirements suggest that the analysis should start from the assumption that banks meet a minimum CET1/RWA ratio of 7% (including the capital conservation buffer) under the Basel III rules (corresponding to Basel II TCE/RWA levels of about 9%).8
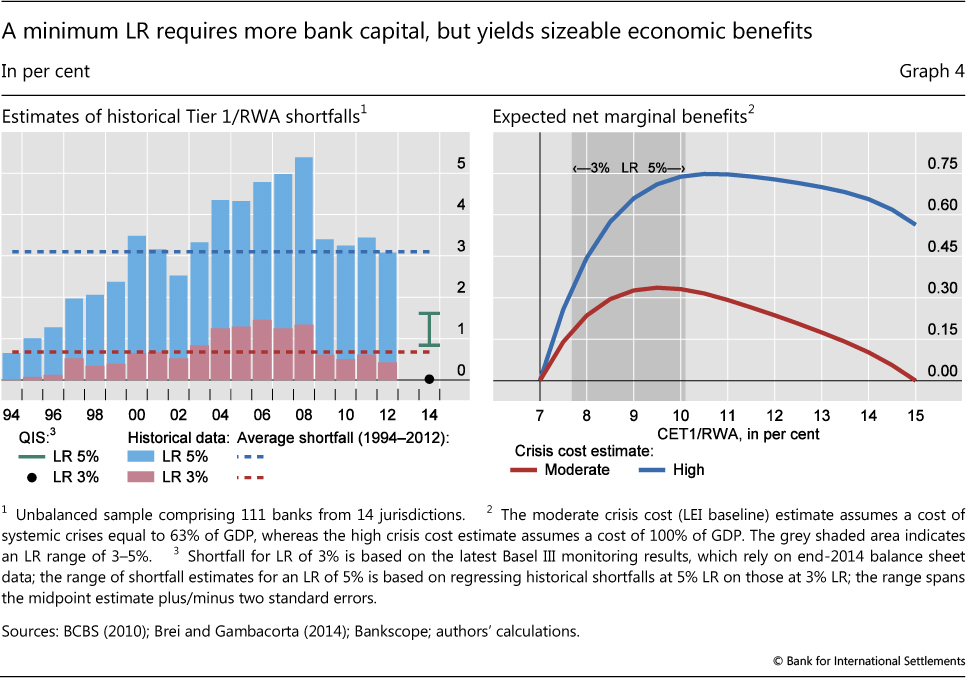
Next, as discussed in the previous section, an estimate of the implied capital shortfall for any given LR is derived. This is measured as the average supplementary Tier 1 capital (in proportion to RWA) that would have been required to meet different LR requirements (Table 1, line 1; Graph 4, left-hand panel) in the bank data sample used above. A minimum requirement of 3%, for example, would have, on average over the sample period, required extra Tier 1 capital holdings of 68 basis points of RWA. An LR of 5%, in turn, would have required AT1 capital worth about 3 percentage points of RWA.9 To facilitate the mapping of these estimates into the LEI framework, the conservative assumption is made that banks meet any capital shortfall with CET1 capital, rather than relying on typically less costly AT1 capital instruments.
The next element is the reduction in the crisis probability due to higher levels of capital. The associated estimates are based on the LEI schedule, which provides a mapping of capital levels onto crisis probabilities. For the starting capital ratio of 7% CET1/RWA (see above), the LEI schedule estimates a 1.6% probability of a systemic banking crisis, after taking the effects of the Net Stable Funding Ratio (NSFR) into account. The amount of reduction, given the expected increase in capital, follows from Table 1, line 2.1.
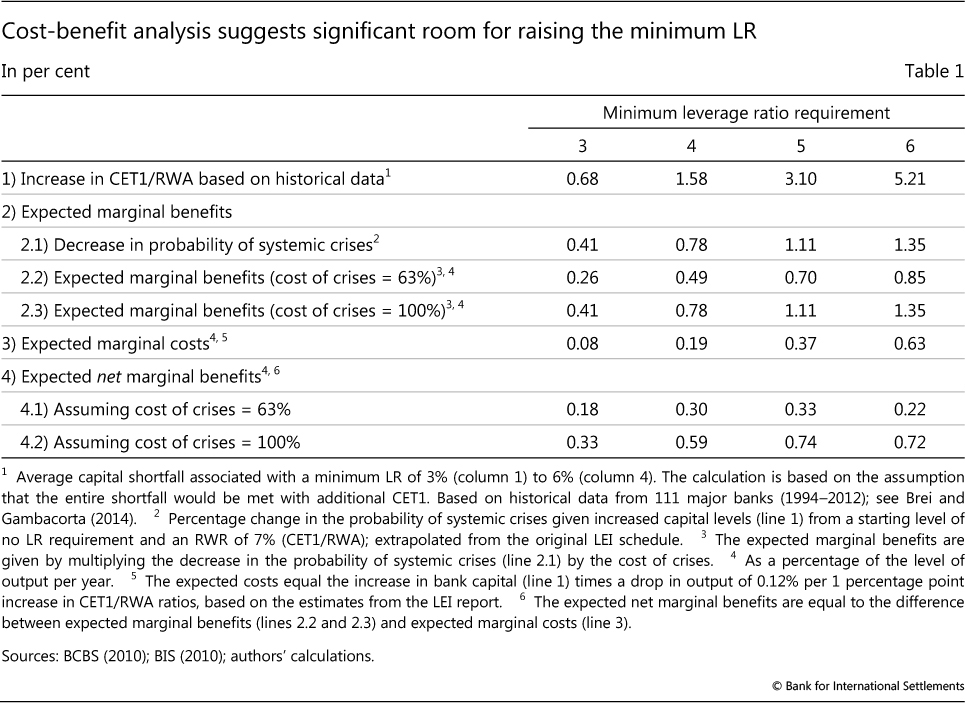
The costs of systemic crises represent another key element of the analysis. An important insight from the relevant literature is that the cumulative output losses of a crisis are large, but that estimates can vary significantly across different studies and data sets. Most of these studies, however, do not include the most recent, especially costly, crisis. Any update would be likely to increase crisis costs, in the direction of cumulative losses of around 100% of GDP in net present value terms (Box 2).10 In what follows, estimates of both 63% (ie the original LEI estimate of the median cost of a systemic banking crisis) and 100% of GDP are used as alternative (moderate/high crisis costs) benchmark values.
To evaluate the expected marginal benefits (Table 1, lines 2.2 and 2.3), the reduction in the crisis probability that results from raising capital to meet the LR is multiplied by the cost of crises, using the 63% and 100% estimates, respectively.
The final element of the analysis is an estimate of output costs from higher LR requirements due to any implied changes in lending spreads (Table 1, line 3). Specifically, the LEI report suggests a 0.12% loss in the level of output per percentage point increase in the required CET1/RWA ratio (Box 2).
In terms of calculations, the expected marginal costs result from combining the estimated increase in capital with the estimated output loss. This yields two sets of net benefit schedules based on alternative crisis cost estimates (Table 1, lines 4.1 and 4.2; Graph 4, right-hand panel). On this basis, the net economic benefits (measured by the impact on the level of output per year) of higher capital requirements are exhausted only after a very substantial increase from the baseline level of 7% of the CET1/RWA ratio - even if one uses the lower pre-crisis estimate of the cost of a financial crisis.
Overall, despite rising amounts of required additional capital, estimated net marginal benefits remain positive for the full range of alternative LR calibrations. This result is consistent with the calculations presented in Graph 4, suggesting considerable room for calibrating the LR towards the upper range of the benchmarks derived above.
In addition, as mentioned before, these figures are likely to overestimate any LR-implied impact for several reasons.
First, the sample data overstate the capital shortfall, because they cannot account for any adjustment in balance sheets that would have resulted from imposing an LR requirement at the time. The latest QIS data suggest, for example, that large internationally active banks, on average, had an LR of 5% as of end-2014, while for smaller banks the average was 5.3%.11 Only 10 of the nearly 200 banks monitored by the BCBS would not have met a fully phased-in minimum Basel III LR of 3%. These banks reported an aggregate shortfall of €7.4 billion. This shortfall amounted to less than 3 basis points of total RWA of the banks monitored by the BCBS, which is significantly less than the 68 basis points implied by the data used in the analysis presented above (Graph 4, left-hand panel).
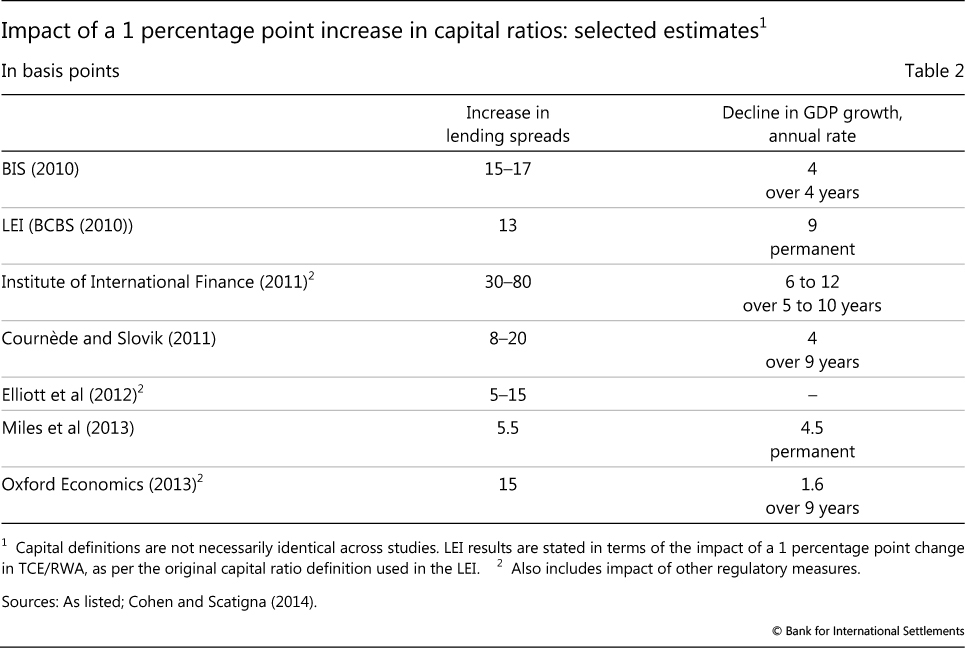
Second, the LEI's cost estimates are (intentionally) biased upwards because they do not take into account that higher capital ratios will - over time - tend to reduce banks' funding costs (Box 2). Indeed, more recent studies confirm the conservative nature of the LEI estimate, which - if anything - looks more conservative now than it did back in 2010 (Table 2). With one exception, all of the analyses reviewed in Table 1 point to a decline in economic growth that is lower, often substantially so, than the one resulting from the LEI approach.12 For example, Miles et al (2012), who seek to take the effects of reduced funding costs given enhanced capitalisation into account, find that a 1 percentage point increase in capital ratios reduces long-run GDP by less than 0.05%.
Third, the impact on lending and GDP need not be negative. An empirical analysis of German bank data by Buch and Prieto (2014) finds a positive long-term relationship between bank capital and loan volume, suggesting that higher capitalisation levels tend to have no negative effect on spreads and output in the long run. Similar effects are found in Gambacorta and Shin (2015), based on a broad set of internationally active banks.
Finally, given its cyclical features, the minimum LR requirement will tend to bind when profits are ample and raising equity is comparatively cheap. This should further reduce any costs, once the requirement has been fully phased in.
Conclusions
The final calibration of the Basel III minimum LR requirement by the BCBS is likely to need to take account of a variety of factors. An important one, as highlighted in the above analysis, is consistency with the existing RWRs. Given the risk-weighted Tier 1 requirement of 8.5%, therefore, the LR can be benchmarked against historically observed bank DRs.
Subject to various caveats (such as data quality and comparability across countries) and methodological constraints, scaled DRs are consistent, over the medium term, with a minimum LR requirement above the current "test" level of 3%, within a range of about 4-5%.
Thus, taking account of the implied conservative bias from using historical data (relative to the most recent BCBS monitoring results) as well as additional gains in terms of improved bank resilience and estimated net macroeconomic benefits, the analysis presented above suggests considerable room for manoeuvre in terms of higher LR calibrations - in particular for global systemically important banks (G-SIBs), where additional capital requirements are likely to reduce the risk of systemic crises most.
References
Ball, L (2014): "Long-term damage from the great recession in OECD countries", European Journal of Economics and Economic Policies, vol 11(2), pp 149-60.
Bank for International Settlements (2010): Assessing the macroeconomic impact of the transition to stronger capital and liquidity environments, Final Report, Macroeconomic Assessment Group, December.
--- (2013): 83rd Annual Report, Chapter V, June.
Bank of England (2014): The Financial Policy Committee's review of the leverage ratio, October.
Basel Committee on Banking Supervision (2010): An assessment of the long-term economic impact of stronger capital and liquidity requirements, August.
--- (2011): Basel III: A global regulatory framework for more resilient banks and banking systems, revised version, June.
--- (2013): The regulatory framework: balancing risk sensitivity, simplicity and comparability, July.
--- (2014): Basel III leverage ratio framework and disclosure requirements, January.
--- (2015): Basel III Monitoring Report, September.
Behn, M, R Haselmann and V Vig (2014): "The limits of model-based regulation", mimeo, August.
Brei, M and L Gambacorta (2014): "The leverage ratio over the cycle", BIS Working Papers, no 471, November.
Buch, C and E Prieto (2014): "Do better capitalized banks lend less? Long-run panel evidence from Germany", International Finance, vol 17(1), pp 1-23.
Cohen, B and M Scatigna (2014): "Banks and capital requirements: channels of adjustment", BIS Working Papers, no 443, March.
Cournède, B and P Slovik (2011): "Macroeconomic impact of Basel III", OECD Economics Department Working Papers, no 844, February.
Elliott, D, S Salloy and A Oliveira Santos (2012): "Assessing the cost of financial regulation", International Monetary Fund Working Papers, no WP/12/233, September.
Fraisse, H, M Lé and D Thesmar (2015): "The real effect of bank capital requirements", Débats économiques et financiers, no 8, Autorité de Contrôle Prudentiel et de Résolution, August.
Gambacorta, L and H S Shin (2015): "On book equity: why it matters for monetary policy", mimeo.
Haldane, A (2010): "The $100 billion question", speech at the Institute of Regulation & Risk, North Asia (IRRNA), Hong Kong, 30 March.
Institute of International Finance (2011): The cumulative impact on the global economy of changes in the financial regulatory framework, September.
Junge, G and P Kugler (2013): "Quantifying the impact of higher capital requirements on the Swiss economy", Swiss Journal of Economics and Statistics, vol 149(3), pp 313-56.
Laeven, L and F Valencia (2012): "Systemic banking crises database: an update", IMF Working Papers, no WP/12/163, June.
Mesonnier, J-P and A Monks (2015): "Did the EBA capital exercise cause a credit crunch in the euro area?", International Journal of Central Banking, vol 11(3), pp 75-117.
Miles, D, J Yang and G Marcheggiano (2013): "Optimal bank capital", Economic Journal, vol 123(567), pp 1-37.
Modigliani, F and M Miller (1958): "The cost of capital, corporation finance and the theory of investment", American Economic Review, vol 48(3), pp 261-97.
Oxford Economics (2013): Analyzing the impact of bank capital and liquidity regulations on US economic growth, The Clearing House Association, April.
Romer, C and D Romer (2015): "New evidence on the impact of financial crises in advanced countries", NBER Working Papers, no 21021, March.
1 The views expressed in this article are those of the authors and do not necessarily reflect those of the BIS or the BCBS. We are grateful to Mathias Drehmann and Kostas Tsatsaronis for analytical inputs and to Michael Brei and Leonardo Gambacorta for sharing their data. We also gratefully acknowledge comments by Fernando Avalos, Claudio Borio, Ben Cohen, Michela Scatigna and Hyun Song Shin as well as expert research assistance by Jörg Urban and José María Vidal Pastor.
2 Tier 1 capital consists of CET1 capital and Additional Tier 1 (AT1) instruments such as contingent convertible bonds. For further information on the Basel III capital requirements as well as on other parts of the enhanced framework, see BCBS (2011) and BIS (2013).
3 An additional LR requirement could be added for global systemically important banks (G-SIBs) so as to align the total LR requirement with the RWR established by the G-SIB capital surcharge. Not adding such an LR surcharge for G-SIBs would make the LR relatively less likely to bind for G-SIBs than for other banks, given the higher Tier 1 capital requirement that results from the G-SIB surcharge. See BCBS (2013).
4 Other components, such as risk-weight floors, also guard against an underestimation of risks by internal models-based calculations.
5 The adjustment is necessary because Bankscope data do not have the granularity that would be required to construct LR exposure measures directly - especially in the context of the treatment of reverse repos and cash collateral, derivatives exposures, securities financing transactions and certain off-balance sheet items.
6 For more detail on the data set, see Brei and Gambacorta (2014), especially Appendix A.
7 The assumed RWR level of 8.5% reflects the sum of the Tier 1 capital requirement of 6% and the capital conservation buffer of 2.5% (which has to be met in terms of CET1 capital).
8 For the purposes of this study, we estimate that the conversion factor for the transition from Basel II to Basel III capital ratios is about 0.78, with CET1/RWA (Basel III) ≈ 0.78 * TCE/RWA (LEI).
9 The numbers are higher, and thus more conservative, than those implied by the latest Basel III monitoring results, which are based on end-2014 data; see Graph 4, left-hand panel.
10 In the widely used data set of Laeven and Valencia (2012), around 25% of the crisis observations relate to the most recent episode. Hence, assuming cumulative output losses of the recent crisis at 200% (the average of the Haldane (2010) and Ball (2014) estimates) and losses from previous crises of 63% (in line with the original LEI) gives a back-of-the-envelope estimate of about a 100% weighted average loss of output per crisis. This figure refers to the net present value of the cumulative loss in output, allowing for the possibility that banking crises have a permanent effect on the level of GDP (ie crises may induce a downward shift in the growth path). For more information on the methodology, see BCBS (2010), in particular Annex 1.
11 See BCBS (2015). The BCBS distinguishes between "Group 1" banks, which have Tier 1 capital of more than €3 billion and are internationally active, and "Group 2" banks, namely all other institutions that submit data for the monitoring exercise. According to the BCBS, "Group 1" covers most large, internationally active banks, but the "Group 2" sample is not necessarily representative of the worldwide population of banks that are not internationally active.
12 Studies finding stronger effects than those estimated by the LEI typically focus on shorter-term, transitional adjustments and not those associated with a new steady state. See eg Mesonnier and Monks (2015) and Fraisse et al (2015).