Risks related to EME corporate balance sheets: the role of leverage and currency mismatch
Corporates in many EMEs have taken advantage of unusually easy global financial conditions to ramp up their overseas borrowing and leverage. This could expose them to increased interest rate and currency risks unless these positions are adequately hedged. The key question is whether EME corporate balance sheets have become more susceptible to shocks. Greater corporate exposures could, in turn, spill over into vulnerabilities for both local banks and the financial system more broadly. Shocks to interest or exchange rates could generate damaging feedback loops if credit risk concerns were to prevent existing bank or bond market funding from being rolled over.1
JEL classification: D21, F31, G32.
Very low yields in advanced countries post-crisis have triggered huge investment flows into emerging market economies (EMEs), thanks to their brighter growth prospects. While these capital inflows have brought economic benefits, they could make EMEs more vulnerable to external shocks if unchecked surges in credit and asset prices were to raise the spectre of renewed boom-bust cycles (BIS (2014), Chapter IV). Events in May 2013 and early 2014, for example, suggest that large cross-border capital movements could cause considerable volatility in EME asset prices and exchange rates, with implications for growth and financial stability (see eg Avdjiev and Takáts (2014)).
In this environment, the financial exposures of EME non-financial corporations, in particular, could have wider implications. Debt issuance in foreign currencies exposes these borrowers to rollover and foreign currency risks. If such risks materialise, the creditworthiness of some corporations could worsen, pushing up bond yields. Higher financing costs and tighter funding conditions for firms could then become a drag on economic growth. Higher bond yields would also inflict losses on holders of EME corporate debt, which include local banks and other investors, such as global asset managers. Balance sheet pressure on corporations could also subject banks and other intermediaries to funding stresses, as firms are forced to withdraw their deposits. All in all, such developments could generate powerful feedback loops in response to exchange rate shocks if credit risk concerns mean that existing bank or bond market funding is not rolled over.
Against this background, this article examines the risks related to EME corporate balance sheets and their possible implications for the broader financial system. To set the scene, the first section below reviews recent patterns in corporate non-financial sector borrowing and the rising importance of cross-border financing flows for EME corporates. On this basis, the second section then asks whether corporate balance sheets have become more vulnerable. The third section discusses the possible financial stability implications, followed by a short conclusion.
Recent patterns in corporate non-financial sector borrowing
In recent years, EME non-financial corporations have seen growing incentives and opportunities to increase leverage, by borrowing in both foreign and domestic currencies. The drivers include low interest rates and compressed term premia, broad appreciation trends underpinning key emerging market currencies post-crisis, and better access for EME borrowers to international markets.2
Developments in cross-border credit are particularly noteworthy. Although bank claims still account for the largest share of outstanding cross-border credit for the private non-bank sector (Graph 1, left-hand panel), a key feature of the past few years has been the strong growth of international debt issuance by non-financial sector corporates (Graph 1, centre panel). This stands in contrast to the pre-crisis period (see eg Shin (2013)).
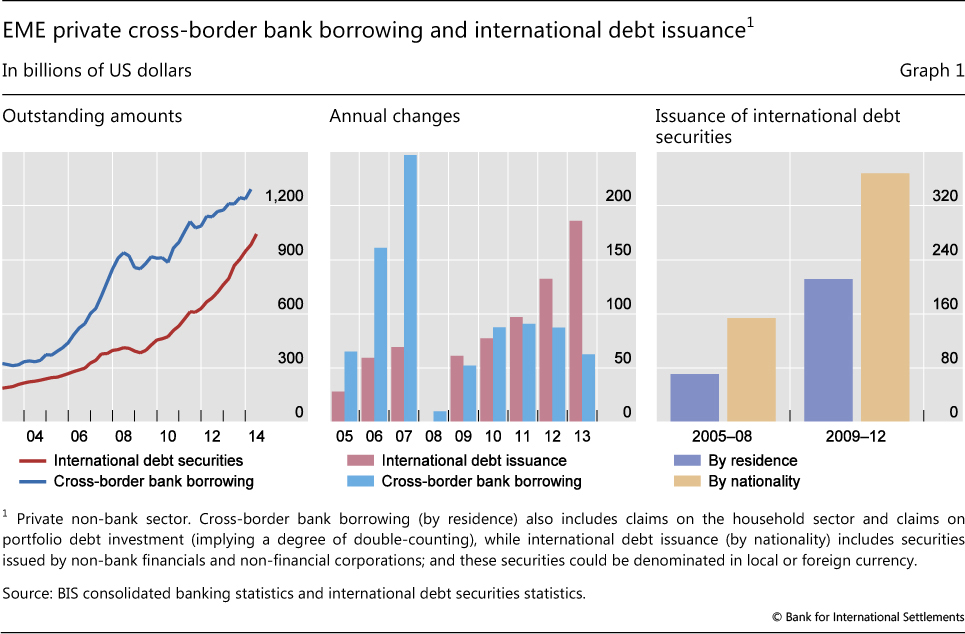
In aggregate, a significant part of the international debt of these EME corporates is issued through their overseas subsidiaries (Graph 1, right-hand panel). Issuance data based on issuer nationality (including issuance by the overseas subsidiaries of the corporations headquartered in a given country) indicate that private sector borrowers (other than banks) in major EMEs issued international debt securities worth almost $375 billion in 2009-12, more than double their issuance in the four-year period prior to the crisis.3 Issuance in 2013 was also strong, even though there were signs late in the year that global bank claims were recovering too.
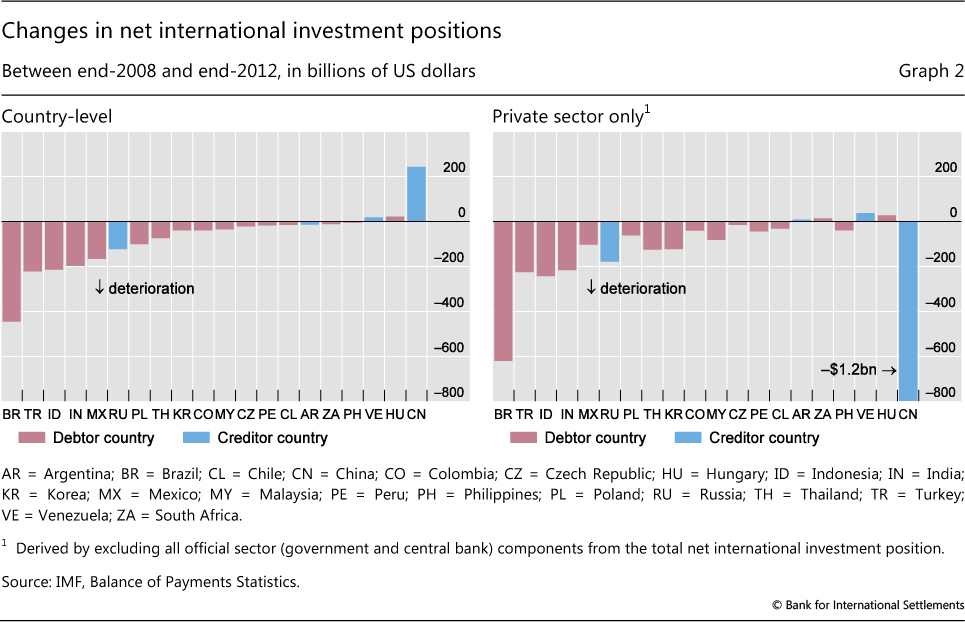
The scale and overall importance of recent developments in EME corporate and wider private sector financing are also apparent from broader indicators of external financing, such as international investment positions (IIPs). Many EMEs have seen their net external positions shift considerably since 2008 (Graph 2, left-hand panel). Comparison of the private sector contributions (Graph 2 right-hand panel) with country-level IIP changes reveals that the observed decline in net IIP balances was primarily driven by rising private sector liabilities (including those of corporates), whereas official sector balances have been stable or rising. Note, however, that IIP data are derived from residence-based statistics and usually do not include the gross positions of overseas subsidiaries; nor do they cover domestic positions.4
Potential risks to the corporate sector
A key question is whether these developments have made EME corporates more vulnerable - for example, to the combined effects of a slowdown in the domestic economy, currency depreciation and rising interest rates globally. Such risks are accentuated when leverage starts to loom too large relative to borrowers' debt servicing capacity or when foreign currency assets or revenues are insufficient to match large foreign currency liabilities. Rising interest rates and depreciating exchange rates will tend to raise the cost of servicing these debts, denting profits or depleting capital cushions, unless appropriate hedges are in place.
Unfortunately, data limitations mean that such vulnerabilities are notoriously hard to assess, especially in a cross-country context. For many EMEs, the lack of financial accounts data at the national level means that internationally comparable measures of corporate sector leverage are difficult to obtain. In what follows, selected metrics are used to provide at least a partial picture.
Corporate leverage
Various measures point to rising leverage on corporate balance sheets. One such indicator is the debt/earnings ratio as disclosed by individual firms. A recent study, based on a sample of non-financial corporations from seven large EMEs, suggests a more or less steady increase in corporate leverage over the last few years (Graph 3, left-hand panel).5 Country-level data (based on residence) on corporate debt-to-GDP ratios appear to confirm this trend, while providing a perspective on broad leverage levels across jurisdictions. According to this metric, corporate indebtedness now hovers at around 100% of GDP for some EMEs (Graph 3, centre panel). Yet, despite recent trend growth, levels vary considerably between countries and remain modest by international standards.
Borrowing patterns have differed across countries in recent years. While developments in some economies (eg for corporates in Latin America) appear to reflect a more general shift from primarily domestic to more internationally diversified funding sources (Powell (2014)), in others domestic debt rose in tandem with external borrowing. For example, Chinese corporates (especially property developers) now appear to be quite highly leveraged, at least in comparison with their EME peers, and may find it challenging to manage these debt levels in an environment of slowing growth and tightening profit margins (Bank of America Merrill Lynch (2014)).
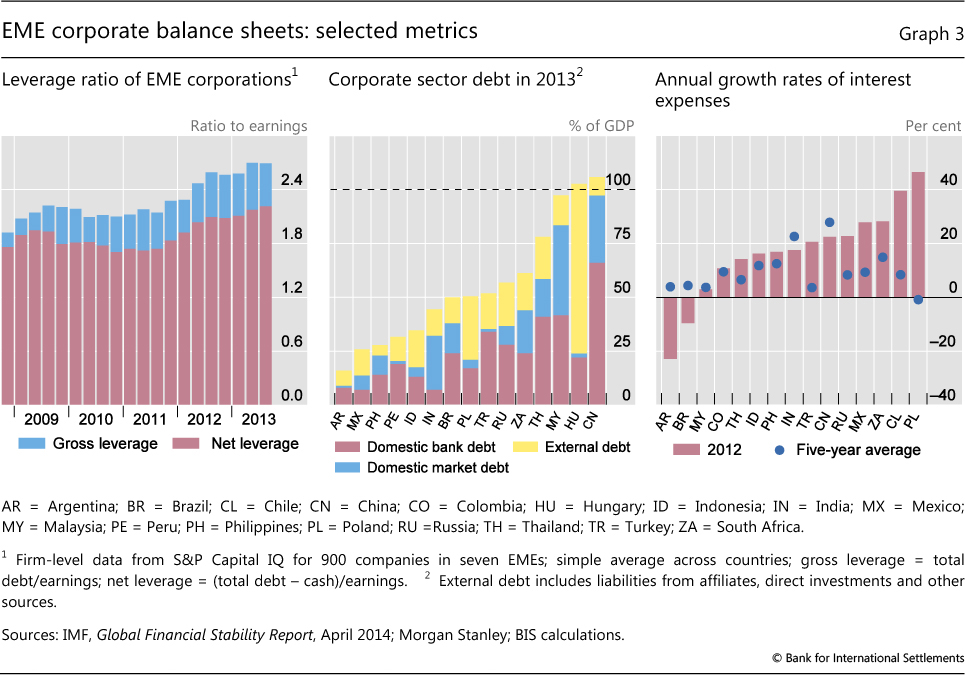
Debt/earnings ratios can also reveal how rising leverage may be affecting the capacity of firms to service their debts. A recent analysis based on firm-level data finds that corporate debt grew faster than earnings in one third of the sample economies between 2008 and 2012.6 For Brazil, China and India, the average firm required 2.5 to three years of current annual gross earnings to repay its debt in 2012, compared with two to 2.8 years in 2008. In many cases, the deterioration in debt servicing capacity reflects a combination of rising debt loads and slowing earnings growth. Furthermore, despite broadly stable and low interest rates over the past five years, many EMEs have encountered a sharp increase in interest expenses because of the larger debt loads (Graph 3, right-hand panel).
Asset composition
The nature or quality of assets acquired using the newly borrowed funds may either strengthen or weaken a firm's resilience against external shocks. Evidence on the use of newly raised corporate funds is mixed. On the one hand, there are signs that capital expenditure (capex) has been on the rise. Analyst estimates suggest that the average capex of EME corporates (which includes funds used to upgrade production capacity and acquire physical assets) has increased by almost one third over the past few years, based on a sample of 120 EME corporate issuers.7 In this context, the stronger earnings prospects associated with capital spending would tend to offset at least part of the risks associated with rising leverage.
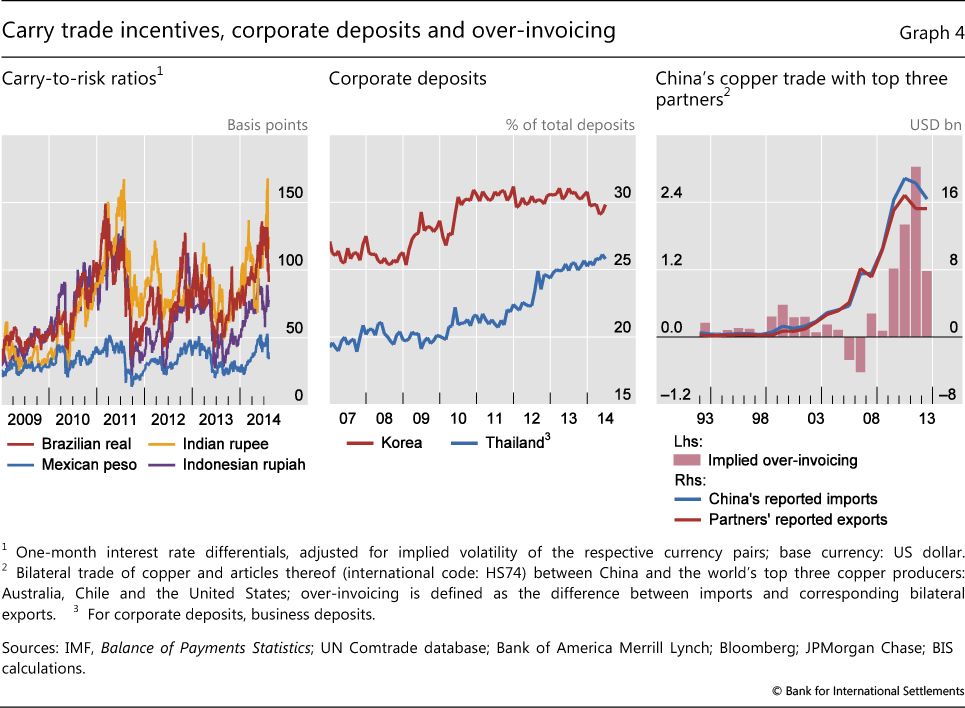
On the other hand, due to low volatilities, Sharpe ratio-type risk-adjusted return metrics (eg interest rate differentials adjusted for exchange rate volatility) suggest that carry trade incentives are also strong (Graph 4, left-hand panel), which may have tempted some corporate treasurers into more speculative activities.
One indicator of such activities may be corporate cash holdings, as measured by the difference between gross and net leverage ratios, which have increased markedly since 2009 (Graph 3, left-hand panel). Similarly, corporate bank deposits have grown in a number of banking systems during this period (Graph 4, centre panel). The fact that the trend has not abated more recently suggests that post-crisis caution may not be the only reason why firms have increased their cash holdings. This is in line with reports that corporates in some jurisdictions were seeking to take advantage of international interest rate differentials by borrowing overseas and depositing the proceeds in local banks, subscribing to money market mutual funds or purchasing high-yielding wealth management products.8 In Korea, for example, deposits by private non-financial companies in trust companies and their shares in investment funds rose by a respective 36% and 45% in the two years to end-2013. In China, reports of over-invoicing by Chinese importers have emerged, especially for metals and other high value-to-density articles (Graph 4, right-hand panel). The low-cost funds raised through trade financing for these imported articles are reportedly being used for both business investment and speculation.9 Yet the overall scale of these activities is difficult to judge, and even normal treasury operations could well lead to a substantial rise in local currency deposits at the local banks (eg due to time-to-build and similar constraints).
Increased bond market financing
A related issue concerns the composition of funding sources and, in particular, the rising share of bond market financing. As highlighted above, strong investor interest has underpinned EME corporate bond markets in recent years. If investors were to suffer a significant loss of appetite, issuing firms might face difficulty in rolling over their outstanding debts, particularly if shifts in risk appetite coincide with a fall-off in projected earnings.
Many of the recent EME corporate borrowers have gained access to the debt markets, both domestic and international, for the first time. The willingness of investors to let these issuers roll over their debt in adverse circumstances is thus untested. BIS international debt securities data, which exclude domestic as well as short-term issuance, suggest that the rollover needs of corporates from major EMEs and their overseas subsidiaries will rise from around $90 billion in 2015 to a peak of $130 billion in 2017-18 (Gruić et al (2014)).10 Note that these figures may underestimate the risk of a sudden retreat by global investors, who may also hold the domestic debt of EME corporates. For some corporations, rising debt repayments will be particularly taxing in an environment of US dollar strengthening (see below) and slowing domestic activity. Also, while domestic banks continue to be the dominant source of funding for EME corporates, their ability and willingness to help refinance market debt may be limited, particularly if risk appetite is on the wane.
Currency mismatch
Given the elevated levels of foreign currency borrowing, currency mismatches represent another possible source of vulnerability. Recent developments in Ukraine are a reminder of how abruptly debt sustainability metrics can deteriorate when (in this case, geopolitical) risks undercut the exchange rate, thus inflating the local currency value of foreign currency liabilities. This raises the question of how far the foreign exchange risks of rising foreign currency liabilities at EME corporates are either financially hedged or naturally matched by foreign currency asset returns and revenues.11
In the absence of more specific information on natural hedges, issuer sectors may serve as an important proxy indicator. Commodity producers and manufactures exporters, for example, earn much of their revenues in foreign currencies and are thus likely to weather the rising debt service costs associated with currency depreciation better than would issuers with mostly domestic incomes (eg domestic telecoms, construction companies and utilities).
On this basis, a cursory examination of firm-level issuance data suggests that non-financial borrowers from countries such as Brazil, Mexico, Russia and South Africa would be more likely to have at least partially matching foreign currency assets and liabilities, given the predominance of commodities producers and exporters among the largest issuers. In contrast, assets and liabilities are less likely to be matched at property developers in China or energy and utilities firms in India, which have been among the more active international debt issuers in recent years, pointing to possible "pockets of risk" in these sectors.
Companies can also manage their foreign currency exposures via derivatives. Again, reliable data on corporate hedging activities are generally scarce, while incentives to take open interest rate and foreign currency hedging positions have been relatively strong recently. One issue is hedging cost and, hence, the depth of the relevant hedging market. This might suggest that corporates from countries such as Brazil, Korea or Mexico (which are known to have access to liquid domestic or offshore markets that support financial hedging strategies for both currency and interest rate risk exposures) are more likely to be hedged than their peers in, say, China or Indonesia. Indeed, data for Mexico indicate that the volume of exchange rate derivatives transactions picked up sharply from a monthly average of around $12 billion in 2007-08 to more than $25 billion in late 2013, in line with the observed increase in local corporates' international issuance. In countries with less developed markets, however, mismatches will often go unhedged because markets may not be deep enough to provide appropriate and cost-effective hedging.12
The flip side of this argument is that derivatives-related financial exposures can change the sensitivity of corporate balance sheets in ways that may be unrelated to what is suggested, say, by the issuer's sector. In the early stages of the global financial crisis, for example, some large corporates in Brazil, Korea and Mexico experienced significant losses because of largely speculative positions in foreign exchange derivatives contracts (see box). This experience shows that an abrupt change in the exchange rate trend can conspire with complex financial exposures to wreak significant damage on corporate balance sheets even when a firm's foreign exchange liabilities are deemed to be adequately hedged during normal times.
An additional concern is that liquidity in hedging markets can evaporate during times of market stress. Even longer-term exposures are often hedged with more liquid short-term contracts with the aim of reducing hedging costs. As the respective contracts have to be rolled over regularly, this could significantly reduce the value of financial hedges against large exchange rate fluctuations, since markets are bound to be at their shallowest when hedging needs are greatest. In this context, the May 2013 and early 2014 episodes of sharp currency depreciation in many EMEs may have served as wake-up calls, by inducing corporate treasurers to review and trim any open currency exposures. Recent attempts by the Chinese authorities to introduce more two-way risk into renminbi exchange rates would seem work in the same direction.
Currency derivatives and corporate losses: this time is different?
The Lehman bankruptcy in September 2008 triggered a global shortage of US dollar funding, lifting the US currency. According to one estimate, the ensuing sharp depreciation of local currencies against the dollar hit 50,000 or more non-financial corporations with total losses of at least $30 billion, via positions on foreign exchange (FX) derivatives contracts. This added to the uncertainty in those corporates' domestic financial markets, worsening the impact of the crisis still further. Given that many EME corporations are said to have increased their foreign exchange exposures significantly in recent years, a key question is how vulnerable such firms are to, possibly abrupt, exchange rate movements. This box reviews some key features of the derivatives activities of EME corporations in 2008, and highlights differences between then and now.
One factor behind EME corporates' foreign exchange losses in 2008 was the popularity of contracts with a "knock-in, knock-out" (KIKO) feature. Heavy use of such contracts meant that many exporters, while insured against modest exchange rate movements, were exposed to possibly large losses if the local currency depreciated sharply.
In a standard FX option transaction, a company (eg an exporter) with revenues mostly in foreign currency (eg in US dollars) but with production costs in local currency buys, for a small fee (premium), a put option from a counterparty (eg a local bank) that gives the exporter the right but not the obligation to sell its dollar income at a specific strike price at a future time. If the domestic currency spot exchange rate at maturity is stronger than the agreed rate, the exporter exercises the option and gets a higher income in local currency terms than it would otherwise get at the spot rate.
Compared with this basic setup, KIKO contracts have two additional features. The first is a call option (knock-in) held by the bank. If the reference currency (eg the US dollar) strengthens beyond a certain threshold, the knock-in requires the exporter to sell its dollars at the strike price (ie below market rates). The second, so-called knock-out, feature dictates that no option can be exercised by either the exporter or the bank if the dollar weakens below a certain threshold. Both features serve to reduce hedging expenses, albeit at the cost of retaining the tail risk of stronger currency depreciations.
A third feature is possible acceleration effects. KIKO contracts were quite often leveraged (at, say, 1:2), resulting in payments that would double the contractual amounts. This resulted in open speculative positions on relatively stable exchange rates. Furthermore, some EME corporations apparently purchased multiple KIKO contracts with different banks to bypass each individual bank's counterparty limit. As a result, when the US dollar rose sharply against almost all currencies in late 2008, these corporations suffered "unexpected" losses owing to the knock-in feature in their hedging operations.
Given the risk of high potential losses, a key question is why so many EME corporations used KIKO or similar contracts to hedge their FX exposures prior to 2008. There are a number of possible explanations. By design, KIKO features lower the premium charged by the contract seller. In that sense, many EME corporations were attracted by the low hedging costs. This feature was particularly attractive at the time, as the major EME currencies had experienced a long period of slow but steady appreciation against the US dollar. The resulting false sense of security was reinforced by most commercial and official forecasts, which, up until 2007, called for this trend to continue in the near term. Furthermore, local banks were often not the actual seller of the KIKO contracts, but merely acted as intermediaries for foreign banks and ultimate investors, such as hedge funds. In doing so, banks earned a fee while passing the exchange rate risk on to the ultimate contract sellers. Under such circumstances, banks may have had an incentive to sell more contracts to increase their fee income, at least insofar as their client relationships with their corporate customers were not jeopardised by any losses that their clients might incur.
Against this background, an important difference between now and then is that the recent prolonged period of relatively low volatility in foreign exchange markets has been punctuated by the two "tapering" events, in May 2013 and January/February 2014. No major losses from corporate exposures in derivatives markets were revealed in the aftermath of these episodes. That said, carry trade incentives have since strengthened again, and certain EME corporations may have incurred exposures via contracts that will generate losses only at a later stage. For example, there is anecdotal evidence of increased interest from Asian corporates in structured foreign exchange products with KIKO-like features. In addition, for some EME hedging markets, the sellers of hedging products are often concentrated and the markets themselves are not very liquid. Again, this tendency could exacerbate any market reaction once the market changes direction.
See eg Sidaoui et al (2010) and Lee (2009).
Implications for local banks and the financial system
What are the implications of more vulnerable EME corporate sector balance sheets for the financial system? Scope for spillovers arises from at least two channels, as detailed below.
Liability-side exposures
One channel works through the liabilities of banks and, possibly, other financial institutions.13 Among these, local institutions are likely to be particularly exposed, especially if they have come to rely on corporate deposits for part of their wholesale funding. For deposits that are associated with corporates exploiting the "carry" between local and foreign currency interest rates, the unwinding of such positions when interest rate differentials narrow or volatilities increase will reduce these funds. Deposits that are denominated in foreign currencies, in turn, are known to be more procyclical than other types of deposits and may thus be subject to sudden withdrawals by corporates facing rollover risks (Turner (2014)).
A key factor in the transmission of such effects is the shadow banking system. In Korea, for example, assets held by non-bank financial institutions have grown at an annual average rate of 10% since the global financial crisis. Securities companies, in particular, have seen their assets increase more than twofold during that period. In this context, it appears that the securities sector in Korea has accumulated substantial claims on banks and other depository institutions. Securities firms, in turn, finance themselves with short-term money market instruments held by the non-financial corporate sector. To the extent that non-financial corporates issue debt but hold the proceeds as liquid claims, they behave as surrogate intermediaries channelling funding from global capital markets into the domestic financial system (Bank of Korea (2014)).
Asset-side exposures
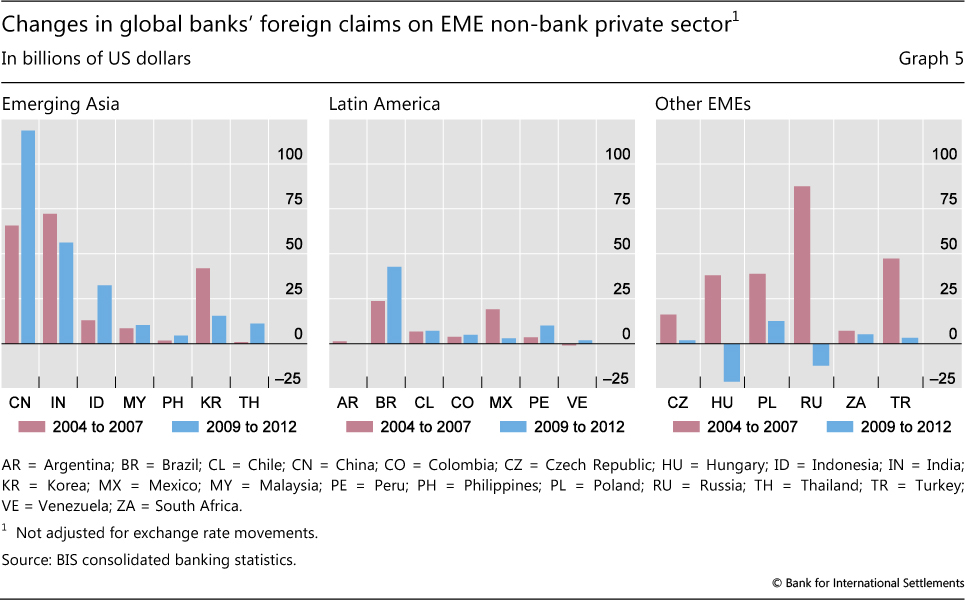
Another, more conventional, channel is the risks embodied in asset-side exposures. Banks tend to have direct credit exposures to corporates via lending and through counterparty risk from any derivative positions. While these exposures can be important internationally, for example vis-à-vis Asia (Graph 5), local banks, again, tend to be particularly exposed, with loans to non-banks still accounting for a large part of domestic loans in many jurisdictions. Furthermore, since larger and more creditworthy corporates have better access to cross-border borrowing, higher foreign bank penetration could end up increasing the exposure of local lenders to smaller, possibly less creditworthy, firms. That said, a mitigating factor is that standard on-balance sheet leverage and capitalisation metrics for EME banks tend to be rather favourable in the aggregate, which may help to reduce such risks at the banking system level.14
Another, less direct, source of credit risk for banks comes from broader exposure to debt markets, eg via bond holdings. Recently, however, there have been signs that asset managers and other buy-side investors have increasingly displaced bank investors in corporate bond markets. This raises questions about feedback effects if existing positions are not rolled over (see below).
Feedback effects
Working together, both types of channel can give rise to potentially powerful feedback effects. Currency mismatches, for example, will tend to amplify both default risk and pressure to deleverage if borrowers are hit by a depreciating local currency. Combined with uncertainties about the true extent of such mismatches, concerns about rising default risk could then result in a more widespread rout of international investors, loss of market access and spillovers into domestic interbank markets - exacerbating the financial and macroeconomic impact of the initial interest rate or foreign exchange shock.
The duration risk exposures of asset managers and other institutional investors (the flip side of corporates' attempts to issue new debt and term out existing borrowings) are another potential source of adverse price dynamics. These might be further amplified by the correlated behaviour of asset managers. Such herding in bond markets can arise from the reliance on common risk management technologies, from simultaneous buy and sell decisions due to index tracking, and from a rush to exit due to concerns about market liquidity.15
Conclusions
Unusually easy global financial conditions post-crisis and the ubiquitous quest for yield have encouraged EME non-financial corporations to increase leverage and overseas borrowing. In many jurisdictions, corporates have opted to lock in low global interest rates and to sharply increase their international debt issuance. While cheap funding could boost economic performance if it supports viable investment projects, it inevitably increases the borrower's interest rate, rollover and currency risks. Furthermore, some EME corporations may have used borrowed funds for purely financial (ie speculative) purposes. In other cases, these external positions may be inadequately hedged, whether through natural offsets or by the use of financial instruments.
Overall, these factors have increased the risks facing these companies, implying the existence of "pockets of risk" in particular sectors and jurisdictions. If these risks were to materialise, adding to broader EME vulnerabilities (BIS (2014)), stress on corporate balance sheets could rapidly spill over into other sectors, inflicting losses on the corporate debt holdings of global asset managers, banks and other financial institutions. This could be a source of powerful feedback loops in response to exchange rate and/or interest rate shocks, especially if credit risk concerns prevented the rollover of existing bank or bond market funding.
References
Avdjiev, S and E Takáts (2014): "International bank lending during the taper tantrum: the role of emerging market fundamentals", BIS Quarterly Review, September, pp 49-60.
Bank for International Settlements (2014): 84th Annual Report, "Time to step out of the shadow of the crisis", Basel, June.
Bank of America Merrill Lynch (2014): "Facts, fiction and FX vulnerabilities", Global Emerging Markets Credit Research, 25 February.
Bank of Korea (2014): Financial Stability Report, April 2014.
Chung, K, J-E Lee, E Loukoianova, H Park and H S Shin (2014): "Global liquidity through the lens of monetary aggregates", IMF Working Papers, no 14/9.
Committee on the Global Financial System (2014): "EME banking systems and regional financial integration", CGFS Papers, no 51, March.
Financial Times (2014): "Fall in renminbi sends out carry trade warning", 23 February.
Goldman Sachs (2013): "Copper curve ball - Chinese financing deals likely to end", Goldman Sachs Commodities Research, 22 May.
Gruić, B, M Hattori and H S Shin (2014): "Recent changes in global credit intermediation and potential risks", BIS Quarterly Review, September, pp 17-18.
International Monetary Fund (2014): "Making the transition from liquidity- to growth-driven markets", Global Financial Stability Report, Chapter 1, April.
Kamada, K and K Miura (2014): "Confidence erosion and herding behaviour in bond markets: an essay on central bank communication strategy", Bank of Japan Working Papers, no 14-E-6, April.
Lee, Y (2009): "Korean corporations court bankruptcy with suicidal KIKO options", Bloomberg, 24 March.
Miyajima, K and I Shim (2014): "Asset managers in EM asset markets", BIS Quarterly Review, September, pp 19-34.
Morgan Stanley (2013): "EM corporates: rising leverage, rising risk", Morgan Stanley Research EM Profile, November.
Powell, A (2014): "Global recovery and monetary normalisation: escaping a chronicle foretold?", Inter-American Development Bank, Chapter 4.
Rush, A, D Sadeghian and M Wright (2013): "Foreign currency exposure and hedging in Australia", Reserve Bank of Australia Bulletin, December.
Shin, H S (2013): "The second phase of global liquidity and its impact on emerging economies", remarks at the 2013 Federal Reserve Bank of San Francisco Asia Economic Policy Conference.
Sidaoui, J, M Ramos-Francia and M Cuadra (2010): "The global financial crisis and policy response in Mexico", BIS Papers, no 54, December.
Turner, P (2014): "The global long-term interest rate, financial risks and policy choices in EMEs", BIS Working Papers, no 441, February.
World Gold Council (2014): China's gold market: progress and prospects.
1 The views expressed in this article are those of the authors and do not necessarily reflect those of the BIS or the CGFS. We are grateful to Claudio Borio, Dietrich Domanski, Mathias Drehmann, Masazumi Hattori, Ulf Lewrick, Hyun Song Shin, Philip Turner, Christian Upper and the participants of the Joint CGFS - FSB-SCAV workshop in Hong Kong SAR on risks from currency mismatches and leverage on corporate balance sheets for useful comments and discussions, and we thank Branimir Gruić, Mario Morelli and Jhuvesh Sobrun for their expert research assistance.
2 In this article, unless otherwise stated, the term "EME" is to be read as referring to the following 21 major emerging market economies: Argentina, Brazil, Chile, China, Chinese Taipei, Colombia, the Czech Republic, Hungary, India, Indonesia, Korea, Malaysia, Mexico, Peru, the Philippines, Poland, Russia, Turkey, South Africa, Thailand and Venezuela. Note that Hong Kong SAR and Singapore are excluded from this group of EMEs, as many corporates headquartered in developed and other emerging countries have raised funds there, which could blur the analysis of debt issuance by residence and nationality in our study.
3 The issuer by nationality concept is similar to the consolidated claims concept in the BIS international banking statistics. It is especially important in the case of EMEs such as Brazil and China where local corporates have increased their issuance of international debt via overseas subsidiaries - including non-bank financing vehicles. By contrast, the issuer by residence concept does not include issuance by these overseas subsidiaries, but it does include international debt issues by other nations' subsidiaries residing in the respective country.
4 Over the past few decades, many Chinese companies have opted for a listing in overseas stock markets (Hong Kong SAR in particular) to raise capital and hone their corporate governance. As of end-June 2014, nearly 300 Chinese-owned or affiliated companies were listed on the main board of the Hong Kong stock exchange with an aggregate market capitalisation of $660 billion.
5 See Bank of America Merrill Lynch (2014). BIS (2014), Chapter VI, provides additional information based on capitalisation ratios.
6 See IMF (2014), which compares median corporate debt loads with earnings across 18 EMEs to gauge the corporate sector's debt servicing capacity.
7 See Bank of America Merrill Lynch (2014).
8 According to official data, the total balance of banks' wealth management products in China rose from CNY 2.3 trillion in late 2009 to almost CNY 10 trillion in late 2013; see Financial Times (2014).
9 For example, the World Gold Council (2014) estimates that, by the end of 2013, "surplus" gold linked to financial operations in the Chinese shadow banking system could have reached a nominal value of nearly $40 billion. See also Goldman Sachs (2013) for a detailed exposition of the mechanics involved in the copper "carry trade".
10 International issuance, which is dominated by US dollar-denominated debt, makes up about one fifth of total debt issuance, with domestic debt accounting for the remainder. Domestic debt will add to interest rate and rollover risks, but does not usually incur a currency mismatch risk (as covered in more detail below).
11 Data on country-level foreign currency exposures and on how far they are hedged are generally unavailable. Australia is an exception in that the Australian Bureau of Statistics conducts a Foreign Currency Exposure Survey to gauge the country's net foreign asset position (ie after taking into account the hedging of foreign currency exposures using financial derivatives) (see Rush et al (2013)). Yet the Survey is conducted infrequently (once every four years) and is residence-based (as opposed to nationality-based).
12 For illustration, the 2013 annual report of one large Chinese property developer states: "The Group manages its currency risk by closely monitoring the movements of currency exchange rates. The Group currently does not have a currency hedging policy [-] but will consider hedging significant currency exposure should the need arise."
13 See Chung et al (2014) for a discussion of how the financial activities of non-financial corporates in international markets could affect funding conditions and credit availability in home markets.
14 A possible caveat is that EME and advanced country bank balance sheet metrics may, in fact, be converging; see CGFS (2014) and BIS (2014), Chapter VI, for details.
15 For a more detailed exploration of the risks arising from the increased participation of global asset management companies in emerging markets, see Miyajima and Shim (2014). Kamada and Miura (2014) provide a model and empirical evidence of herding by bond market investors in Japan due to some of the same factors.