Global FX markets when hedging takes centre stage

Turnover in global foreign exchange (FX) markets averaged $9.5 trillion per day in April 2025, a 27% increase from April 2022. Developments specific to April, namely heightened volatility and the dollar's depreciation following US tariff announcements, were linked to a surge in spot and forward trading as market participants managed currency risk. The preconditions set by global monetary policy tightening since 2022, which had raised hedging costs and left many investors underhedged, amplified these developments. In addition, interbank trading in FX swaps stagnated because of reduced liquidity management needs and fewer cross-currency arbitrage opportunities. Dealers largely relied on internal capital markets to manage risk and demonstrated greater capacity to internalise client trades than in previous years, supporting orderly market functioning in April.1
JEL classification: C42, C82, F31, G12, G15
The average daily turnover in over-the-counter (OTC) foreign exchange (FX) spot and derivatives transactions reached $9.5 trillion in April 2025, more than a quarter higher than in April 2022. This surge occurred amid heightened volatility following the US tariff announcements early in the month and against the backdrop of global monetary tightening that shaped market preconditions. Drawing on the 2025 BIS Triennial Central Bank Survey results, this article examines recent trends in FX trading volumes and market structure and how they set the stage for the April developments.2
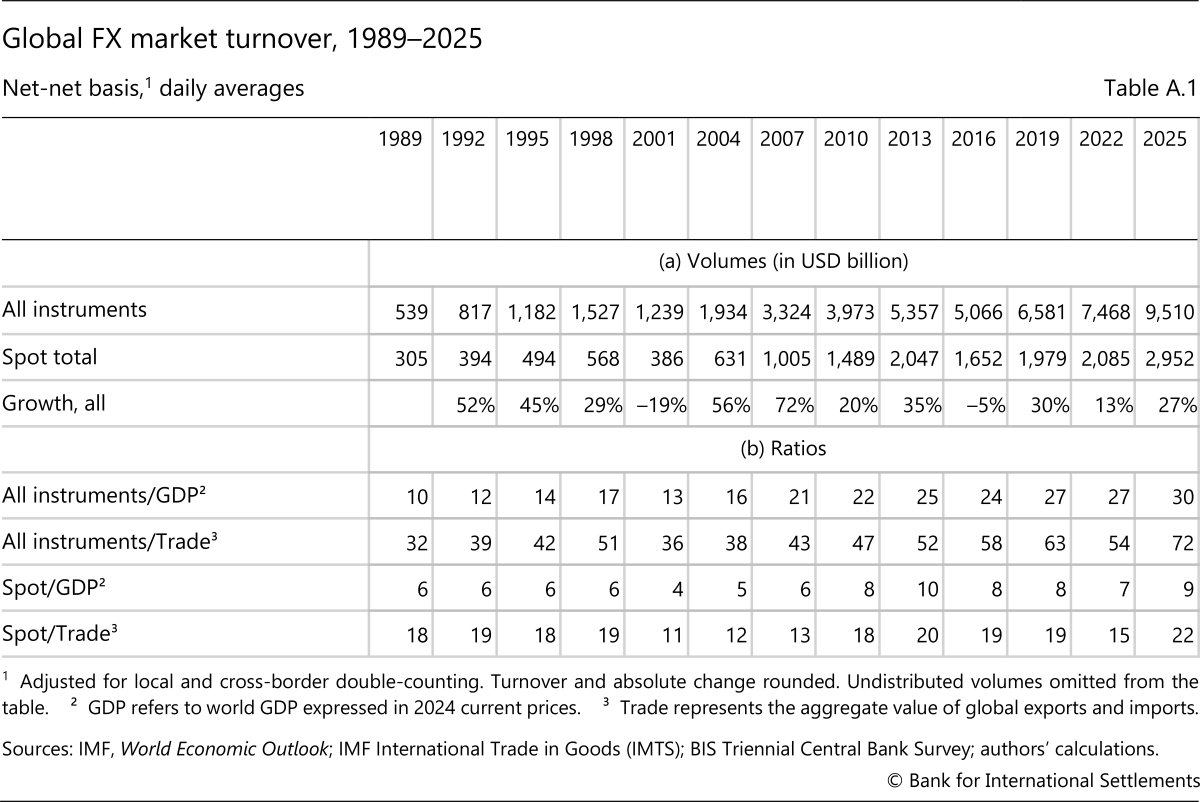
Over the past three decades, average daily FX trading volumes have not only dwarfed daily global GDP and international trade but also expanded at a much faster pace. While global FX trading volumes were 12 times global GDP in 1992, they were 30 times that in 2025 (see Annex Table A.1). They were about 70 times the volume of global trade in 2025, roughly double the ratio in 1992. This rise in FX volumes reflects financial deepening and greater involvement of non-bank financial institutions (NBFIs) in FX markets (International Monetary Fund (2025)), as trading for financial motives has come to dominate trading for the purpose of goods and services exchange (Caballero et al (2022)).
Key takeaways
- Global FX turnover reached $9.5 trillion per day in April 2025, up 27% from April 2022, partly reflecting trading around the US tariff news and hedging of US dollar exposures.
- Financial customers turned to forwards and options, in addition to FX swaps, to hedge their US dollar exposures; by contrast, interbank FX swap trading stagnated while interbank forwards gained traction.
- Dealers relied more on intragroup trading to manage risk and matched a larger share of client trades internally than in previous years, thereby reducing the market impact of heightened client activity.
Since the 2022 Triennial Survey, growth in FX volumes was primarily driven by reporting dealers' trading with financial customers. Both spot transactions and trading of forwards and options with these counterparties rose noticeably. These instruments can be used to adjust exposures to currency risk on existing positions or to speculate on future currency moves. The growth of FX swap turnover was mainly due to trading with institutional investors, reflecting their funding and hedging needs across currencies. Overall, however, FX swap trading has grown only modestly since 2022, reflecting a stagnation in interbank activity.3
Several forces shaped FX volumes in April 2025. Announcements of major shifts in US trade policy early in the month and an unexpected depreciation of the US dollar, including a sudden flip in the dollar's correlations with major asset classes, roiled markets. Market participants rushed to hedge existing dollar exposures against further dollar depreciation (Shin et al (2025); Shin (2025)). This boosted turnover of forwards and options. There were no signs of dollar funding strains. If anything, investors reduced their dollar exposures in April. Thus, banks had little need for funding via FX swaps, which is consistent with their subdued growth.
Medium-term forces set the preconditions that amplified the role of hedging in FX trading in April 2025. The need to adjust hedges of US dollar positions was especially acute since many investors entered the month with relatively low hedge ratios. This was in response to higher hedging costs, which rose with global monetary policy tightening from 2022 to 2023. These costs were underpinned by a rapid increase in short-term interest rates in the United States and a widening of interest rate differentials across regions.
In addition to hedging, some market participants reduced their US dollar asset holdings while others used the opportunity to speculate. Thus, portfolio rebalancing by some drove spot turnover higher. In turn, knock-on volatility and movements in exchange rates spurred speculative trading by hedge funds and momentum traders.
Despite volatile market conditions, dealers demonstrated a greater capacity to internalise trades than in previous years. By matching offsetting client trades on their own books, they reduced the need to hedge externally with other dealers, thereby minimising the market impact of customer flows. Furthermore, the growth rate of intragroup turnover was higher than total inter-dealer turnover across all instruments, indicating the rising role of internal capital markets for managing currency risk.
A surge in FX volumes in April 2025
Global FX trading in April 2025 was at an all-time high, with average daily turnover of $9.5 trillion (Graph 1.A). Turnover exceeded trend growth in response to extraordinary events, namely elevated volatility and dollar depreciation following the US tariff announcements early in the month.
The tariff announcements' impact on trading activity in April appears to have been substantial, contributing an estimated $1.5 trillion to overall turnover (Graph 1.B). An imputed global FX turnover series (red line), derived from semiannual FX committee surveys, is used to gauge expected April activity without Aprilspecific shocks: the prevailing trend from the October 2024 survey is extrapolated to April 2025 (red cross).4 Actual turnover in April 2025 exceeded this benchmark and reached an alltime high, surpassing the previous imputed (unobserved) peak during the Covid19 turbulence in March 2020 (vertical line).
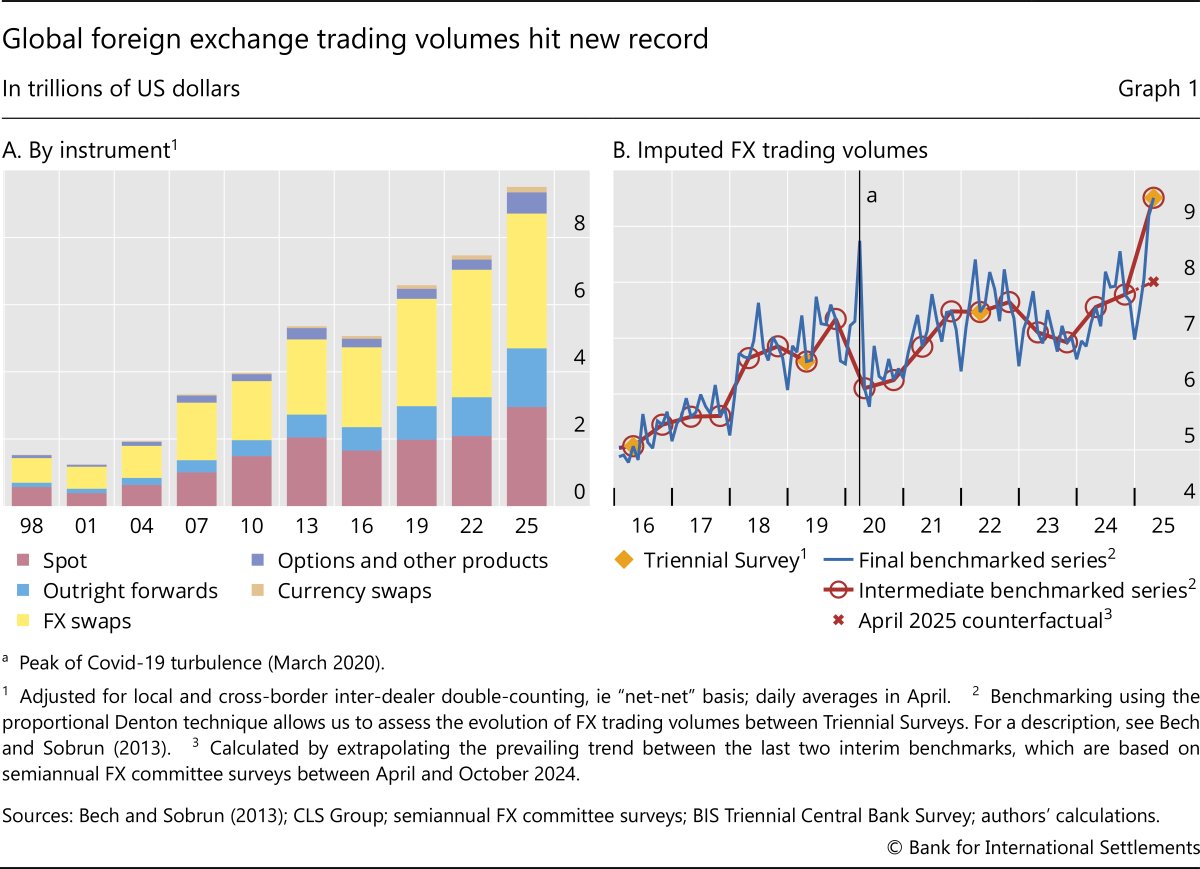
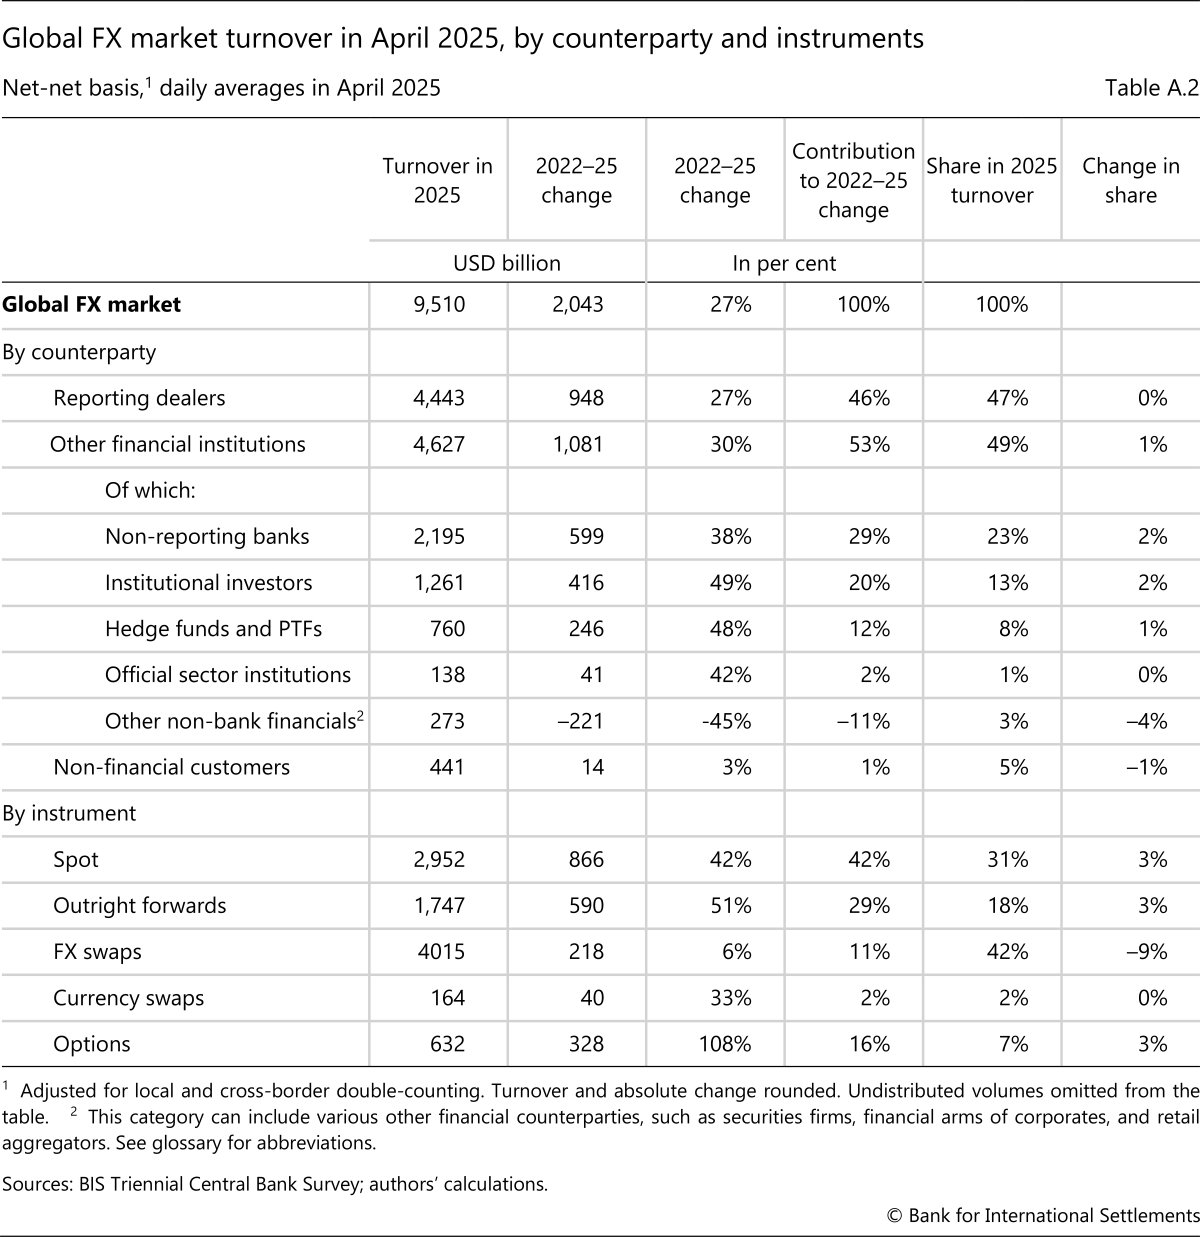
Heightened financial market volatility in April 2025 was associated with an uneven rise in FX trading activity across instruments. Compared with April 2022, spot and forward trading rose by 42% and 51%, respectively. Trading in options was up 108%. By contrast, trading growth in FX swaps, the most traded instrument, stagnated compared with the overall market, rising by only 6% (see annex Table A.2).
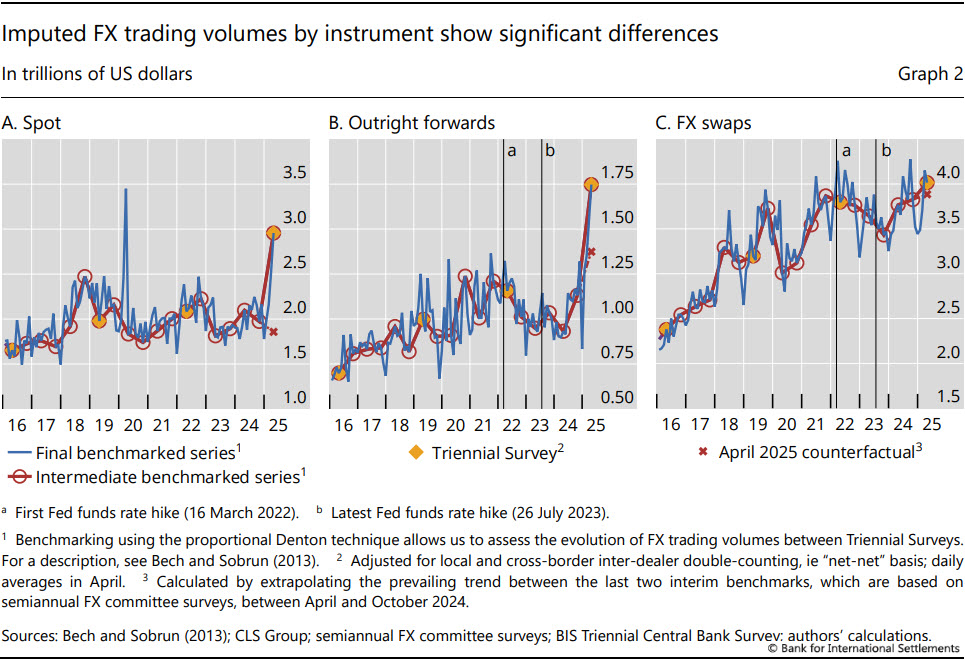
The higher-frequency imputed series underscores the exceptional nature of April 2025. The rise in daily turnover in April was primarily due to an estimated $1.1 trillion spike in spot trading during that month (Graph 2.A). An extrapolation based on the prevailing trend suggests that, without the tariff effects, spot turnover would have been flat, or even lower, compared with April 2022. Similarly, roughly $400 billion of the $1.75 trillion daily turnover in forwards can be attributed to trading around the tariff announcements (Graph 2.B). By contrast, FX swap volumes were only slightly higher, by $130 billion, compared with the estimated trend (Graph 2.C).
The increase in FX trading was primarily driven by dealers' trading with financial customers, particularly institutional investors and non-reporting banks. Spot turnover with institutional investors has nearly doubled since 2022 (Graph 3), surpassing $440 billion in 2025. Meanwhile, non-reporting banks, which trade both on their own account and on behalf of institutional and corporate clients, saw spot and forward trading grow by 57% and 132%, respectively, each contributing an additional $200 billion to total turnover. Although growth in FX swap trading was more subdued overall, trading with institutional investors increased by 18%, to $349 billion. In addition, options turnover with these counterparties surged by more than 150%.
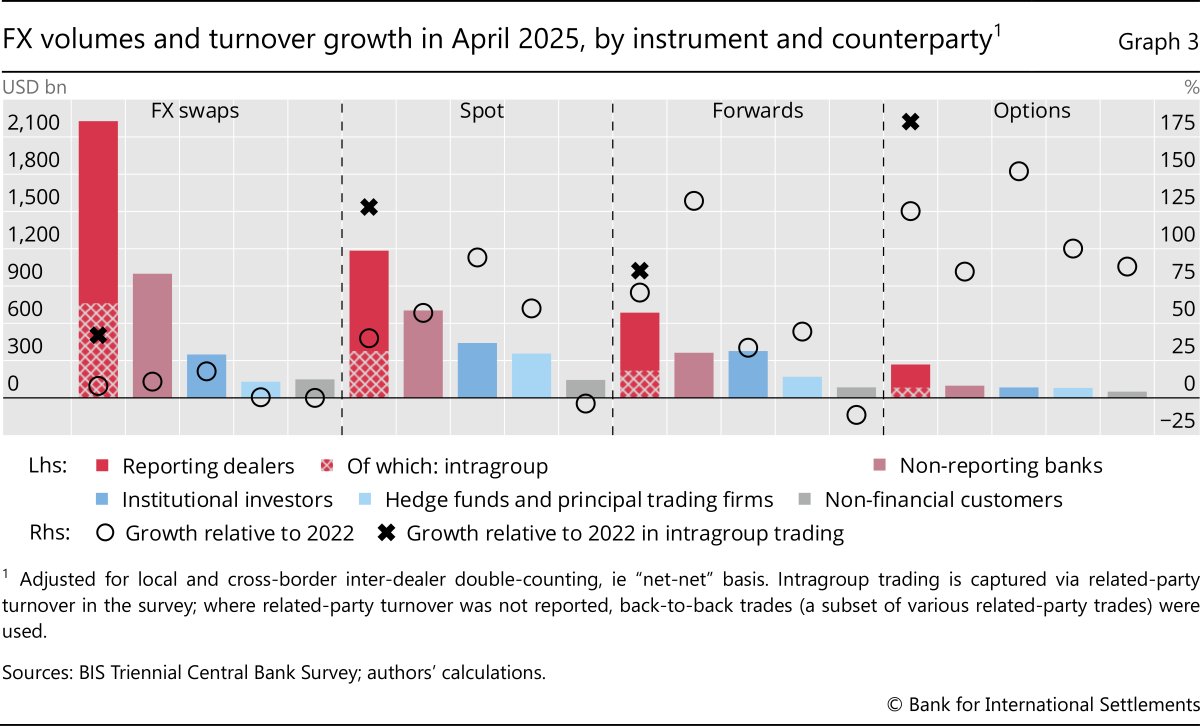
Dealers largely managed risk arising from customer trades internally, without turning to external markets for hedging. Intragroup trading, whereby dealers shift risk across affiliates and trading desks within the same banking groups, increased much more than the overall inter-dealer trading (Graph 3, crosses vs circles). For example, intragroup trades in FX swaps rose 42% (cross), while external trading with other dealers contracted by 4% (not shown), resulting in the overall muted growth of 8% (circle). In spot and forwards, intragroup trades increased 128% and 85%, respectively, while overall trading with reporting dealers (dragged down by slower growth of external trades) rose by 40% and 71%. Such intragroup management of risk probably facilitated high internalisation ratios (Box A). Dealers continued to match a large amount of client trading volume internally instead of trading externally with other dealers (see Box B for a discussion of the FX execution landscape), thus minimising the overall market impact.5
Drivers of FX trading around the tariff news
Factors specific to April 2025 materially shaped the changes in FX trading between the 2022 and 2025 surveys. Although a shift in US trade policy was expected, the scale of the tariff news caught investors by surprise, prompting a broad reassessment of global portfolios and FX exposures. Responses diverged across countries: investors in some countries reduced their US dollar holdings, whereas others maintained exposures (International Monetary Fund (2025)). The historical relationship between the US dollar and risky assets reversed (Boissay and Huang (2025)), leading many to hedge their dollar exposures for currency risk. These developments were amplified by relatively low hedge ratios going into April, reflecting high hedging costs that came with the rise in interest rates in 2022 and 2023.
Despite these dynamics, there were no signs of dollar funding stress in April. If anything, following the tariff announcements some global investors pared back their US exposure through sales of US assets,6 driving up FX spot turnover. More importantly, though, investors rushed to hedge their existing positions against US dollar depreciation, mainly using forwards and options. Intuitively, forwards offered a simple way to lock in exchange rates for future transactions, making them well suited for adjusting hedge ratios on existing exposures. Options trading also increased significantly across counterparty segments, as some options strategies can substitute for forwards to hedge future FX risk. Meanwhile, hedge fund trading in options doubled, also suggesting heightened speculative activity (see Graph 3).
Some sophisticated investors could establish a forward position with a combination of more liquid instruments. For example, a spot dollar sale combined with a rolling FX swap can maintain a short dollar forward exposure. This approach was reportedly favoured by typical users of swaps, eg institutional investors, as seen in the 18% increase in FX swap turnover with these counterparties.
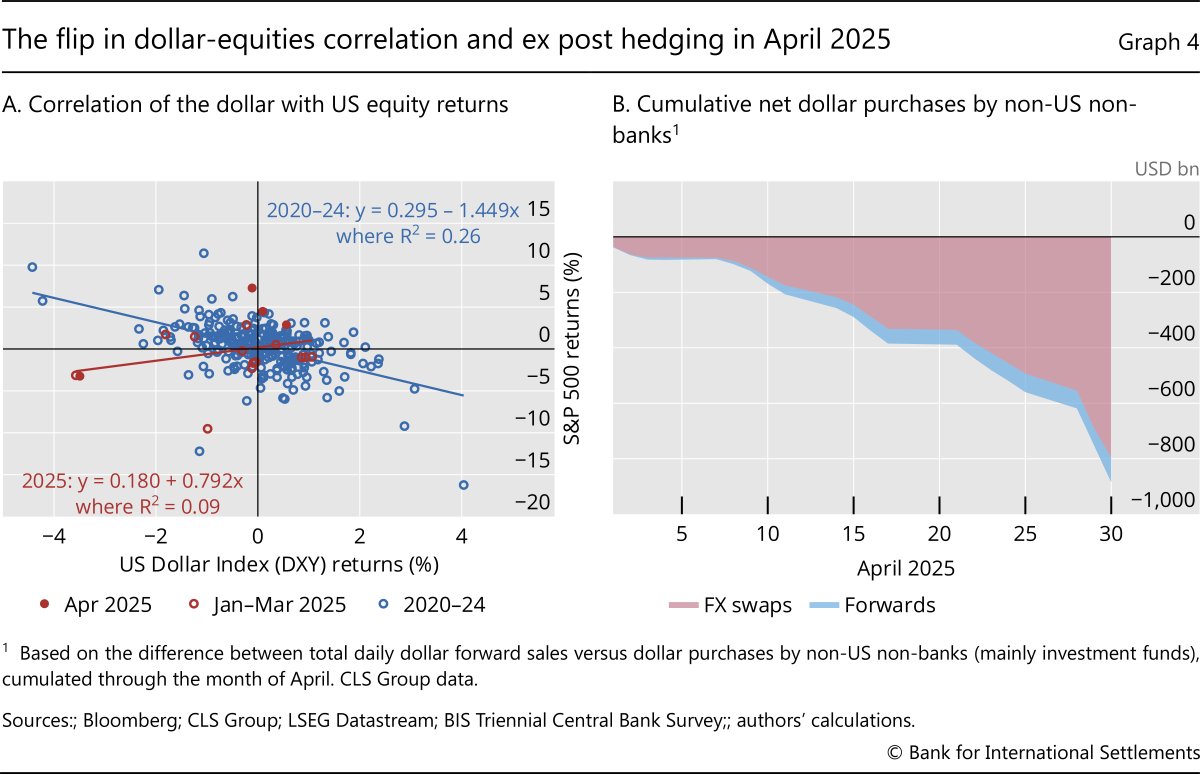
A breakdown in the dollar's correlation with risky assets also contributed to the rush to hedge dollar exposures. Historically, in times of market stress the dollar tended to appreciate when US equity markets fell – a response often referred to as "the dollar smile". This provided a natural hedge for dollar assets, leading many investors to leave large portions of dollar portfolios (especially equities) unhedged. In April 2025, however, this long-standing correlation broke down as the dollar depreciated sharply during the equity market selloff (Graph 4.A). This unexpected reversal caught equity investors off guard, prompting them to reduce or hedge their dollar exposures by selling dollars forward. This is clearly seen in third-party data, which show that non-US non-banks (mostly sophisticated investment funds) were persistent net dollar sellers via FX swaps and, to a lesser extent, outright forwards (Graph 4.B).7
Shifts in FX trading amid global monetary policy tightening
Despite the outsize impact of the April tariff announcements, other longer-term cyclical factors also contributed to turnover in the 2025 Triennial. Global monetary policy tightening in 2022–23, particularly in the United States, raised the costs of FX hedging, thus motivating investors to reduce hedging and shaping market conditions leading up to April 2025. In addition, over the same period, interbank FX swap trading stagnated while interbank forwards gained traction. The withdrawal of excess liquidity via quantitative tightening (QT) in major currencies and fewer cross-currency arbitrage opportunities probably contributed to subdued interbank FX swap turnover.
Further reading
Reduced FX hedging amid higher hedging costs since 2022
The sharp rise in short-term interest rates since 2022 pushed up the costs of hedging dollar exposures. For non-US investors, these costs rise as the difference between short-term dollar interest rates and the equivalent rate in local currency widens.8 Between January and December 2022, the annualised implied interest rate for a dollar borrower (ie hedger) via three-month FX swaps rose markedly for major currencies (Graph 5.A). For example, the forward premium increased from 0.7% to 3.5% for EURUSD, and from 0.3% to 5.5% for USDJPY. Furthermore, the dollar yield curve inverted with the rapid rise in short-term dollar rates. This reduced the expected returns on long-term dollar bonds on a hedged basis, making hedged investments even less attractive for fixed income investors.9
In response, many institutions with currency hedging mandates (eg life insurers and pension funds) significantly lowered their hedge ratios between 2022 and 2024.10 For example, the Japanese life insurance sector reduced hedging rates from roughly 60% to 40% (Bank of Japan (2025)). Similarly, the ratios for Dutch pension funds fell from 30% to 25% and those of Danish insurers and pension funds fell from about 55% to 50% (De Nederlandsche Bank (2025); Danmarks Nationalbank (2025)), while the equity hedge ratio of the Australian superannuation sector declined from close to 30% to 20% (Hauser (2025)).
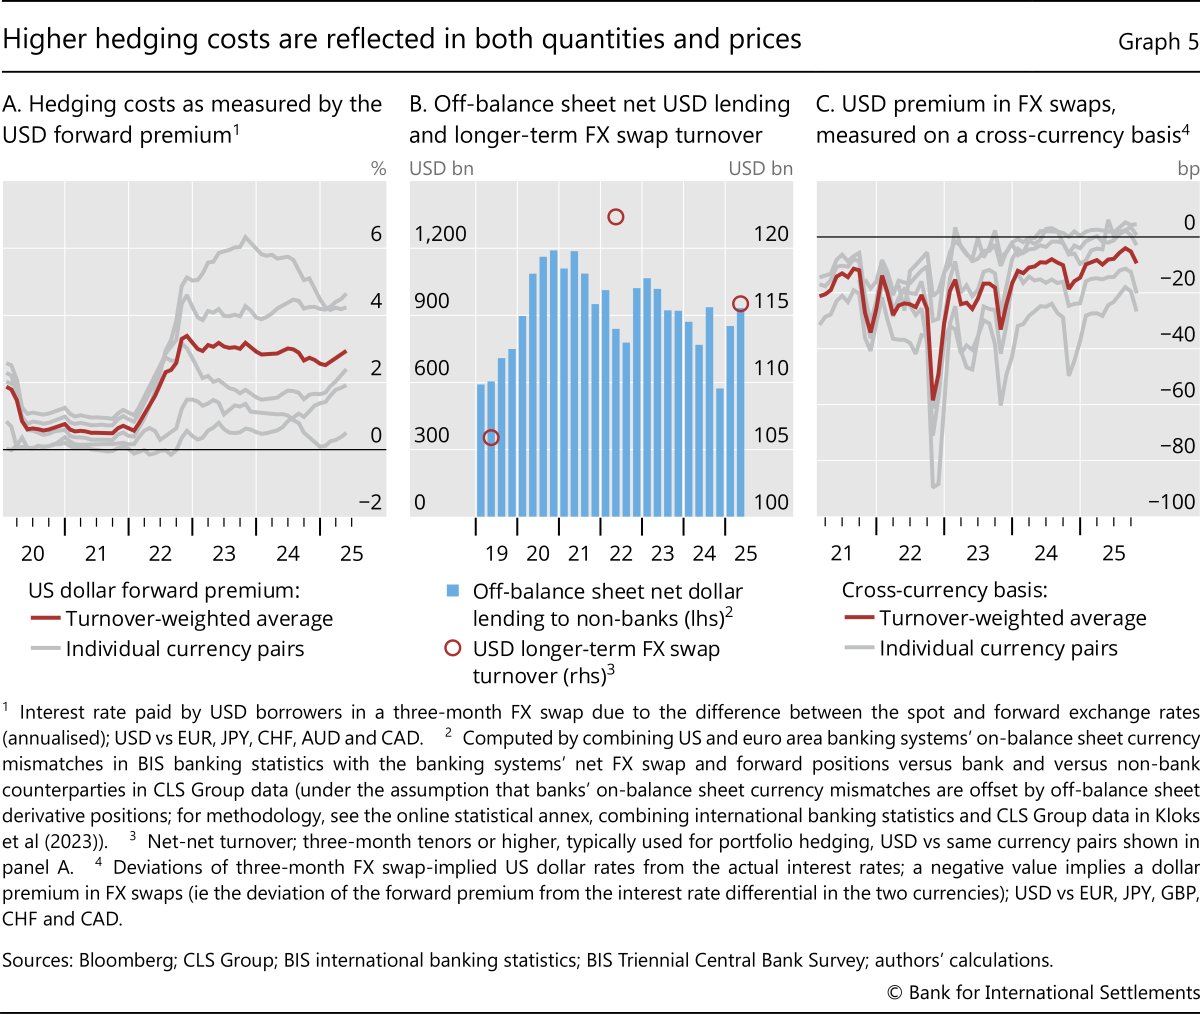
This global contraction in FX hedging activity between 2022 and 2025 is evident in the evolution of dealer banks' FX derivatives positions and in pricing data. US and European banks' net outstanding off-balance sheet dollar lending to non-banks fell from about $1 trillion in 2021 to as low as $600 billion in late 2024 (Graph 5.B, bars), consistent with weaker demand for dollar hedging from non-bank customers. Data on turnover of FX swaps tell a similar story: turnover in tenors most often used for hedging (eg three-month or higher) and in currencies with high hedging costs contracted between 2022 and 2025 (Graph 5.B, circles). The monthly imputed series (see Graph 2) points to an overall decline in FX swap and forward trading volumes during the Federal Reserve's rate hiking phase (2022–23). Consistent with less demand for hedging dollar positions with FX swaps (see eg Borio et al (2016)), the cross-currency basis narrowed during this period (Graph 5.C).
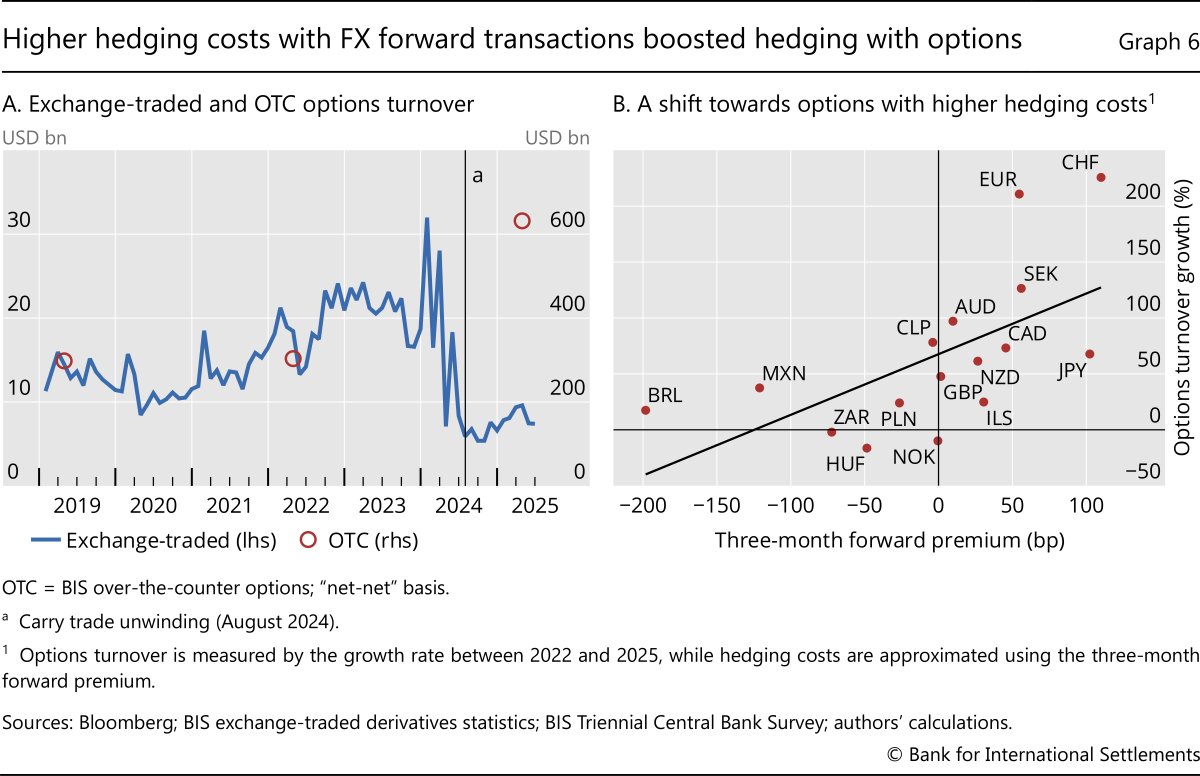
With higher hedging costs for FX swaps and forwards, some market participants turned to options as a hedging tool.11 Turnover in exchange-traded currency options increased in 2022–23, from less than $15 billion to almost $25 billion per day (Graph 6.A). Moreover, turnover in OTC currency options more than doubled between 2022 and 2025, from $303 billion to $634 billion (after remaining virtually unchanged between 2019 and 2022). Options turnover increased the most for the currencies where the costs of hedging via forwards rose (Graph 6.B), suggesting that investors substituted options for forwards.12 While options trading in emerging market economy (EME) currencies followed this general pattern, they fell on the opposite end of the spectrum, as a number of EMEs, particularly in Latin America, raised interest rates higher and ahead of the United States (see Box C for a discussion on the evolution of EME currency trading).
Interbank FX swaps stagnated while forwards rose
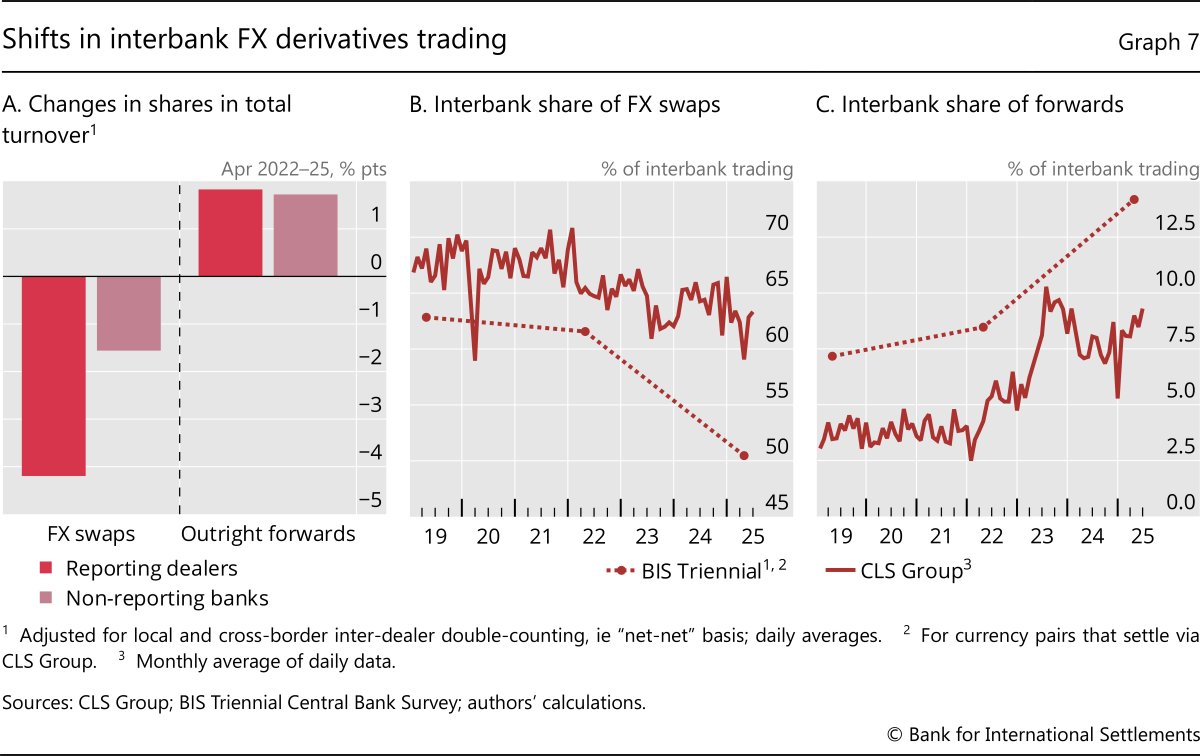
In the interbank segment, turnover of FX swaps grew little relative to 2022, whereas that of forwards gained importance (Graph 7.A). Monthly data from CLS Group reveal that these shifts started in 2022, coinciding with the onset of monetary policy tightening by major central banks (Graphs 7.B and 7.C). The shifts may have reflected factors related to liquidity management, arbitrage and hedging of customer trades.
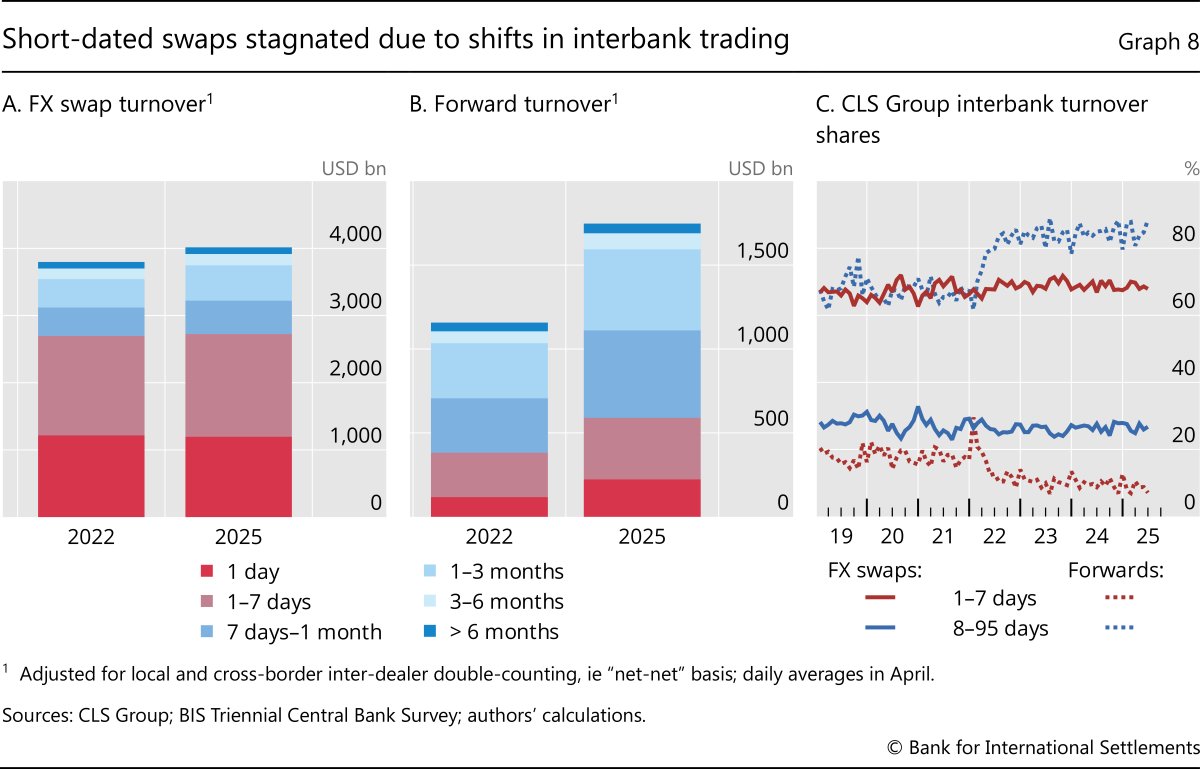
First, the different pace of QT, which accompanied monetary policy tightening,13 altered liquidity conditions across currency areas, in many cases, reducing banks' incentives to shift liquidity across currencies. This dampened turnover in short-maturity swaps used for liquidity management – ie tenors of one week or less (Graph 8.A). Because these swaps are rolled over frequently and account for the bulk of FX swap turnover, their stagnation weighed disproportionately on overall FX swap growth.
Second, and related, the narrower cross-currency basis, in large part due to the aforementioned weaker funding demand via FX swaps (see Graph 5), probably reduced banks' activity in cross-currency basis trades. This includes both less funding and less arbitrage activity on their own books and a reduced need to offload client positions via interbank FX swaps.
Third, banks may have turned to forwards in the inter-dealer segment to hedge some positions with clients. Instead of rolling over short-maturity swaps to hedge longer-dated client exposures, banks could enter longer-dated forward positions directly. This substitution helps explain both the stagnation in very short-dated swap turnover and the expansion of forward turnover in longer-term buckets (eg one week to three months) (Graph 8.B). CLS Group data confirm this expansion since 2022 (Graph 8.C).14 15
Conclusion
Global FX trading volumes reached a new high in April 2025, with average daily turnover of $9.5 trillion. Estimates based on higher-frequency benchmarks suggest that more than $1.5 trillion of this turnover resulted from a trading surge following US tariff announcements and sudden dollar depreciation. Investors' relatively low hedge ratios going into April, reflecting higher hedging costs since 2022, amplified this surge.
The FX market appeared to act as a shock absorber during the turbulence in April 2025. Many market participants adjusted to higher perceived risks in their dollar investments via FX derivatives rather than resorting to sales of underlying assets. They increased their currency hedge ratios and sold dollars forward using FX derivatives to counteract the risk of any further depreciation.
Despite volatile market conditions, dealers demonstrated an even greater capacity to internalise client trades than in previous years. High internalisation was probably supported by the internal capital markets of banking groups, with intragroup trading increasing significantly across all instruments. Such non-visible intermediation reduced the impact of client trades on the market and probably contributed to resilient market functioning during the volatile conditions in April 2025.16
References
Aquilina, M, M Lombardi, A Schrimpf and V Sushko (2024): "The market turbulence and carry trade unwind of August 2024", BIS Bulletin, no 90, August.
Avdjiev, S, P McGuire and G von Peter (2025): "International finance through the lens of BIS statistics: derivatives markets", BIS Quarterly Review, December.
Bank for International Settlements (BIS) (2025): Triennial Central Bank Survey of Foreign Exchange and Over-the-counter (OTC) Derivatives Markets in 2025, September.
Bank of Japan (2025): Financial System Report, October.
Bech, M (2012): "FX volume during the financial crisis and now", BIS Quarterly Review, March, pp 33–43.
Bech, M and J Sobrun (2013): "FX market trends before, between and beyond Triennial Surveys", BIS Quarterly Review, December, pp 45–54.
Boissay, F and W Huang (2025): "The safe haven properties of US Treasuries and portfolio flows of global investors", BIS Quarterly Review, September, pp 9–10.
Borio, C, M Iqbal, R McCauley, P McGuire and V Sushko (2016): "The failure of covered interest parity: FX hedging demand and costly balance sheets", BIS Working Papers, no 590, October.
Cabellero, J, A Maurin, P Wooldridge and D Xia (2022): "The internationalisation of EME currency trading", BIS Quarterly Review, December, pp 49–65.
Chaboud, A, D Rime and V Sushko (2023): "The foreign exchange market", in R Gürkaynak and J Wright, eds, Research Handbook of Financial Markets, Edward Elgar Publishing, pp 253–75 Danmarks Nationalbank (2025): "Insurance companies and pension funds hedge more against dollar decline", Statistical news, 3 July.
De Nederlandsche Bank (2025): "Weaker US dollar hits pension funds harder than falling stock prices", Statistical news, 17 June.
Drehmann, M and V Sushko (2022): "The global foreign exchange market in a higher-volatility environment", BIS Quarterly Review, December, pp 33–48.
Du, W and A Huber (2024): "Dollar asset holdings and hedging around the globe," NBER Working Paper, no 32453, May.
Du, W, A Tepper and A Verdelhan (2018): "Deviations from covered interest rate parity," Journal of Finance, vol 73, no 3, pp 915–57.
Ehlers, T and K Todorov (2025): "Goodbye Libor, hello basis traders: unpacking the surge in global interest rate derivatives turnover", BIS Quarterly Review, December.
Hardy, B, P McGuire and G von Peter (2024): "International finance through the lens of BIS statistics: the geography of banks' operations", BIS Quarterly Review, December, pp 69–86.
Hauser, A (2025): "A hedge between keeps friendship green: could global fragmentation change the way Australian investors think about currency risk?", remarks for a function hosted by CLS Bank International and NAB, Sydney, 16 September.
Hermes, F, M Schmeling and A Schrimpf (2025): "The international dimension of repo: five new facts", ECB Working Paper Series, no 3065.
International Monetary Fund (2025): "Risk and resilience in the global foreign exchange market", Global Financial Stability Report, October, pp 47–76.
Kloks, P, P McGuire, A Ranaldo and V Sushko (2023): "Bank positions in FX swaps, insights from CLS", BIS Quarterly Review, September, pp 17–31.
Kubitza, C, J-D Sigaux and Q Vandeweyer (2025): "The implications of CIP deviations for international capital flows", ECB Working Paper Series, no 3017.
Nenova, T, A Schrimpf and H S Shin (2025): "Global portfolio investment and FX derivatives," BIS Working Papers, no 1273, June.
Ranaldo, A (2023): "Foreign exchange swaps and cross-currency swaps," in R Gürkaynak and J Wright (eds), Research Handbook of Financial Markets, Edward Elgar Publishing, pp 451–69.
Shin, H S (2025): "Why the world started hedging its US dollar exposures", Odd Lots, 23 October.
Shin, H S, P Wooldridge and D Xia (2025): "US dollar's slide in April 2025: the role of FX hedging," BIS Bulletin, no 105, June.
Annex A
Footnotes
1 The views expressed in this publication are those of the authors and not necessarily those of the BIS or its member central banks. We thank Alain Chaboud, Mikael Charoze, Mathias Drehmann, Gaston Gelos, Hinako Kijima, Patrick McGuire, Daniel Rees, Dagfinn Rime, Andreas Schrimpf, Hyun Song Shin, Frank Smets and Goetz von Peter for helpful comments. We are also grateful to Kana Sasamoto and Jhuvesh Sobrun for invaluable research assistance.
2 Central banks and other authorities in 52 jurisdictions participated in the 2025 survey, collecting data from more than 1,100 banks and other dealers. See BIS (2025) for details on the preliminary survey results (www.bis.org/statistics/rpfx25_fx.htm), Chaboud et al (2023) for a primer on FX spot market structure, Ranaldo (2023) for information on FX swaps and currency swaps, and Avdjiev et al (2025), in this issue, for the concepts underlying the BIS derivatives statistics.
3 Interbank transactions disproportionately contribute to total turnover because of regular rollovers of short-term contracts in which their trading is concentrated.
4 The imputed measure is constructed from semiannual FX turnover surveys of major local FX committees and monthly trading volumes computed by the Continuous Linked Settlement Group (CLS Group) – a specialised financial market infrastructure that settles FX transactions in major currency pairs. The methodology seeks to make the growth rates in the imputed series match those of the higher-frequency series as closely as possible, while ensuring that the imputed series matches the low-frequency series. See Bech (2012) and Bech and Sobrun (2013).
5 For example, banks also use ultra short-term (overnight) forward and FX swap positions for intragroup management of liquidity and currency mismatches (Drehmann and Sushko (2022)). More broadly, this speaks to the rising importance of internal capital markets in banking operations (Hardy et al (2024)) and in their OTC market transactions, such as repurchase agreements (Hermes et al (2025)).
6 Boissay and Huang (2025) show that while some non-US investors sold significant volumes of US assets in April 2025, most of these flows reversed in May and June.
7 Based on outstanding data, less than half of outstanding outright forward and FX swaps globally settled through CLS Group. Most interbank trades but only a fraction of trades with non-bank counterparties, which use forwards more intensively, settle via CLS Group. Thus, while a reliable indicator for FX swaps, the figure understates US dollar forward sales by non-banks by a significant multiple (see Kloks et al (2023)).
8 When hedging via FX swaps, investors exchange local currency for US dollars. The forward leg locks the future exchange rate and embeds the interest rate differential, which sets the hedging cost. In practice, hedging costs can differ from interest rate differential by a small cross-currency basis (Du et al (2018)).
9 Kubitza et al (2025) discuss how rollover risk affects investors' portfolio rebalancing activity; Nenova et al (2025) document the close relationship between FX derivatives and bond market conditions.
10 FX hedge ratios among insurers are higher than those for pension funds or mutual funds (although pension fund hedging policies can differ markedly across jurisdictions) (Du and Huber (2024)).
11 Options are more attractive than forwards when interest rate differentials are wide and FX volatility low. In these periods, participants may use option spread strategies, which economise on hedging costs. A basic example is a collar – buying an out-of-money put and selling an out-of-money call.
12 While options hedge future cash flows and returns, investors still need swaps to fund initial investments. When purchasing foreign assets such as bonds, they often use FX swaps or currency swaps to exchange their domestic currency for foreign currency in order to fund the investment.
13 The Federal Reserve reintroduced QT in June 2022, while the ECB and the Bank of Japan began QT in March 2023 and March 2024, respectively.
14 Trading of forwards has also been facilitated by inter-dealer electronic brokers beginning to onboard this instrument. For example, the share of forwards traded via electronic brokers in London doubled, from 14% to 28%, between 2022 and 2025, according to the London FX committee survey.
15 The shifts in monetary policy also affected the composition of interest rate derivatives turnover, with greater trading of interest rate futures in one-month and similar tenors (Ehlers and Todorov (2025), in this issue).
16 See International Monetary Fund (2025) for a dedicated analysis of the risk and resilience of the global FX market, as well as an analysis of trading around the April 2025 events.