FX market trends before, between and beyond Triennial Surveys
This special feature looks at trading activity in the foreign exchange market between the Triennial Surveys conducted in 2010 and 2013 and in the months following. We estimate that the $5.3 trillion per day reported for April 2013 was a peak, with activity falling subsequently by $300 billion to $5 trillion per day in October. The decrease in activity was primarily driven by a drop in spot transactions involving mainly euros or yen against the US dollar. The decline in euro trading extends a trend that began in the third quarter of 2011, while the fall in yen trading reflects a partial reversal of a sharp rise that occurred in late 2012 and early 2013.1
JEL classification: C82, F31, G15.
Every three years, the Triennial Central Bank Survey of foreign exchange market activity ("the Triennial") provides a detailed snapshot of the global foreign exchange (FX) market during the month of April. By increasing market transparency, the survey aims to help policymakers and market participants to monitor patterns of activity and exposures. The Triennial is coordinated by the BIS under the auspices of the Markets Committee2 and has been conducted since 1989.
The Triennial offers unrivalled coverage in terms of geography, instruments and currencies. The latest survey involved 53 jurisdictions and some 1,300 banks and other dealers. It reports turnover in spot, outright forward, FX swap, currency swap and FX option transactions in 40 different currencies. Moreover, the data are broken down by several categories, including type of counterparty, execution method, trading relationship and maturity.
The Triennial's comprehensive nature is its greatest strength, but also its weakness. The data collection process is resource-intensive and hence not practical to conduct more often. Fortunately, the Triennial is not the only source of information on global FX market activity.
A number of central bank-sponsored industry groups, known as foreign exchange committees (FXCs), conduct semiannual surveys on market turnover in their respective jurisdictions. As such, the FXC surveys provide a significant improvement in reporting frequency - but six months is still a long time in the ever changing FX market. In this respect, electronic trading platforms and settlement systems are helpful, as they provide information on FX market turnover at even higher frequencies.
Nonetheless, a number of challenges emerge when using these alternative sources. For instance, the currencies of many smaller or emerging market economies are not (or only sparsely) covered by the FXC surveys or are not eligible for trading or settlement in the respective systems. Moreover, computing global aggregates is tricky due to methodological differences and data limitations. For example, only the Triennial corrects for double-counting of transactions across jurisdictions.
Bech (2012) uses a statistical technique known as benchmarking to overcome some of these difficulties. The result is a monthly time series of global FX market activity that is consistent with the global turnover number from the Triennial. In this special feature, we update that analysis using data up to October 2013.
Moreover, we show how the benchmarking technique provides further insights about FX activity trends before, between and beyond Triennials. Before the release of the latest survey, the benchmarking technique estimated that daily average FX trading activity in April 2013 was in the $5.2-$5.5 trillion range. Between the two most recent Triennials, we show that turnover probably reached $5 trillion per day around August 2011 before falling back below $4.5 trillion in October 2012. However, in late 2012 trading activity surged - reaching $5.3 trillion in April 2013. Beyond the last Triennial, we estimate that activity has been falling, by about 6% to $5 trillion in October.
Furthermore, by using new and more detailed data from the leading settlement system for FX transactions (CLS Bank), we compute monthly turnover series broken down by FX instrument and currency pair. The disaggregated series show that the drop in turnover since April has been driven by a fall in FX spot transactions. In particular, trading involving the euro and the yen has declined. The fall in euro trading extends a trend that began in the third quarter of 2011, while the decrease in yen trading reflects a partial reversal of a sharp rise that occurred in late 2012 and early 2013.
Sources of data on FX market activity
In general, there are two types of data sources on FX market activity: surveys of financial institutions, and turnover data obtained from either trading platforms or settlement systems. In addition to the Triennial, we use data from the semiannual surveys of markets in Australia, Canada, London, New York, Singapore and Tokyo as well as monthly data from CLS Bank.
Foreign exchange committee surveys
Several central banks in the world's major FX centres sponsor FXCs, which provide a forum for market participants to discuss issues of common interest.3 In order to supply more frequent information on the size and structure of FX trading activity, the committees conduct semiannual volume surveys of their respective markets, carried out in April and October. The survey results are released in a coordinated fashion roughly three months after the survey month. The latest set of results, covering April 2013, was released on 29 July. Graph 1 shows the level of activity across the different markets and time.
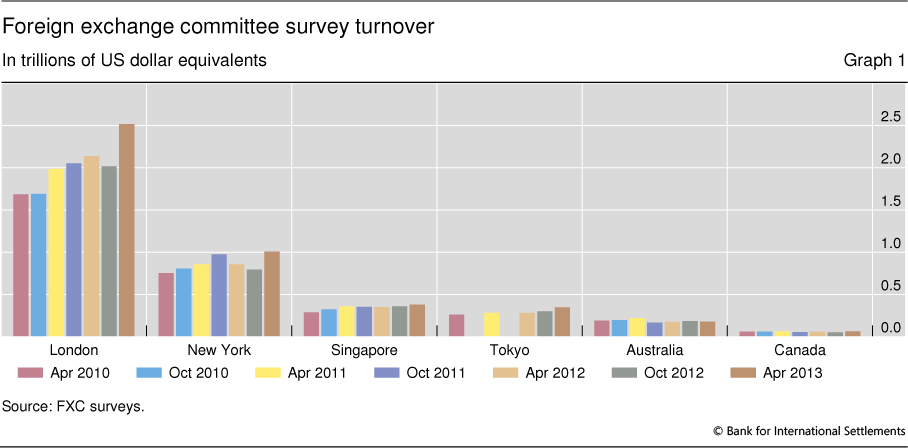
Like the Triennial, the FXC surveys show that most trading takes place in London. At about $2.5 trillion per day in April 2013, the reported London turnover is larger than all the other surveyed markets put together. According to FXC surveys, FX trading activity increased by some 40%, on a weighted basis, between April 2010 and April 2013 - broadly in line with the growth of 35% reported by the Triennial (Rime and Schrimpf (2013)).
CLS Bank4
CLS Bank International (CLS) is the main settlement institution for FX transactions. It was founded in response to concerns raised by the G10 central banks about settlement risk in those transactions (BIS (1996)). CLS eliminates the risk by ensuring that settlement of both legs of an FX transaction occurs simultaneously - a process known as payment versus payment (PVP) (Galati (2002)). Settlements have grown sharply since its start in 2002, reflecting a combination of market growth and increasing market share. CLS currently settles FX transactions in 17 currencies.5
Based on the settlement instructions processed across its books, CLS publishes monthly reports on the number and value of FX transactions traded between participants (Graph 2).6 In addition to the aggregate numbers, CLS also reports breakdowns by instrument and currency pair.7 The CLS information is usually available within a couple of weeks after the turn of the month. For example, the report covering October 2013 was published on 14 November.
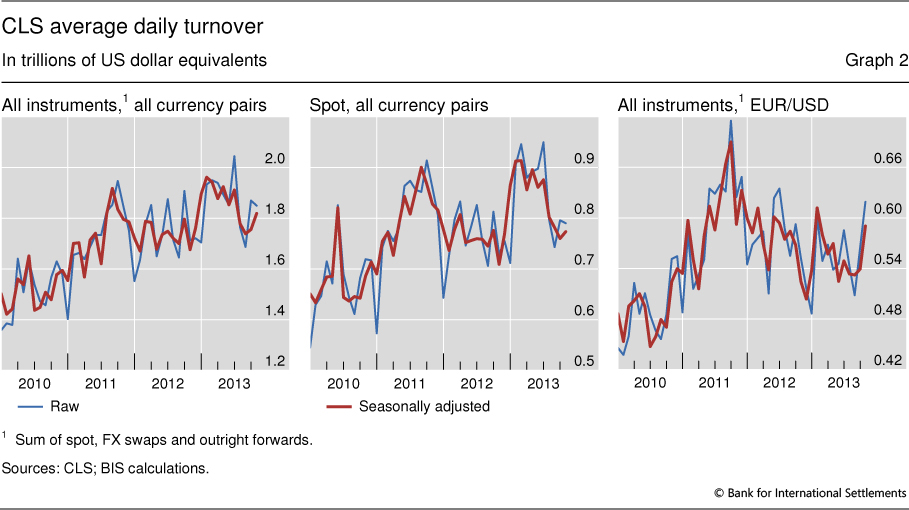
A potential issue with the CLS information is that it can be hard to distinguish overall market trends from market share trends. For instance, CLS regularly adds new users.8 And due to the data's monthly frequency, seasonal patterns and/or calendar effects can be a problem when analysing turnover trends. The data available for this analysis start in January 2010.
Benchmarking FX activity
Following Bech (2012), we use benchmarking to translate the information from the FXC surveys and CLS into monthly estimates of trading activity that are consistent with the numbers reported in the Triennial. The underlying premise is that the Triennial provides the most reliable information on the level of global FX turnover, followed by the FXC surveys and the data from CLS. However, FXC and CLS data are available at higher frequencies and are published more quickly.
We apply a three-step approach to arrive at the monthly series. First, we construct aggregate volume series for the FXC surveys. We do this by simply adding up the individually reported volumes while adjusting - using simple interpolation - for the fact that the Japanese survey was conducted only annually before October 2011 (Graph 3, left-hand panel).9
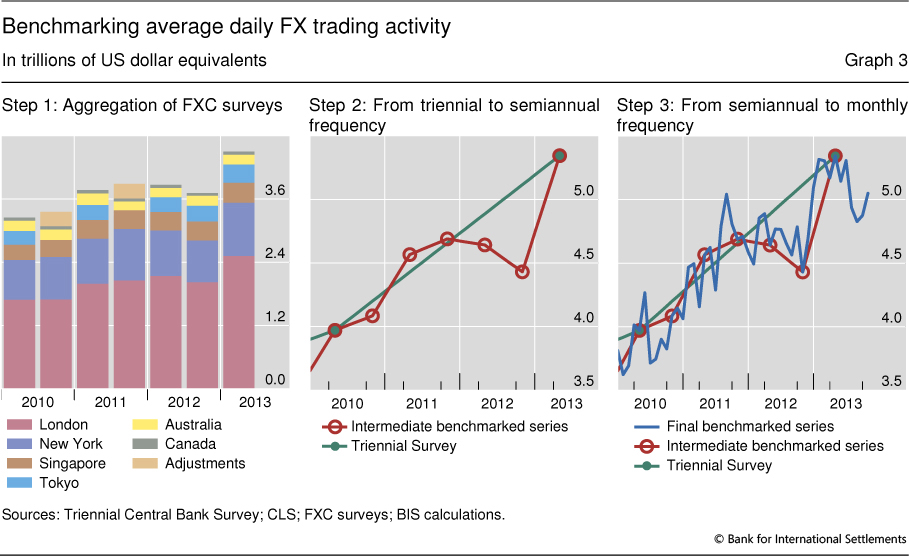
Second, we use this aggregate volume series for the FXC surveys to convert the Triennial numbers to a semiannual series. Here we rely on the proportional Denton technique (see box), which preserves the movement in the FXC series as closely as possible while ensuring the resulting series matches the data points provided by the Triennial (Graph 3, centre panel). Finally, we use the same method to convert the constructed semiannual series to monthly frequency using seasonally adjusted data on average daily trading activity from CLS (Graph 3, right-hand panel).
Our analysis shows that global turnover rose from $4 trillion in April 2010 to over $5 trillion in August 2011 only to fall below $4.5 trillion in October 2012. In late 2012, however, expectations of a major shift in monetary policy in Japan led to a significant jump in trading activity.10 Since April, total turnover is estimated to have dropped by roughly $300 billion to around $5 trillion.
The proportional Denton technique and updating as new information arrives
The proportional Denton technique is based on the principle of movement preservation (Bloem et al (2001)). It seeks to make the growth rates in the benchmarked series match those of the higher-frequency indicator series as closely as possible. At the same time, it ensures that the benchmarked series matches the lower-frequency (but more reliable) series when the latter is available. "Closeness" is achieved by minimising the sum of squared deviations in the growth rates of the two series. In mathematical terms, the technique can be written as
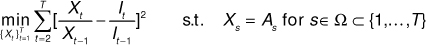
where  is the benchmarked series, ie the outcome of the procedure,
  is the related high-frequency (or indicator) series,
  is the low-frequency series and Ω is the set of dates at which the low-frequency series is observed. See the appendix in Bech (2012) for details on how to solve this problem.
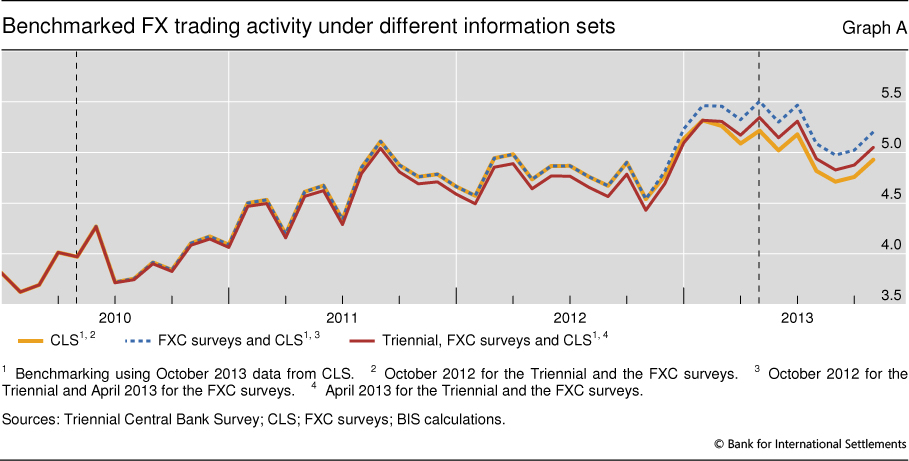
An important feature of the benchmarking approach is that the values are updated as new information arrives. Graph A illustrates this using the publication of the 2013 Triennial as an example. When CLS data became available in early May, global FX turnover was estimated to be roughly $5.2 trillion in April 2013. However, the turnover number for April was revised to $5.5 trillion when the FXC surveys were released in late July. Finally, when the Triennial was published in September 2013, the April 2013 number was updated to match the reported $5.3 trillion on average per day. This change then led to a revision of all values back to the previous Triennial in April 2010 due to the minimisation of squared deviations described above.
In a similar manner, the current predictions beyond April 2013 will be revised when the October 2013 FXC surveys are released in late January 2014, and again when the next Triennial is published in 2016.
Trading activity by instrument and currency pair
An improvement relative to Bech (2012) is that more detailed data from CLS allow us to compute monthly turnover numbers broken down by CLS-eligible FX instrument (spot, FX swap and outright forwards)11 and currency pair.
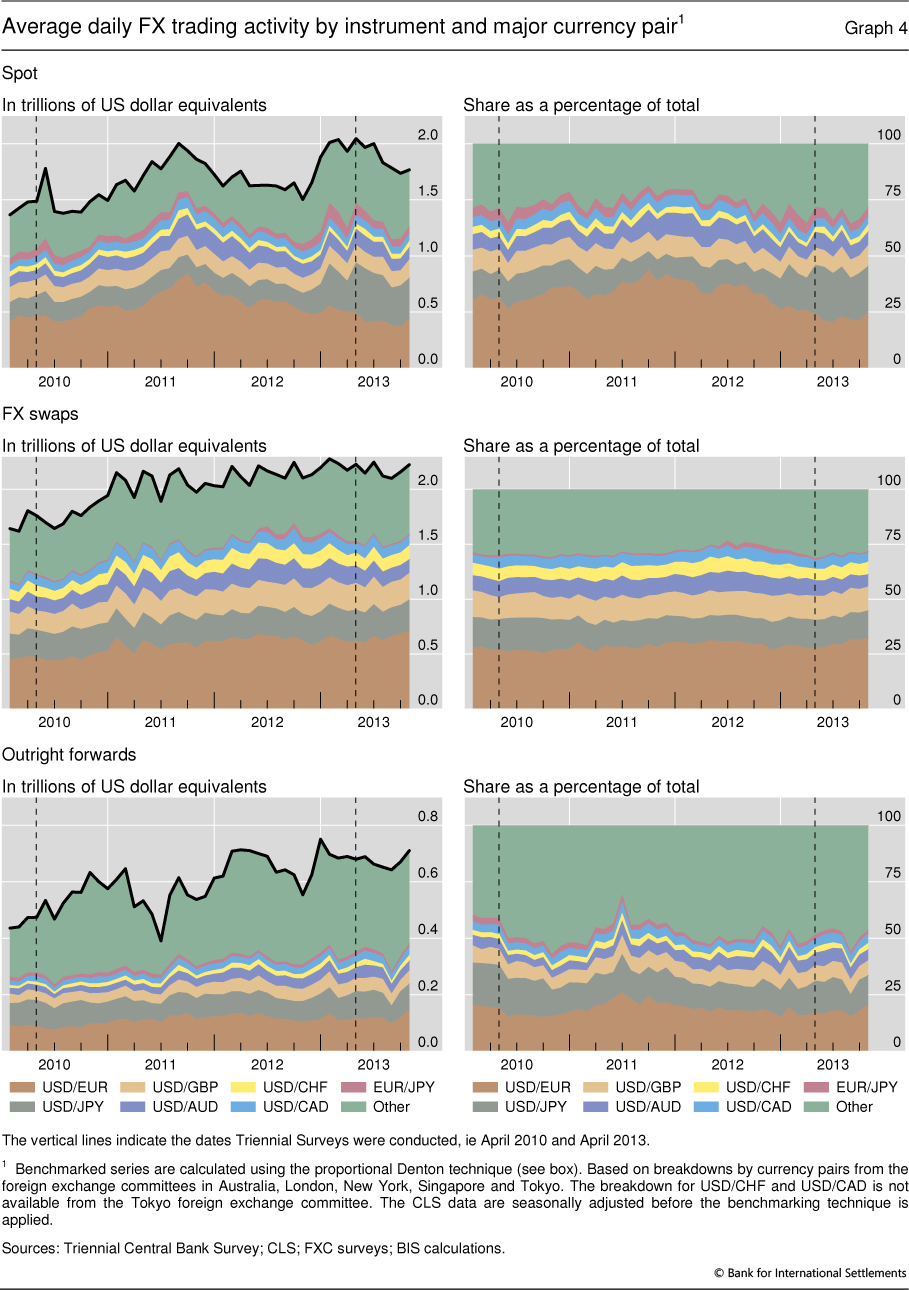
Graph 4 shows the results for seven major currency pairs and an "other" category.12 The left-hand panels show the daily average value traded for each instrument by currency pair since January 2010. The right-hand panels show the relative share of the different currency pairs for each instrument over the same period. The turnover developments for the different instruments and individual currency pairs are markedly different.
Looking across FX instruments, trading activity for spot transactions and outright forwards has been more volatile than for FX swaps. For instance, spot transactions reached $2.0 trillion on average per day in August 2011 but then fell to $1.5 trillion per day in October 2012 before jumping above $2.0 trillion again in early 2013. Subsequently, spot turnover dropped to $1.8 trillion on average per day. In contrast, trading activity in FX swaps fluctuated between $2.0 trillion and $2.2 trillion per day since early 2011. The disaggregation by instrument also shows that the spike in aggregate activity in late 2012 and early 2013 was driven by increases in spot transactions and outright forwards rather than FX swaps.13
Looking at individual currency pairs provides further insights. The most striking trends relate to transactions involving the euro and the yen. Euro trading has diminished since late 2011. Between September 2011 and October 2013, spot trading of the euro vis-à-vis the US dollar fell by $400 billion, corresponding to a drop from 40% to 25% in this currency pair's share in all spot transactions (Graph 4, top left-hand panel). At the same time, trading in other instruments registered moderate increases. This resulted in euro trading in all instruments against the US dollar moving from $1.6 trillion in September 2011 to $1.3 trillion in October 2013 (Graph 5, left-hand panel).
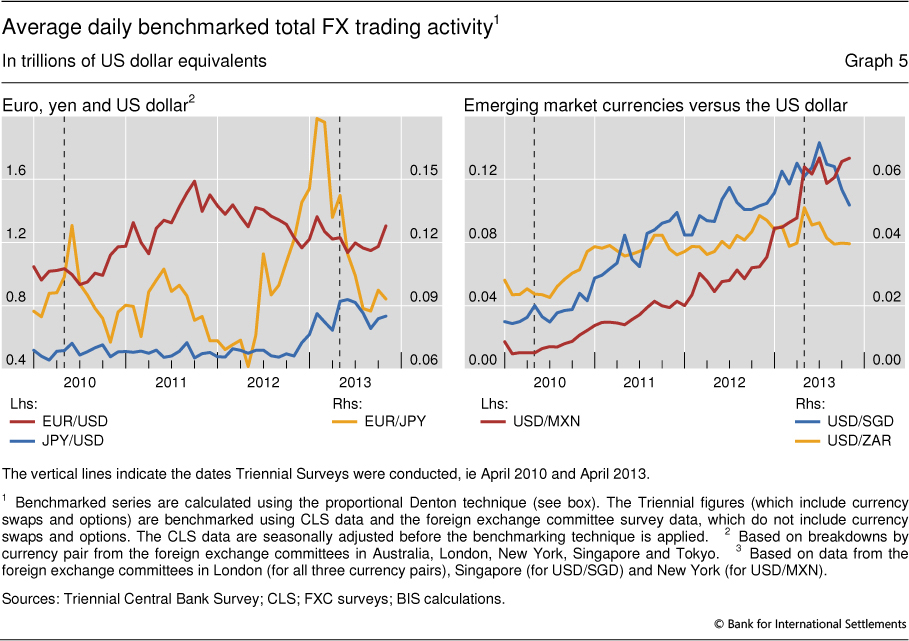
In contrast, trading in the yen was fairly stable until late 2012, after which it rose significantly. Against the US dollar, trading was around $500 billion per day since early 2010 but rose to over $800 billion per day in April 2013, before falling back to roughly $700 billion per day in October 2013. EUR/JPY also saw a significant increase in late 2012 and early 2013.
A key finding of the Triennial is the significant increase in turnover of emerging market currencies such as the Mexican peso and Chinese renminbi (Ehlers and Packer (2013)). Our approach can shed further light on these developments to the extent that the currencies in question are covered by the FXC surveys and eligible for settlement by CLS. The right-hand panel of Graph 5 shows the rapid increase in the benchmarked turnover for the Mexican peso, the Singapore dollar and the South African rand vis-à-vis the US dollar since 2010.
Conclusion
The FX market is one of the largest financial markets, but owing to its decentralised structure timely information on quantitative developments is not always easy to come by. In this article, we show how different sources of data on FX activity can be leveraged to obtain a more timely understanding of turnover developments. We produce monthly time series - both in aggregate and broken down by instrument and major currency pair - that, despite some caveats, are comparable to the figures from the BIS Triennial Survey.
The results show that the $5.3 trillion per day reported by the Triennial for April 2013 was a local peak, with activity falling to $5 trillion per day in October 2013. The fall in activity was primarily driven by a drop in spot transactions involving the euro or yen. The fall in euro trading extends a trend that started in the latter part of 2011, whereas the fall in yen trading reflects a partial reversal of a sharp rise in late 2012 and early 2013.
References
Bank for International Settlements (1996): "Settlement risk in foreign exchange transactions", CPSS Publications, no 17, March.
--- (2013): "Markets under the spell of monetary easing", BIS Quarterly Review, June 2013, pp 1-11.
Bech, M (2012): "FX volume during the financial crisis and now", BIS Quarterly Review, March 2012, pp 43-53.
Bloem, A, R Dippelsman and N Maehle (2001): "Quarterly National Accounts Manual - concepts, data sources, and compilation", International Monetary Fund, www.imf.org/external/pubs/ft/qna/2000/textbook.
Ehlers, T and F Packer (2013): "FX and derivatives markets in emerging economies and the internationalisation of their currencies", BIS Quarterly Review, December.
Galati, G (2002): "Settlement risk in foreign exchange markets and CLS Bank", BIS Quarterly Review, December, pp 55-66.
Rime, D and A Schrimpf (2013): "The anatomy of the global FX market through the lens of the 2013 Triennial Survey", BIS Quarterly Review, December.
1 The views expressed in this article are those of the authors and do not necessarily reflect those of the BIS. We are grateful to Claudio Borio, Maria Canelli, Andreas Schrimpf and Philip Wooldridge for useful comments on earlier drafts.
2 See www.bis.org/about/factmktc.htm.
3 The current slate of committees includes: the Foreign Exchange Joint Standing Committee (FXJSC) in London, the Foreign Exchange Committee (FXC) in New York, the Singapore Foreign Exchange Market Committee (SFEMC), the Tokyo Foreign Exchange Market Committee (TFEMC), the Australian Foreign Exchange Committee (AFXC) and the Canadian Foreign Exchange Committee (CFEC).
4 See www.cls-group.com for further information.
5 Australian dollar, Canadian dollar, Danish krone, euro, Hong Kong dollar, Israeli shekel, Japanese yen, Korean won, Mexican peso, New Zealand dollar, Norwegian krone, Singapore dollar, South African rand, Swedish krona, Swiss franc, pound sterling and US dollar.
6 See www.cls-group.com/MarketInsight/Pages/ReportArchive.aspx. Bech (2012) uses information on the value of settlements.
7 CLS reports the value of the currency bought or, for derivatives, the far leg of the trade - consistent with the methodology used in the Triennial and FXC surveys.
8 The latest currencies added were the Israeli shekel and the Mexican peso (May 2008).
9 The FXC surveys differ from the Triennial in a couple of ways. First, there are methodological differences. For example, the Triennial collects data based on the location of the sales desk, whereas some of the FXC surveys are based on the location of the trading desk. Second, while the FXC surveys correct for double reporting of trades between reporting entities within its jurisdiction, only the Triennial corrects for double-counting of trades across jurisdictions.
10 On 4 April 2013, the Bank of Japan unveiled a new policy framework aimed at ending deflation, known as Quantitative and Qualitative Monetary Easing. See BIS (2013), p 5.
11 According to the latest Triennial, these three instruments account for 93% of turnover.
12 According the latest Triennial, the currency pairs shown in the graph accounted for 65% of FX trading.
13 Based on information from the FXC surveys, we estimate that daily trading activity in currency swaps and options rose 32%, from $296 billion in October 2012 to $391 billion in April 2013. This large increase was mainly driven by JPY/USD transactions.