Bank positions in FX swaps: insights from CLS

A combination of CLS data with BIS statistics shows banks' FX swaps positions alongside the currency mismatches on their balance sheets1. It sheds light on global dollar flows via FX swaps in key currency pairs and, specifically, on banks' use of these instruments to hedge exchange rate risk, engage in arbitrage or serve customers. Compared with Japanese and euro area banks, US banks have played an outsize role in FX swap markets by using maturity transformation to intermediate in the interbank market and between banks and non-banks.
JEL codes: F31, F34, G15, G21.
Introduction
A typical day sees almost $4 trillion in new FX swap contracts, most of which involve a payment of US dollars (BIS (2022)). Unlike for repo and other forms of debt, the full attendant payment obligations arising from FX swaps are not reported on a balance sheet (Borio et al (2017, 2022)).
The market for FX swaps is two-tiered, with dealer banks at the core, as these instruments trade mainly over the counter (OTC). The dealer-customer segment mostly serves the FX hedging purposes of financial and non-financial customers. In addition, dealer banks transact with each other to offset the imbalances that arise in trades with customers, and to manage liquidity and currency mismatches on their own balance sheets.
This feature examines how banks of various nationalities operate in the FX swap market. It draws on a novel data set (from CLSMarketData) of aggregated and anonymised outstanding FX swap and forward contracts (notional values) that are settled via CLS, the world's largest multi-currency cash settlement system (see Box A). These data provide a detailed picture of interbank positions as well as positions between banks and some of their non-bank customers, with breakdowns by currency pair, maturity and counterparty nationality (eg US banks vis-à-vis euro area banks).
The combination of CLS data and the BIS international banking statistics (IBS) offers a rough picture of banking systems' outstanding off-balance sheet FX derivatives positions in specific currency pairs alongside the corresponding onbalance sheet currency positions. It helps separate banks' interbank FX swap positions from their broader portfolio of FX derivatives – ie also including forwards and currency swaps. This in turn helps to track global currency flows via derivatives, in particular the channels through which banks accommodate their clients' FX hedging needs and maintain matched currency positions.
Key takeaways
- Combining CLS and BIS data helps to track global dollar flows via FX derivatives in key currency pairs and reveals how these flows relate to banks' on-balance sheet currency positions.
- US and euro area banks are net providers of US dollars via FX derivatives to Japanese banks and institutional investors in need of FX hedging services.
- US banks use FX swaps to borrow dollars short-term from other banks and lend them longer-term to non-banks. This means that US banks are net interbank dollar borrowers in FX swaps.
This feature presents three findings related to banks' lending and borrowing of US dollars against other key currencies via FX derivatives.
First, dollar lending via FX derivatives has grown as this activity has become lucrative. The dollar basis, ie the premium earned (over money market rates) by lending dollars against other currencies via an FX derivative, has profited banks with ample dollar cash funding. An estimate of US and euro area banks' combined net lending of dollars via FX derivatives surpassed $1 trillion in Q1 2021, more than triple the amount in mid-2013. Japanese banks have consistently been net dollar borrowers via FX derivatives.
Second, the combination of CLS and BIS data shows that banks tend to accommodate customer demand for FX hedging services by turning to the interbank FX swap market. For example, US banks' estimated net off-balance sheet dollar lending to customers grew significantly between 2016 and 2020. They offset this mainly by borrowing dollars via interbank FX swaps rather than via an adjustment of their on-balance sheet positions. Estimates for euro area and Japanese banks also show that shifts in interbank FX swaps offset changes in positions with customers.
Third, US banks stand out as pivotal FX swap intermediaries. In particular, Japanese banks that swap out of yen and into euros, and euro area banks swapping in the other direction, both transact via the US dollar mainly with US banks rather than with each other. In addition, US banks engage in maturity transformation in FX swaps involving the US dollar: they funnel dollars borrowed short term from other banks to non-banks seeking longer-term hedges. Somewhat counterintuitively, this has made US banks net dollar borrowers on the interbank market for FX swaps.
The feature proceeds as follows. The first section sets the stage with an overview of the OTC FX derivatives market, its size, the key currencies traded, and the major banking systems that transact in FX swaps. The second section explains how the available data capture banks' use of FX derivatives to hedge, engage in arbitrage or make markets. The third section examines the relationship between banks' on- and off-balance sheet currency positions and the integral role of interbank FX swaps. The final section concludes.
A two-tiered market with dealer banks at the core
Several types of OTC FX derivative – FX swaps, forwards and currency swaps – involve the exchange of principal (notional) amounts. In an FX swap, two parties exchange currencies (the spot leg) and agree to reverse the trade at a future date at a pre-agreed exchange rate (the forward leg). Once the spot leg is complete, all that remains is the forward leg, at which point the FX swap is indistinguishable from an outright forward. A currency swap is a longer-term swap in which coupons linked to the underlying interest rates are exchanged in addition to the principal.
These FX derivatives create huge payment obligations. The BIS OTC derivatives (OTCD) statistics, which capture outstanding (notional) amounts of internationally active banks in more than 50 jurisdictions, put the global total at $97 trillion in mid-2022 (Graph 1.A). Almost 90% involved the payment of US dollars. The total exceeded global GDP in 2021 ($96 trillion) as well as outstanding global external portfolio investment ($81 trillion) and international bank claims ($40 trillion) at end-2021.
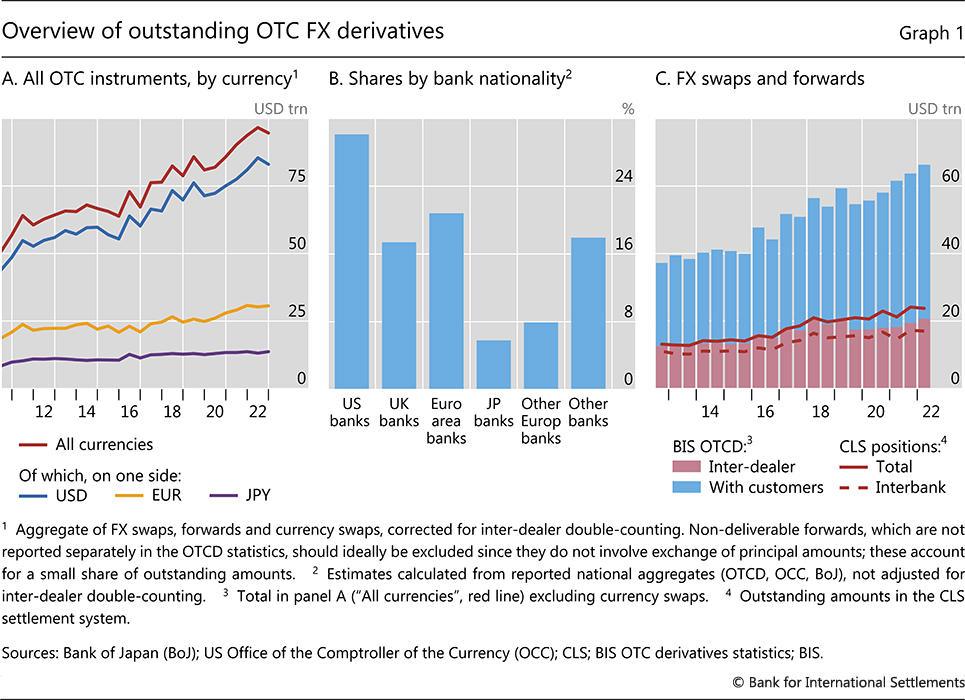
A relatively small number of banks account for the lion's share of outstanding OTC FX derivatives. Estimates derived from banks' financial disclosures at end-2022 suggest that the top five banks reported roughly a third of global outstanding positions and the top 25 banks more than 80%. US banks' sizeable share of the global market puts them well ahead of their euro area, UK and Japanese peers (Graph 1.B).
The most widely used instrument is the FX swap. The OTCD data show that the aggregate of FX swaps and forwards reached $66 trillion in mid-2022 (Graph 1.C, stacked bars), or roughly two thirds of outstanding OTC FX derivatives positions (Graph 1.A). The OTCD data do not separately identify FX swaps and forwards, but estimates derived using turnover data (BIS (2022)) suggest that FX swaps account for about two thirds of the FX swaps and forwards aggregate.
CLS data captured just over a third of the global FX swaps and forwards aggregate in the OTCD data (Graph 1.C, red solid line) in mid-2022. Since banks rely extensively on CLS to settle trades among themselves, CLS interbank positions come close to the inter-dealer positions in the OTCD statistics: $17 trillion (dashed red line) compared with $21 trillion (red bars). CLS data capture a much smaller share of global positions with customers (blue bars). Much of the analysis that follows relies on the granular CLS data for FX swaps.
Hedging, arbitrage and market-making
Banks transact in FX derivatives for at least three reasons. First, banks use derivatives to hold foreign currency assets on a hedged basis, in line with supervisory guidance (BCBS (1980, 2020)). Consider a bank with matched on-balance sheet US dollar and foreign currency assets and liabilities. Using an FX swap, this bank can exchange dollar cash in hand for foreign currency to acquire and hold additional foreign currency assets on a hedged basis. Graph 2.A shows how this transaction introduces a mismatch on the balance sheet – a short dollar "currency gap" – that the off-balance sheet FX swap offsets. The FX swap locks in the forward rate at which the exchange is reversed in the future, thus eliminating the risk of currency movements for the contract's duration.
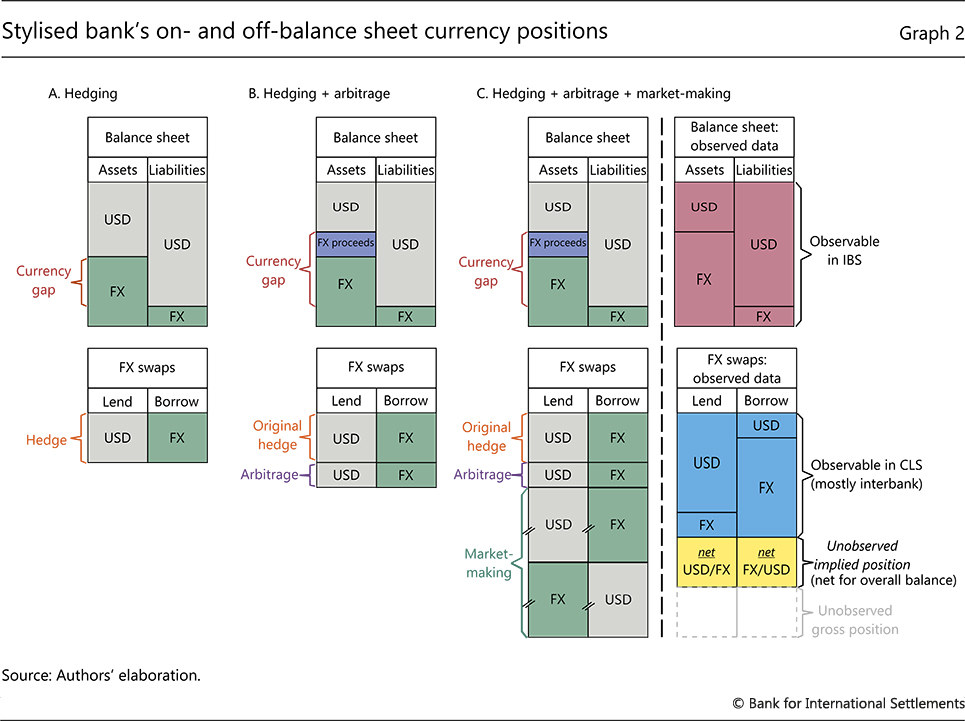
Banks also use FX derivatives to arbitrage, by lending dollars against other currencies to pick up the currency basis.2 In the example of Graph 2.B, the bank again lends out existing dollar cash and places the FX proceeds (purple area) from the spot leg of the FX swap in foreign currency assets. In terms of currency positions, the hedge and the arbitrage trades are observationally equivalent: both create an on-balance sheet mismatch that is offset with an off-balance sheet FX swap.
The motivations for the arbitrage and hedge trades differ. Banks target the basis pickup in an arbitrage trade but the foreign currency asset in the hedge trade. In the former case, they typically place the FX swap proceeds in safe liquid assets, eg a central bank deposit facility or short-term government bills (see Correa et al (2020), Rime et al (2022)). Banks may do so even when the assets have negative yields as long as the basis pickup offers sufficient compensation. Differentiating the two types of trade thus requires information about the composition of on-balance sheet foreign currency assets and the direction (ie positive or negative) of the currency basis.
Further reading:
Finally, top-tier banks make markets in FX derivatives. When servicing a customer that seeks to borrow dollars in an FX swap, a bank can source the dollars via additional on-balance sheet borrowing, which expands the balance sheet. Since there are regulatory constraints on balance sheet expansion, the bank can alternatively transact with another customer seeking to lend dollars via an FX swap. This creates an offsetting off-balance sheet position that does not require balance sheet space. By standing between end-use customers in this way, banks build up large gross (but offsetting) off-balance sheet forward positions to pay and receive particular currencies (Graph 2.C, left-hand column).
In practice, banks may treat net FX derivatives positions taken for hedging, arbitrage and market-making activities as fungible, in the sense that they manage the overall currency position from all activities.
CLS and BIS data together provide only a partial picture of banks' overall currency positions (Graph 2.C, right-hand column). Estimates of banks' on-balance sheet currency positions can be derived from the IBS (red shading), as described in the online statistical annex. However, CLS data capture only the off-balance currency positions that settle via CLS (blue shading), which are mainly interbank FX swap positions (recall Graph 1.C). This leaves unobserved a large portion of banks' FX swaps and forwards with non-banks, and the entirety of their currency swaps.
The analysis below focuses on banks' net on- and off-balance sheet positions in major currencies. It is grounded on the assumption that banks do not have "large" unhedged currency positions.3 With this assumption, CLS and IBS data can be used to derive the implied net position in non-CLS FX derivatives that is consistent with an overall hedged position (Graph 2.C, yellow shading).4 This, in turn, enables us to split banks' overall net off-balance sheet positions into two segments, in accordance with the two-tiered market structure. The first segment, interbank FX swaps (CLS data), consists of the short-term instruments that underpin market liquidity and price formation. The second segment, other FX derivatives (with banks and non-banks), consists of observed FX swaps with non-banks (CLS data) plus the implied (unobserved) net positions. The average maturity of positions in the second segment is longer than in the first segment (see Box A).5
Banks' on- and off-balance sheet currency positions
How do different banking systems use the interbank segment of the FX swap market to manage their net positions taken with customers? We address this question by combining the CLS and IBS data described above, paying particular attention to the flow of dollars via FX swaps between banks of different nationalities.
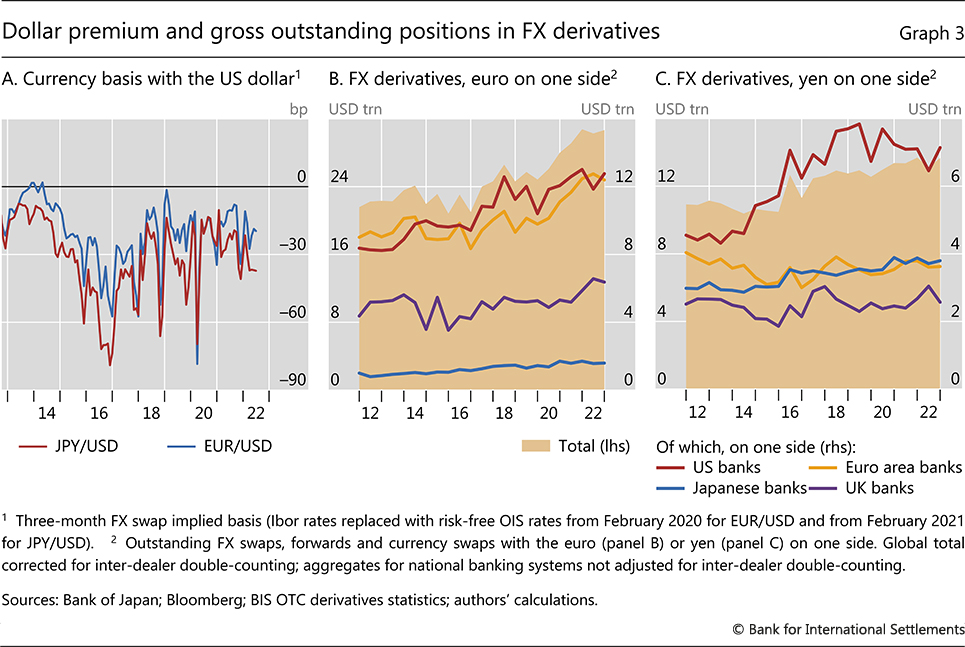
The analysis centres on banks' US dollar, euro and yen positions for two reasons. First, this currency trio captures a substantial portion of global dollar positions in FX derivatives, given that the EUR/USD and JPY/USD are the most-traded currency pairs (BIS (2022)). Second, the currency bases associated with these particular pairs (Graph 3.A) have profited dollar-lending banks.6 Changes in these bases inform movements in banks' net off-balance sheet positions in the analysis below.
Key players in FX derivatives with the euro and the yen
As dealers, US banks are the largest intermediaries in FX derivatives involving either the euro or the yen. Their gross outstanding FX derivatives involving the euro have stood near $12 trillion since 2016 (Graph 3.B), putting them on one side of roughly 40% of global euro positions and, until recently, ahead of euro area banks (for which the euro is the home currency). In addition, outstanding amounts involving the yen have stood close to $7 trillion since 2016 (Graph 3.C), putting US banks on one side of an even larger share of global yen positions.
Customers on the other side of these trades use FX derivatives mainly for hedging purposes.7 For example, European and Japanese institutional investors with large foreign currency asset portfolios hedge currency risk by borrowing foreign currency via FX derivatives. Given the size of their balance sheets and the high share of dollar assets in their portfolios, such entities generate a structural demand to borrow dollars via FX derivatives in both the EUR/USD and JPY/USD currency pairs.
In addition to hedging asset portfolios, financial and non-financial entities also use FX derivatives to hedge their own foreign currency borrowing. Entities at times issue longer-term debt in a currency they do not need, to take advantage of low borrowing costs in that currency. To avoid incurring an open currency position, they swap the proceeds back into their home currency (Munro and Wooldridge (2010)). Such issuers tend to use longer-term currency swaps so as to match the duration of the hedge with that of the debt liability. An example is a highly rated European borrower that issues dollar debt and swaps the proceeds into home currency, thus becoming a dollar supplier via FX derivatives. Another is a highly rated US corporate that issues yen debt and swaps the proceeds back into dollars, which makes it a dollar borrower via FX derivatives.
Net dollar lending and borrowing on and off the balance sheet
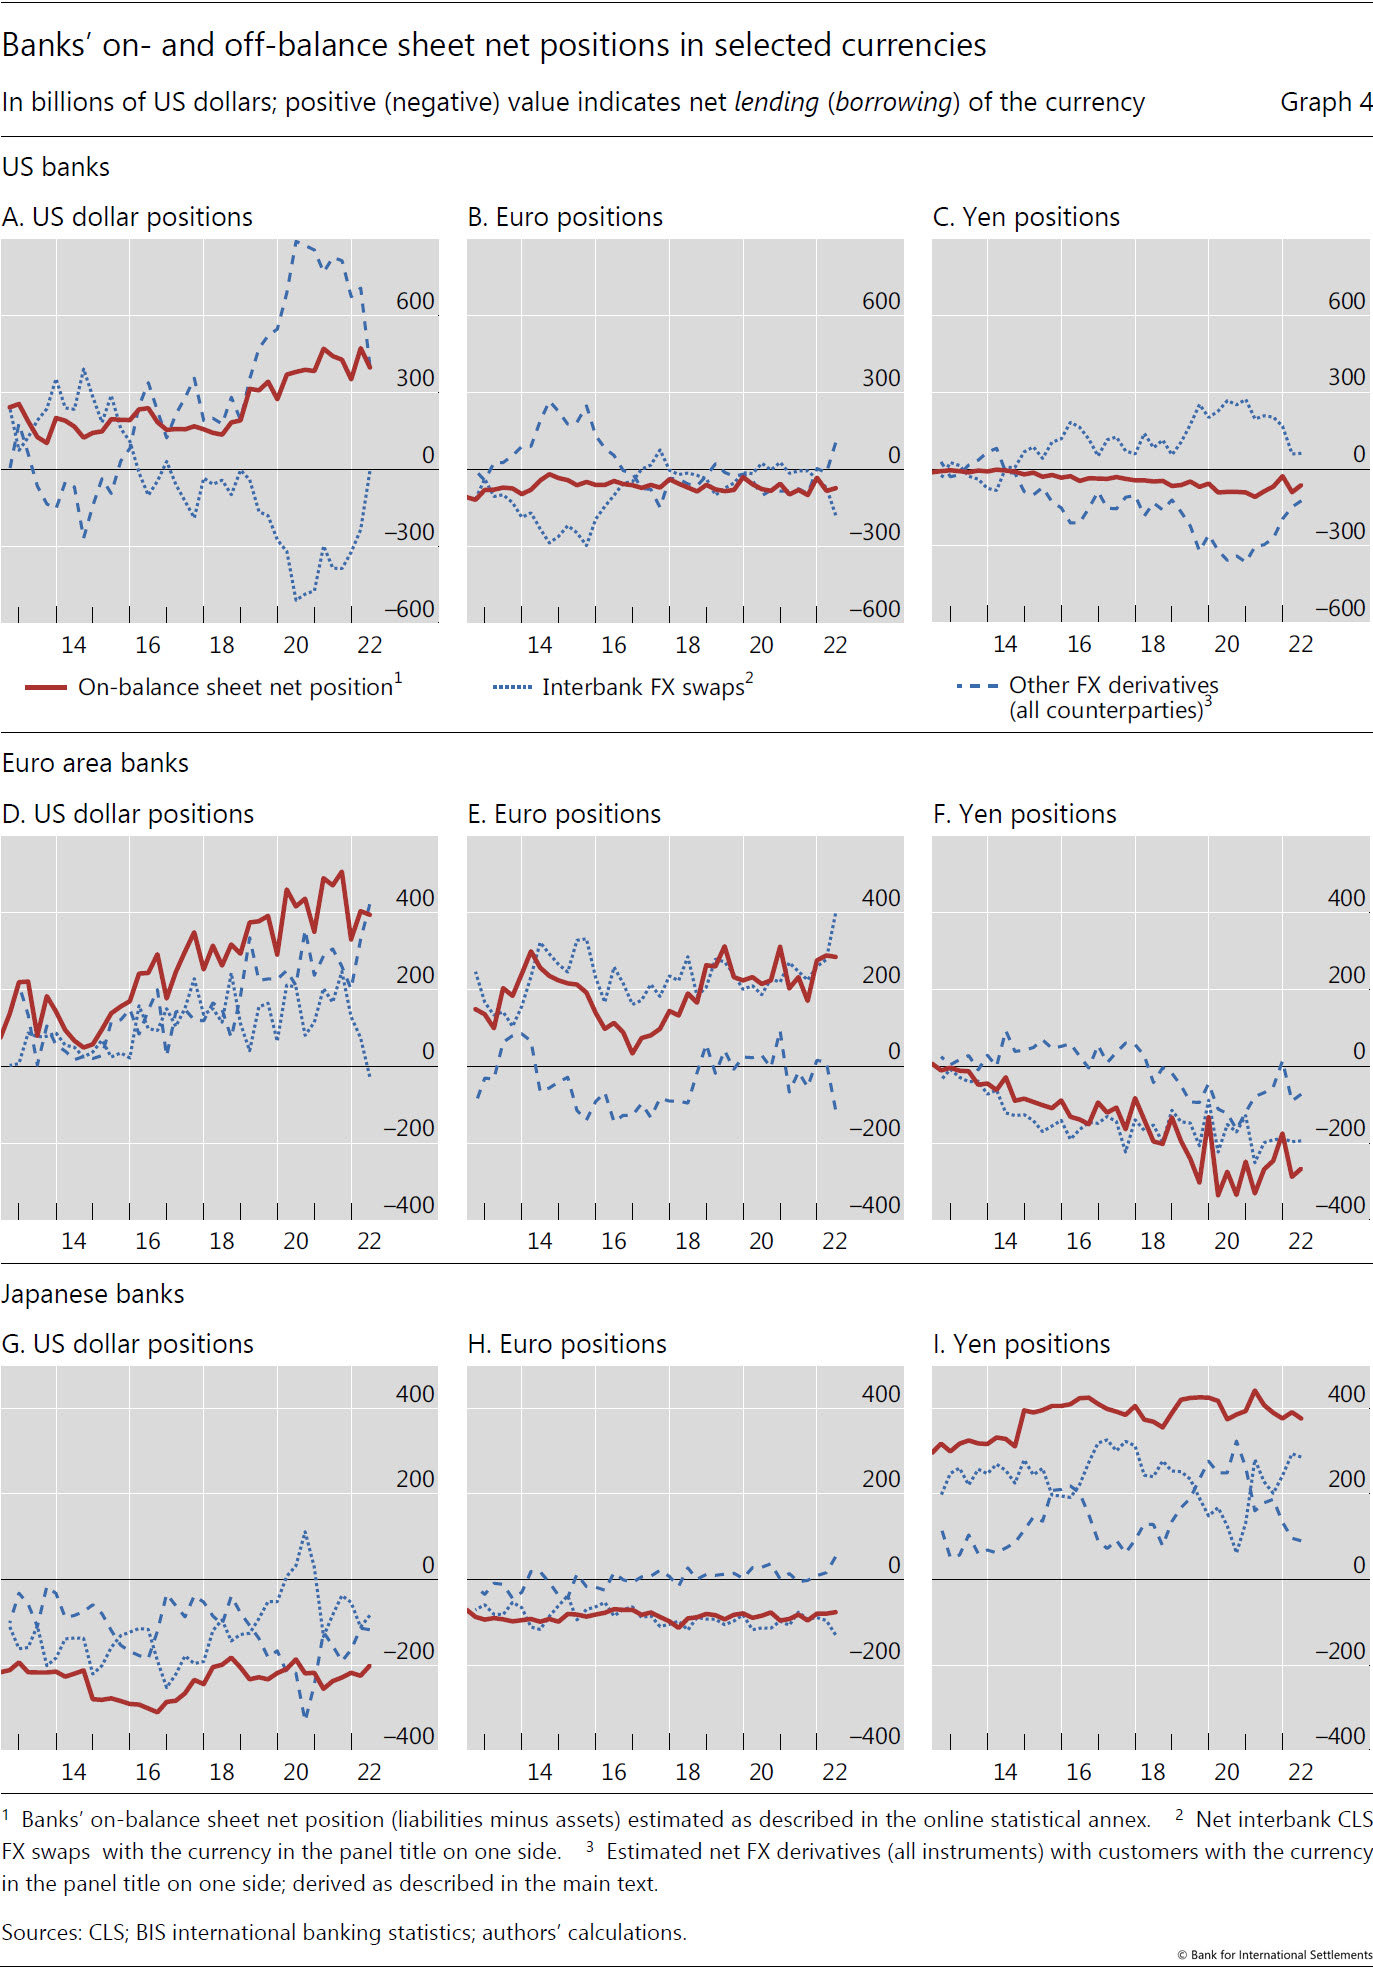
How do currencies flow via FX derivatives between banks and customers? Examining banks' net FX derivatives positions using CLS data helps to unpack the gross positions depicted in Graph 3, which consist mainly of offsetting lending and borrowing. In Graph 4, banks' net interbank FX swaps (dotted blue lines) and net position in other FX derivatives (dashed blue lines) are depicted alongside the on-balance sheet currency gaps (red lines).
The composition of banks that lend dollars via FX derivatives has evolved since 2013. The short on-balance sheet dollar position – ie the excess of dollar liabilities over dollar assets – of US banks (Graph 4.A, red line), which grew to upwards of $400 billion by 2021, mirrors off-balance sheet dollar lending of similar size.8 Notably, Graph 4 also shows euro area banks became major net dollar lenders via FX derivatives, on the back of a quadrupling of short on-balance sheet dollar positions between mid-2013 and mid-2021 (Graph 4.D, red line).9
Graph 4 also shows US banks to be on both sides of FX swap trades involving dollars, euros or yen. Their large but offsetting off-balance sheet dollar positions exceed their on-balance sheet dollar gap, evidence that US banks' intermediate between end users of FX derivatives involving the US dollar. Their mirroring off-balance sheet positions in euros prior to 2016 (Graph 4.B) and in yen after 2016 (Graph 4.C) point to EUR/USD and JPY/USD as key currency pairs.
Compared with US banks, euro area and Japanese banks seem to intermediate FX derivatives across counterparty segments to a lesser extent. Euro area banks are net dollar lenders in both off-balance sheet segments (Graph 4.D). Similarly, Japanese banks, which are net dollar borrowers via FX derivatives, borrow dollars via both segments (Graph 4.G).
Evolving demand for FX hedges and arbitrage
The swings in banks' net interbank FX swaps can be interpreted in the context of demand for dollar hedges as well as arbitrage in EUR/USD and JPY/USD FX swaps. Consider each currency pair in turn.
A divergence in credit conditions and in euro and US dollar policy rates after the Great Financial Crisis (GFC) incentivised cross-currency bond issuance on a hedged basis.10 Top-rated bank and non-bank borrowers based in the euro area took advantage of the negative EUR/USD basis swap spread by issuing dollar bonds.11 Hedging the on-balance sheet dollar liability made these issuers dollar suppliers in EUR/USD FX derivatives. The mirroring net dollar and euro off-balance sheet positions of US banks before 2016 (Graphs 4.A and 4.B) are consistent with these banks borrowing dollars from these issuers in exchange for euros. Such hedges tend to be longer-term currency swaps. Thus, the offsetting net dollar lending of US banks via interbank FX swaps suggests a degree of maturity transformation. Going into 2015, dollar bond issuance by borrowers based in the euro area waned as did US banks' supply of attendant hedges, as the cost advantage disappeared amid declining policy rates in the euro area.
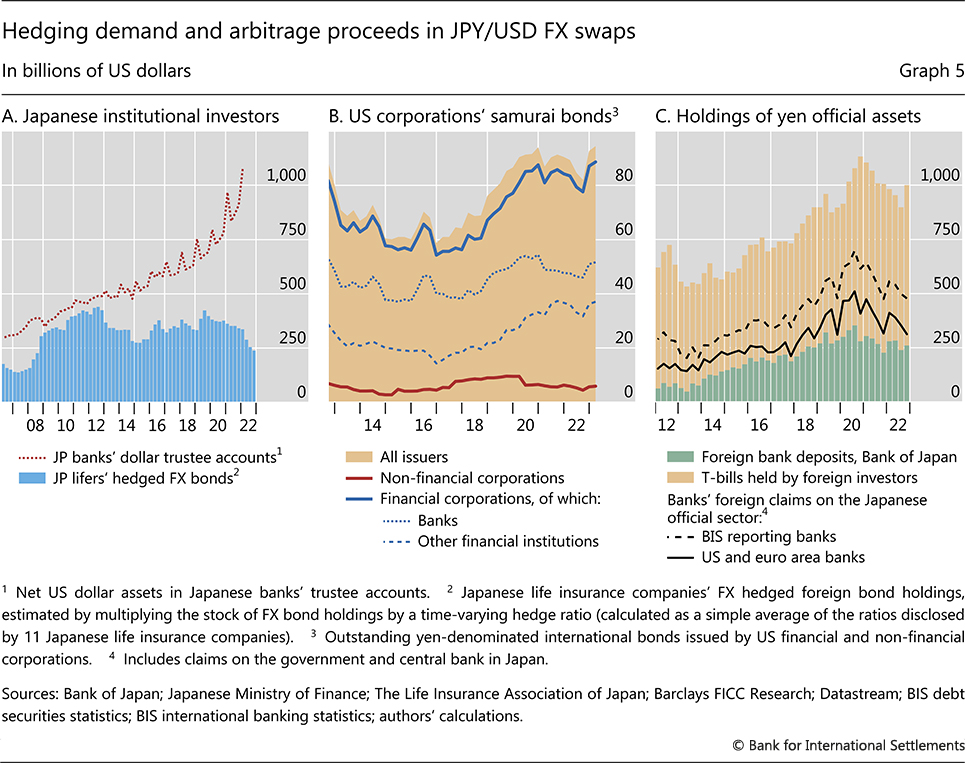
Since 2016, the demand for JPY/USD hedges has grown. Demand for these hedges grew in line with the combined foreign currency asset portfolios of Japanese institutional investors (eg insurance companies and pension funds) and managers of Japanese banks' trustee accounts (Graph 5.A).12 Adding to this was a surge in issuance of yen bonds by US (and other) corporates (Graph 5.B). By comparison, Japanese banks' own structural demand for dollars via FX derivatives (Graph 4.G, red line) has been relatively flat.
In meeting the demand for JPY/USD hedges, both US and European banks used (to an extent) arbitrage trades. This can be seen by examining the composition of the assets on these banks' balance sheets. Japanese national data show that foreign holdings of current account balances (reserves) at the Bank of Japan and of Japanese government bills have more than doubled since 2014, peaking at over $1 trillion in 2020 (Graph 5.C, stacked bars). A comparison with US and euro area banks' consolidated claims on the Japanese official sector (solid black line) suggests that these banks accounted for roughly a third of that amount. The rise in these holdings since 2014 has contributed to the steady widening in these banks' on-balance sheet yen currency gaps (Graphs 4C and 4F, red lines).13
Maturity transformation in CLS FX swaps
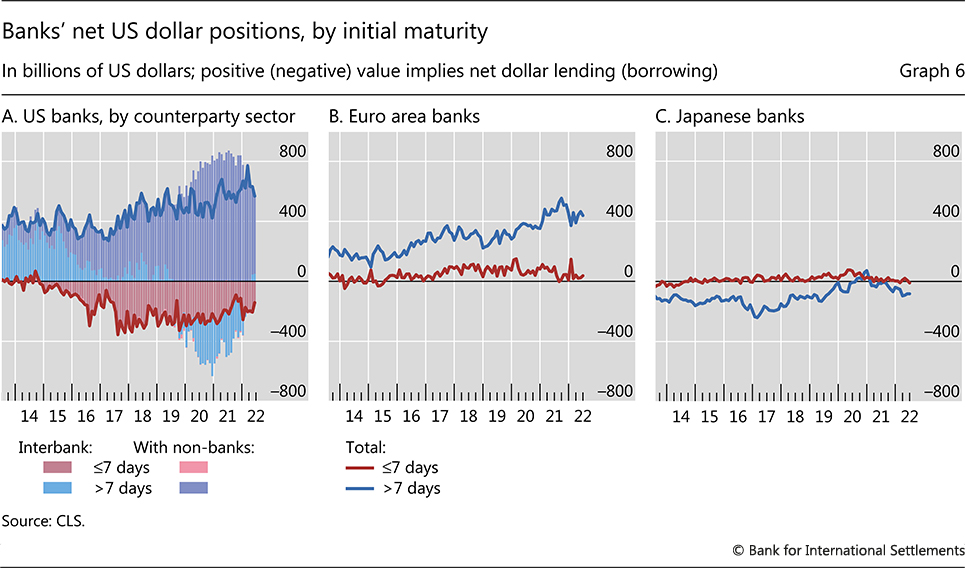
US banks' off-balance sheet JPY/USD FX swaps involved maturity transformation that is directly observable in the CLS data. They rolled shorter-term interbank FX swaps to channel longer-term dollars to non-bank customers (Graph 6.A, stacked bars).14 This activity materially shifted the maturity profile of US banks' CLS FX swaps (lines) and, somewhat counterintuitively, made these banks net dollar borrowers in interbank FX swaps (even as they remained overall dollar lenders). Compared with US banks, euro area and Japanese have not noticeably relied on maturity transformation in their dollar FX swaps.
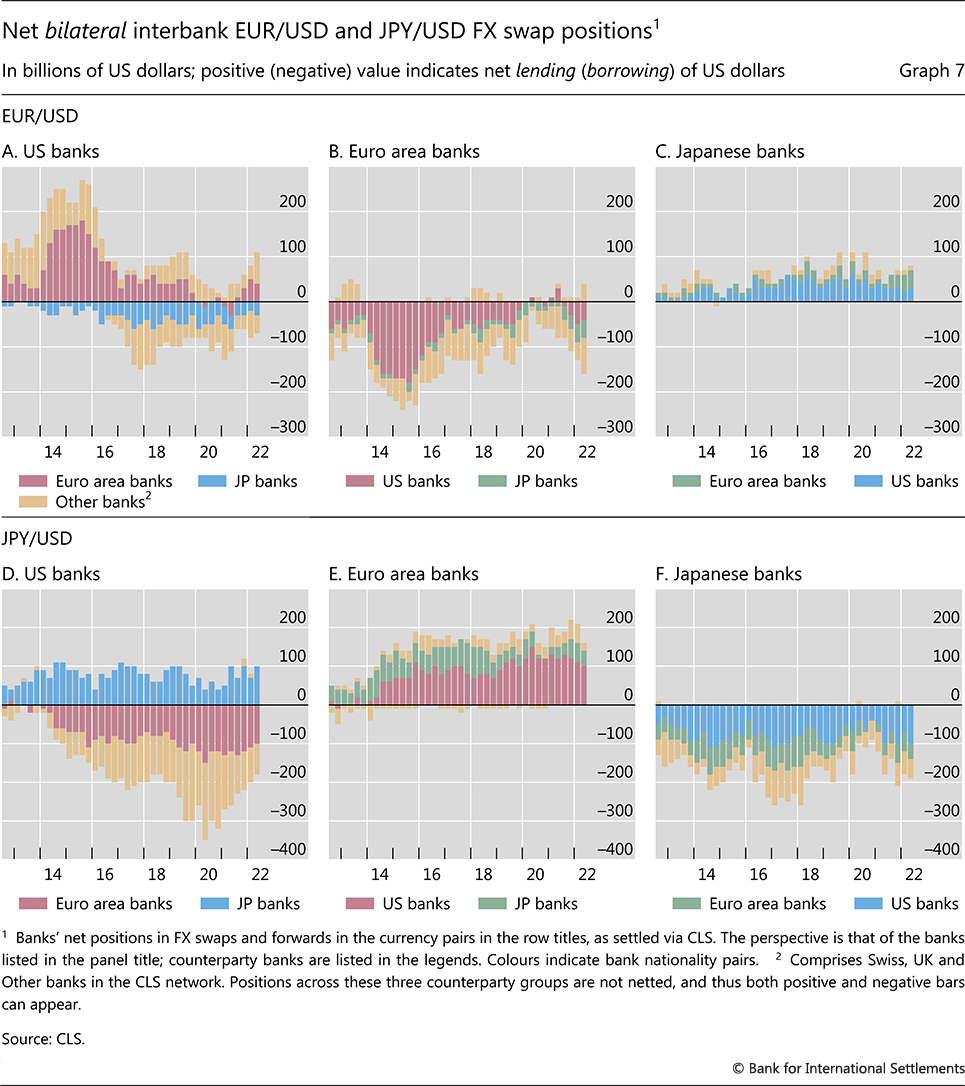
US banks' intermediation in both EUR/USD and JPY/USD FX swap trades has given them a pivotal role in the interbank market, making them dealer banks for other banks. In particular, rather than trade with each other, both euro area and Japanese banks transact mainly with US banks.15 This is seen by comparing the red and blue bars with the green bars in Graph 7, which presents net bilateral interbank CLS FX swaps. In EUR/USD FX swaps (top row), US banks tend to borrow euros from euro area banks (red bars), and then channel the euros to Japanese banks (blue bars). In JPY/USD FX swaps (bottom row), US banks borrow yen from Japanese banks (blue bars) and channel the yen to euro area banks. By comparison, the direct net positions between Japanese and euro area banks in either the EUR/USD or JPY/USD pairs were typically smaller (Graphs 7.B,C,E and F, green bars).
Conclusion
Payment obligations that arise from FX swaps are huge, but opaque. The short-term nature of these instruments makes the FX swap market susceptible to funding squeezes, such as those during the GFC and in March 2020 when the Covid-19 pandemic went global. In both cases, only extraordinary policy actions in the form of central bank swap lines restored the smooth flow of dollars.
Monitoring the FX swap market is thus an essential element in financial stability analysis. The combination of BIS and CLS data used in this feature helps to evaluate how dollars flow in the FX swap market, and how positions taken there relate to banks' on-balance sheet currency positions. This data combination adds to our monitoring tool kit in two ways.
First, it provides richer measures of banking systems' dollar funding positions. CLS data aggregates contain important information about the size, tenor, currency and counterparty structure of banks' (mostly interbank) FX swaps positions, information not found by examining on-balance sheet currency positions alone. This enables better estimates of the size of banks' gross and net outstanding dollar borrowing positions, and more accurate measurement of their rollover needs at particular tenors.
Second, the data combination provides the first (indirect) estimates of banks' net FX derivatives positions in a given currency with customers, something not possible using only BIS or CLS data in isolation. This can aid in global efforts to enhance monitoring of non-bank financial institutions, which account for an ever-larger share of global financial sector activity.
References
Abbassi, P and F Bräuning (2021): "Demand effects in the FX forward market: micro evidence from banks' dollar hedging", The Review of Financial Studies, vol 34, issue 9, September.
Bank for International Settlements (2022): Triennial Central Bank Survey of Foreign Exchange and Over-the-counter (OTC) Derivatives Markets in 2022, October.
Bank of Japan (2023): Financial System Report, April.
Basel Committee on Banking Supervision (1980): Supervision of banks' foreign exchange positions, 28 August.
----- (2020): MAR 11 – Definitions and application of market risk, 27 March.
Borio, C, R McCauley and P McGuire (2017): "FX swaps and forwards: missing global debt?", BIS Quarterly Review, September, pp 37–54.
----- (2022): "Dollar debt in FX swaps and forwards: huge, missing and growing", BIS Quarterly Review, December, pp 67–73.
Borio, C, R McCauley, P McGuire and V Sushko (2016): "Covered interest parity lost: understanding the cross-currency basis", BIS Quarterly Review, September, pp 45–64.
Bräuer, L, and H Hau (2022): "Can time-varying currency risk hedging explain exchange rates?", working paper.
CLS (2022): "The third way: delivering wider FX settlement mitigation through increased third-party participation in CLS Settlement", e-FOREX, 20 November.
Correa, R, W Du and G Liao (2020): "US banks and global liquidity", NBER Working Papers, no 27491, July.
Du, W and A Wang Huber (2023): "USD asset holding and hedging around the globe", working paper.
Du, W, A Tepper, and A Verdelhan (2018), "Deviations from covered interest rate parity", Journal of Finance, vol 73, no 3, June, pp 915–57.
Glowka, M and T Nilsson (2022): "FX settlement risk: an unsettled issue", BIS Quarterly Review, December, pp 75–81.
Iida, T, T Kimura and N Sudo (2018): "Deviations from covered interest rate parity and the dollar funding of global banks", International Journal of Central Banking, vol 55, September.
Kloks, P, E Mattille and A Ranaldo (2023): "Foreign exchange swap liquidity", Swiss Finance Institute Research Papers, no 23-22.
Krohn, I and V Sushko (2022): "FX spot and swap market liquidity spillovers", Journal of International Money and Finance, vol 120(C).
Liao, G (2020): "Credit migration and covered interest rate parity", Journal of Financial Economics, vol 138, no 2, pp 504–25.
Liao, G and T Zang (2020): "The hedging channel of exchange rate determination", Board of Governors of the Federal Reserve System, International Finance Discussion Papers, no 1283.
McGuire, P, I Shim, H S Shin and V Sushko (2021): "Outward portfolio investment and dollar funding in emerging Asia", BIS Quarterly Review, December, pp 53–67.
Munro, A and P Wooldridge (2010): "Motivations for swap-covered foreign currency borrowing", BIS Papers, no 52, July.
Ranaldo, A (2023): "Foreign exchange swaps and cross-currency swaps", in R Gürkaynak and J Wright (eds), Research Handbook of Financial Markets, Edward Elgar.
Rime D, A Schrimpf and O Syrstad (2022): "Covered interest parity arbitrage", The Review of Financial Studies, vol 35, no 11, pp 5185–227.
1 The authors thank Douglas Araujo, Claudio Borio, Stijn Claessens, Robert McCauley, Benoît Mojon, Andreas Schrimpf, Hyun Song Shin, Takeshi Shirakami and Nikola Tarashev for their helpful comments, and Branimir Gruić, Swapan Pradhan and Jhuvesh Sobrun for excellent research assistance. The views expressed are those of the authors and do not necessarily reflect those of the Bank for International Settlements.
2 Covered interest parity, a no-arbitrage condition, implies that the forward discount should equal the money market rate differential in the two currencies.
3 The analysis does not require that banks maintain a perfect currency hedge, but only that any open position be small relative to observed net CLS FX swap positions. This ensures that the direction and magnitude of the derived positions with customers are indicative of actual but unobserved positions.
4 For several bank-currency pairs, the IBS currency gap and net CLS FX swaps are similar in levels and co-move for extended periods (see online statistical annex). In some pairs, the currency gap tracks the overall net CLS position and in others it tracks the net CLS position with banks or non-banks.
5 Turnover data show that FX swaps with non-banks have longer maturities than do those with banks. Currency swaps (with both banks and non-banks) typically have a maturity longer than one year.
6 A wide basis reflects the growth in demand for dollar hedges since the Great Financial Crisis (GFC), combined with the limited elasticity of arbitrage capital supplied by banks (see eg Du et al (2018) and Iida et al (2018)).
7 On FX hedging demand, see Borio et al (2016), Du and Huber (2023) and McGuire et al (2021).
8 The online statistical annex shows the on-balance sheet dollar position of US banks (red line) to roughly track net CLS FX swaps with non-banks before 2016, and overall net CLS FX swaps after 2016.
9 The online statistical annex shows the on-balance sheet dollar position of euro area banks (red line) to roughly track their overall net CLS FX swap position during the entire sample period.
10 As the GFC gave way to the euro area sovereign debt crisis, credit spreads in the euro widened and synthetic dollar rates in EUR/USD FX swaps spiked, creating incentives for some highly rated euro area issuers to tap US dollar corporate bond markets.
11 Outstanding dollar-denominated international debt securities of selected euro area entities grew from $1 trillion in Q1 2008 to $1.7 trillion in Q2 2016.
12 The figures for hedged portfolios of Japanese life insurers are based on a roughly 60% currency hedge ratio (Graph 5.A, blue bars). The hedge ratio for foreign securities holdings in Japanese banks' trust accounts (dotted red line) is much lower.
13 Since arbitrage capital is limited, arbitrage trades alone did not meet the demand for JPY/USD hedges. US banks thus turned to the inter-dealer FX swap market (Graph 4.C, dotted blue line).
14 The term structure of currency basis favours such maturity transformation, apart from the quarter-end periods when the term structure tends to invert (Du et al (2018); Borio et al (2016); Abbassi and Bräuning (2021)). During these periods, some major bank dealers step back from intermediation (Krohn and Sushko (2022), while major US banks step in as dollar lenders (Correa et al (2020)).
15 Recall from Graphs 4.F and 4.H that both euro area and Japanese banks use mainly interbank FX swaps (dotted blue lines) to hedge their on-balance sheet mismatches (red lines) in yen and euro, respectively. Euro area banks' net need for yen and Japanese banks' net need for euros make them natural counterparties in the FX swap market.