How much stress could Covid put on corporate credit? Evidence using sectoral data
The economic downturn prompted by the Covid pandemic was historically deep and highly divergent at a sectoral level. We project corporate credit losses for the G7 economies, China and Australia until 2022 and find that they could be substantial for the sectors most affected by the pandemic. Yet, because those sectors account for a relatively small share of total corporate borrowing, aggregate corporate credit loss rates (ie losses in relation to the stock of corporate debt) could fall short of those sustained during the Great Financial Crisis of 2007–09.
JEL classification: E17, E44, G20.
Key takeaways
- This article provides a framework to translate sectoral macroeconomic scenarios into sectoral corporate credit losses, and applies it to the G7 economies, China and Australia.
- Because the pandemic has affected some sectors more severely than others, projected credit losses reflecting sectoral growth paths are very different from those based on projections of aggregate GDP growth alone.
- Despite substantial losses in the sectors most affected by the pandemic, total corporate credit loss rates (ie losses in relation to the stock of debt) could fall short of those during the Great Financial Crisis of 2007–09 because these sectors account for a smaller share of corporate borrowing than at that time.
Introduction
The Covid pandemic triggered the largest economic downturn since the Great Depression. Although the macroeconomic outlook is currently more favourable than it was at the peak of the crisis in the spring of 2020, the second wave of the pandemic is placing an additional strain on the recovery and reinforcing existing vulnerabilities, at least in some of the major advanced economies.
Non-financial corporate (NFC) bankruptcy rates remain fairly low in most countries, despite the sharp decline in economic activity (Banerjee, Cornelli and Zakrajšek (2020), IMF (2020a)). However, they are expected to rise as measures to support credit are wound back, new consumption habits and business practices accelerate the downsizing of specific sectors, and some firms run out of liquidity buffers (eg Banerjee, Illes, Kharroubi and Serena (2020)). The looming increase in corporate bankruptcies will generate credit losses that will need to be absorbed, either by the financial system or by taxpayers.
This article assesses potential corporate credit losses at the sectoral level for the G7 countries, China and Australia. On average, corporate credit accounts for slightly more than half of total private non-financial credit in these countries (ranging from 31% of total credit in Australia to 73% in China) and typically incurs larger credit losses during recessions than household credit.1 As such, the outlook for corporate credit has a significant bearing on overall assessments of the health of the financial system. We project credit losses, defined as recognised impairments on bank and non-bank debt, until the end of 2022, assuming that the pandemic will have played out by then and its impact on credit losses will have materialised.2
We proceed in three steps. First, we construct sectoral economic projections for each of the nine economies in our sample following the approach in Rees (2020) (Box A).3 Specifically, we use a macroeconomic model with a rich industry structure in both demand and production to estimate the economic disturbances ("exogenous shocks") that explain the path of activity since the start of the pandemic.4 Conditional on assumptions of how these disturbances play out, we then use the model to project the evolution of sectoral output for each country up to 2023.
In the second step, we combine data on bonds and bank loans to derive corporate debt by sector for each of the G7 countries, China and Australia (Box B). The construction of sectoral corporate debt fills a data gap in the public domain.
In the third step, we draw on existing estimates from the literature on the GDP sensitivity of credit loss rates (ie losses in relation to the stock of corporate debt) for banks (Hardy and Schmieder (2013); see also Box C) to translate our sectoral output projections into projected credit loss rates. In doing so, we assume that the historical sensitivity of bank credit loss rates to aggregate GDP is the same across sectors as well as across bonds and bank loans. We then scale these sectoral credit loss rates using our estimates of sectoral debt to project total credit losses by sector and country.
We reach three key conclusions. First, corporate credit loss rates could rise substantially in sectors most affected by the pandemic. The sectoral dispersion in credit loss rates is likely to be wider than during the Great Financial Crisis (GFC) of 2007–09 because of unevenness in sectoral economic conditions as well as the tendency for credit losses to rise more than proportionally with output shortfalls. Second, aggregate corporate credit loss rates are likely to fall short of those sustained during the GFC, in large part because the sectors most affected by the Covid pandemic account for a comparably small share of total credit. Third, projected credit losses based on sectoral growth paths are larger than those based on aggregate GDP data alone. This highlights the importance of taking account of sectoral differences in economic conditions and credit exposures when estimating the implications of an uneven recession for corporate credit losses.
Box A
Projecting the economic recovery at a sectoral level
We construct the sectoral economic growth projections used in this article following the approach discussed in Rees (2020).
The core of the approach is a multi-sector dynamic stochastic general equilibrium (DSGE) model. As well as the standard nominal and real frictions (eg sticky prices) typically included in macroeconomic models to account for aggregate economic fluctuations, the model features a detailed set of interactions on its demand side (allowing for substitution between industries in consumption and investment) and on its supply side (allowing for spillovers through input-output linkages).
For each economy, we first calibrate the parameters of the model to match key features of the economic landscape – for example, the share of each sector in gross value added – immediately prior to the Covid pandemic. We then estimate the aggregate- and industry-level supply and demand disturbances that explain economic outcomes in the first three quarters of 2020. These disturbances implicitly account for the behavioural responses to the pandemic as well as policy responses. As discussed in Rees (2020), accounting for supply and demand disturbances is important because the aggregate implications of sectoral disturbances depend upon their source. While lower demand in one sector frees resources for other sectors, lower productivity in one sector implies lower income which feeds into lower demand across all sectors of the economy.
Conditional on the estimated disturbances, we project the model forwards making two assumptions:
- The aggregate disturbances and industry-specific disturbances outside of customer services industries that occurred in the first three quarters of 2020 decay at a rate of 50% each quarter.
- The industry-specific disturbances that affected customer services industries remain in place at 50% of the intensity observed in Q2 2020 until a vaccine is widely distributed. We assume that this will occur in Q1 2022.
We also impose an additional series of aggregate and industry-level disturbances on economies in Europe and North America in Q4 2020 and Q1 2021 to account for the rising number of infections and renewed lockdowns that have occurred in those economies. We calibrate these to be 75% as large as the disturbances that occurred in Q2 2020 Although there are some differences in the pattern of quarterly growth rates, the model's aggregate GDP projections are broadly in line with those from market economists, central banks and international economic organisations. These alternative projections, however, do not typically provide information at the sectoral level.
Macroeconomic forecasts are inherently uncertain. Unforeseen developments, eg the emergence of new virus variants, or changed relationships between economic variables, eg because of pandemic-induced shifts in work practices, could cause actual outcomes to differ from the projections in this article. In principle, it is possible to characterise forecast uncertainty using "fan charts" based on repeated model simulations or historical forecast errors (eg Tulip and Reifschneider (2019)). However, these measures of uncertainty are of questionable value at present, given the unusual nature of the economic disturbances unleashed by the pandemic and the resulting changes in economic structure. Therefore, rather than attempt to quantify the uncertainty, we present a single set of projections based on a particular assumption of how the pandemic will evolve. We emphasise, however, that the range of plausible outcomes around our projections is likely to be wide.
Like all economic models, the one used in this article has a number of limitations. For example, it lacks a detailed modelling of interactions between the financial sector and the real economy that could be relevant if credit losses of the size discussed below materialise. And, while it allows for permanent changes in the level of GDP, it assumes that the effects of large crises on output growth will be transitory. Both of these factors could cause the model's projections to overstate GDP growth in the years ahead. At the same time, the projections assume that the amount of future monetary and fiscal policy support will be in line with historical norms. If the unusually large fiscal policy stimulus seen in many economies remains in place as economic conditions improve, the projections could understate the strength of the recovery.
In the online appendix accompanying this article, we provide the full set of aggregate and industry growth projections for each economy in our sample.
The number of industries varies between economies, reflecting differences in data availability, but is generally around 12–15.
Our analysis builds upon previous work on the implications of the Covid pandemic for corporate credit (eg Deutsche Bundesbank (2020), Greenwood et al (2020), Gourinchas et al (2020), OECD (2020)). Relative to these papers, we cover a larger number of countries and/or a broader scope of credit (ie projecting losses for loans and bonds at the aggregate and at the sectoral level). However, the framework that we use to calculate credit losses is straightforward to implement and update. Supervisors and other institutions can easily reproduce our analysis based on their own sources of information about credit exposures and/or views about the evolution of economic conditions.
The rest of this article is organised as follows. The first section describes the macroeconomic scenarios that inform our projections of corporate credit losses. The second maps these macroeconomic scenarios into credit losses by industry and country. The final section discusses the policy implications of our results and concludes.
The Covid recession and recovery: a sectoral perspective
Our economic projections combine observed economic outcomes since the start of the pandemic with model-based projections of how sectoral economic conditions in each country could evolve over the coming years.
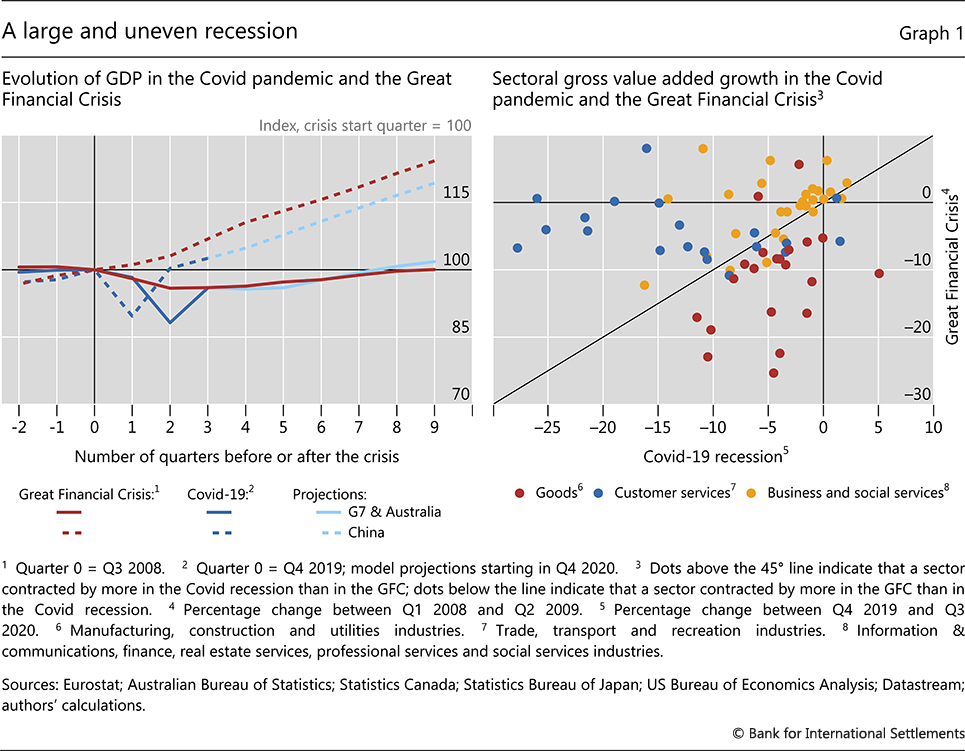
The Covid pandemic prompted a historically deep and globally synchronised recession.5 Across the advanced economies (AEs) in our sample, GDP declined by twice as much in the first half of 2020 as it did in the GFC, which was itself an unusually deep global recession (Graph 1, left-hand panel). Although GDP grew sharply in Q3 2020, it remains well below its pre-pandemic level in all of these economies. Because of its faster trend growth rate, the output trajectory of China is markedly different. But even in China, the slowdown in the first half of 2020 was substantially greater than during the GFC and the recovery has also been slower.
The Covid recession has also been unusual at a sectoral level.6 In most recessions, goods industries such as manufacturing and construction experience the largest contractions, while service industries are more resilient. This pattern was particularly striking in the GFC (Graph 1, right-hand panel). But the Covid pandemic has been felt most sharply in customer services industries such as recreation, transportation and, to a lesser extent, wholesale and retail trade (as indicated by the blue dots above the 45° line).7 The output of most goods industries and business-focused service industries declined, but by less than customer services, and in the case of goods industries by less than it did in the GFC (as indicated by the red dots below the 45° line).
These differences in sectoral economic conditions matter for two reasons. First, as emphasised by Baqaee and Farhi (2020) and Guerrieri et al (2020), the aggregate implications of economic disturbances concentrated on particular segments of the economy can differ markedly from those of economy-wide disturbances. Sectoral analysis is therefore key to understanding the economic consequences of the Covid pandemic and the trajectory of the recovery. Second, unevenness in economic outcomes across sectors, in conjunction with the tendency of credit losses to increase more than proportionally with the depth of recessions (Hardy and Schmieder (2013)), should translate into differences in financial distress. Sectoral economic projections are therefore essential for an accurate estimation of credit losses at both the sector and the aggregate level.
To account for the ongoing effects of depressed economic conditions on credit losses, we project the future path of economic activity for each country in our sample using the multi-sector macroeconomic model presented in Rees (2020). For each country, we first calculate the economic disturbances that explain the evolution of economic activity in the first three quarters of 2020, for which we have data about actual outcomes. We then project the model forward, assuming that aggregate constraints on economic activity gradually ease, but that some constraints specific to customer services industries remain in place until widespread vaccination contains the spread and the severity of the virus. For the sake of concreteness, we assume that all constraints are lifted by Q1 2022.8 For the AEs, the aggregate GDP projections resemble the recovery from the GFC (Graph 1, left-hand panel). Box A describes the model in more detail and lays out the data and assumptions that inform the projections. The projections point to material divergences in the path of output across sectors and across countries over the coming years. The cross-country variation reflects differences in the sectoral composition of output as well as in the spread of infections and containment measures. In China, economic activity is projected to be just 1% below its pre-pandemic trend by early 2022 (Graph 2, left-hand panel). This is because customer services industries account for a relatively small share of output and the economic effects of the pandemic were felt earlier than in other economies. Among AEs, Australia is projected to experience the fastest recovery as low infection rates have allowed for the easing of most containment measures. Economies in Europe and North America are projected to recover more slowly, hindered by further waves of infections and renewed lockdowns. In such cases, output is projected to remain at least 3% below what it would have been in the absence of the pandemic throughout 2021, before gradually returning to its pre-pandemic trend as restrictions are lifted.
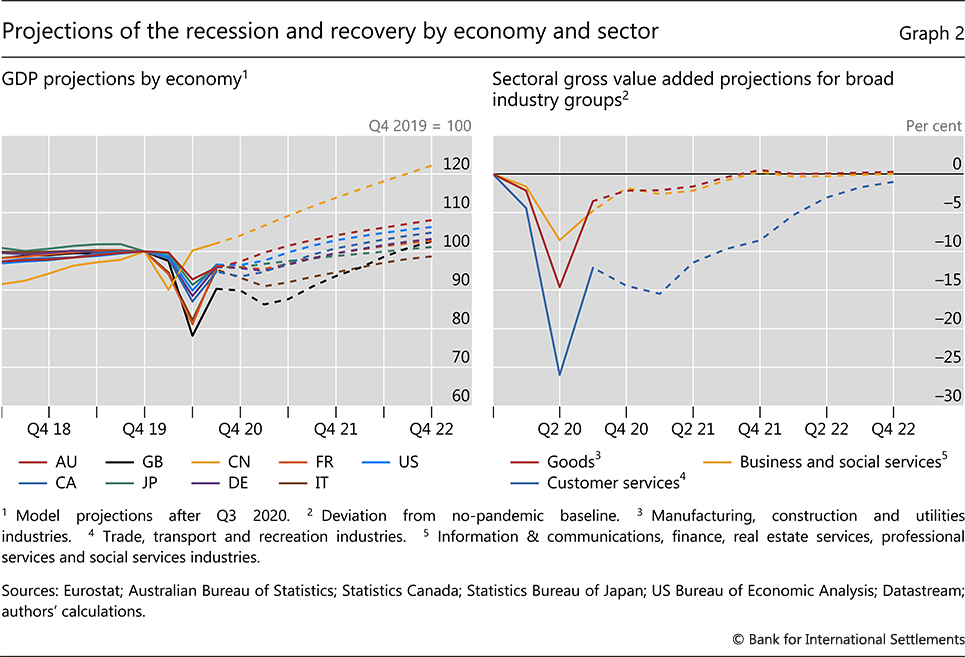
Differences in economic conditions between sectors could widen in the early stages of the recovery (Graph 2, right-hand panel). Taken together, the output of customer services industries is expected to remain at least 10% below its pre-pandemic trend until late 2021. Within that grouping, some industries would face particularly challenging conditions. The output of recreation industries, such as cafés, restaurants and tourism, is projected to remain at least 20% below its pre-pandemic trend in most economies throughout 2021. The transport industry could also face an output shortfall of more than 10%. Even after constraints ease, recreation and transport activity should take time to recover; in most countries, the output of these industries is projected to remain 2–5% below its pre-pandemic trend at the end of 2022. In contrast, the outlook for retail trade would be somewhat more positive, with output losses of at most 5% at the end of 2021, reflecting less stringent lockdowns in this sector as well as a greater potential for activity to shift online.
In our projections, output losses in goods and business services industries are generally much smaller, notwithstanding lower demand for their products from customer services firms. In many countries, output in the manufacturing and construction industries is projected to be no more than 1% below its pre-pandemic trend by the end of 2021. Projected conditions in industries such as finance, information & communications and professional services, which offer the greatest scope for remote working, are even stronger.
Implications of the recession for sectoral credit
Sectoral credit exposures
Since data on corporate credit exposure by sector are not readily available, we construct a new database of such exposures for the nine countries in our sample using a combination of market- and bank-level data sources (Box B).
Our database accounts for the bulk of NFC debt. To illustrate this, Graph 3 (left-hand panel) compares our constructed estimates of total NFC credit by country (red bars) with data from the financial accounts of non-financial firms, which should cover all sources of credit (blue dots).9 Discrepancies between the two sources could arise if our database omits some types of credit (eg lending within the NFC sector or by non-bank financial intermediaries (NBFIs)) or misallocates lending by banks that operate in multiple jurisdictions. In net, however, the discrepancies are small. Our estimates account for more than 90% of total credit exposures for all economies except France and the United Kingdom, where the share is closer to 80%.10 Reassuringly, our estimates also capture cross-country differences in corporate debt. As in the financial accounts data, they indicate that China, Canada and Japan have the highest levels of corporate credit, equivalent to more than 100% of GDP in each case. Those in other economies are lower, ranging from 75% in France to 45% in Germany.
Box B
Calculating credit exposures by sector
Since credit exposures by sector are not readily available on a cross-country basis, we construct a new database using a combination of market-based and bank-level data sources.
We measure corporate credit exposures as the sum of corporate bond capitalisation and bank loans. Sectoral bond data are available from a number of commercial data providers. For our database, we source corporate bond data from Wind and Bloomberg (for China) and Dealogic (for the other economies).
We construct bank loan exposures as follows. Where possible, we rely on information on corporate loans at a sectoral level published in the Pillar III reports which banks are required to file as part of their Basel III regulatory requirements. Where a sectoral breakdown of corporate loans is not available in Pillar III reports, we source this information from banks' annual reports or, for US banks, Securities and Exchange Commission 10K filings. We collect data for the 26 banks in the economies in our sample deemed to be global systematically important banks (G-SIBs) as well as domestic systematically important banks (D-SIBs) that account for at least 2% of total bank lending in their home jurisdiction. In total, we collect data for a sample of 62 banks, ranging in number from four for Australia to 10 for China.
Allocating bank-level exposures to countries and sectors requires a degree of judgment in three areas. The first is to allocate loans for banks that operate in more than one country. For the G-SIBs, we allocate corporate loans by country according to information on the geography of their total corporate loan portfolio, which is also published in their Pillar III reports. In doing so, we assume that the sectoral allocation of loans for each bank is the same in each economy in which it operates. For the D-SIBs, which typically have a smaller international footprint, we allocate all corporate loans to their home jurisdiction.
The second judgment is to allocate loans for banks that provide a less detailed sectoral breakdown than that used in our macroeconomic model. In cases where the sectoral breakdowns in Pillar III reports implicitly group a number of industries into a single residual category, often labelled "Other", we allocate these loans to all unreported industries according to those industries' shares of an economy's GDP. Similarly, in cases where the industry groups in the Pillar III reports are less detailed than those in the macroeconomic model (eg if a Pillar III report contains data for "Transport and trade"), we allocate the loans to the corresponding model-based industry categories according to the GDP shares of those industries.
Third, we assume that the banks not covered in our sample behave proportionally to the average G- and D-SIBs, ie we assume that the uncovered portion of total assets in each banking system exhibits a similar sectoral credit allocation. As for D-SIBs, we allocate the loans of these banks entirely to their home jurisdictions.
We verify the plausibility of the credit data that we have constructed in three ways. First, as discussed in the main text, the aggregate credit volumes that our database provides are comparable to those from national financial accounts data, which should capture all corporate borrowing in each economy. Second, for France, Germany and Italy, we are able to compare our data with estimates of sectoral corporate liabilities from the Bank for the Accounts of Companies Harmonised (BACH) database from the European Committee of Central Balance Sheet Data Offices. Because the BACH data are constructed from firm balance sheets (ie debtors), they provide an independent cross-check on our estimates, which are constructed using information from markets and banks (ie creditors). For all three countries, the level and sectoral distribution of corporate liabilities in our database are similar to those in the BACH database. Third, for all nine countries we compare bank loans by industry in our database with data on bank loans from the balance sheets of listed firms, sourced from S&P. While the volume of bank loans in our database is somewhat larger than that from firm balance sheet data – as would be expected given that our data should also include borrowing by non-listed firms – the distribution of loans across sectors is very similar.
Our aggregate estimates are also consistent with the private non-financial corporate credit data published by the BIS (Dembiermont et al (2013)) after accounting for the fact that the BIS data are recorded on a non-consolidated basis (ie include debt financing within the non-financial corporate sector), whereas our database considers only lending from the financial sector to the non-financial sector.
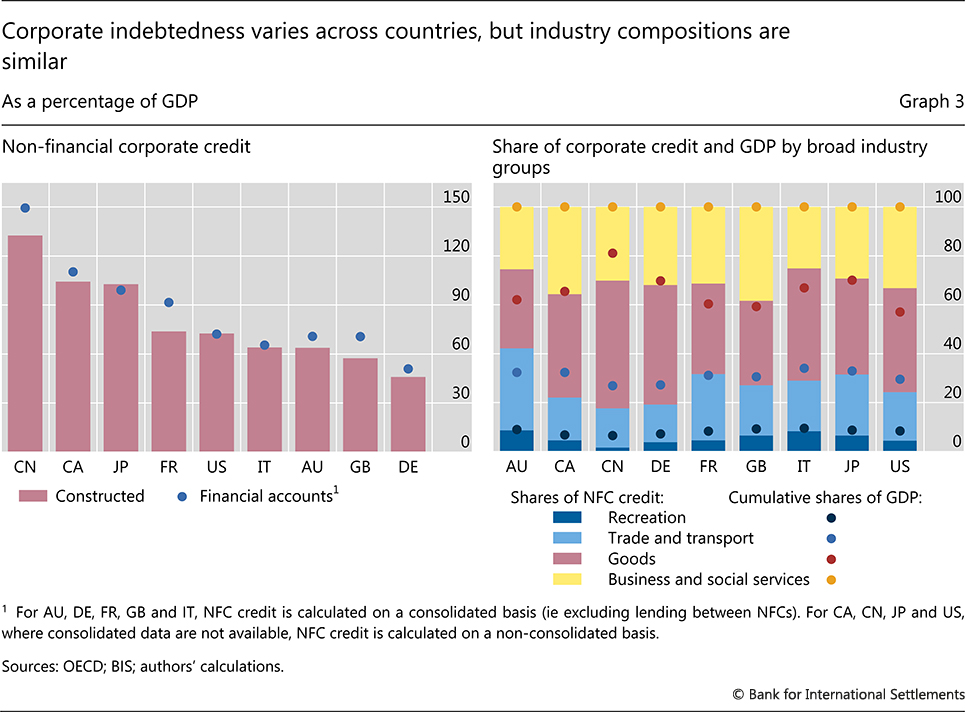
At the sectoral level, the industries heavily affected by the pandemic account for a relatively small share of total debt (Graph 3, right-hand panel).11 The recreation industry accounts for between 1.5 and 8% of NFC credit in the countries in our sample. Considering also the transport and trade industries raises the total share of customer services industries (ie the dark blue and light blue bars) to around 15–30% in most countries. This is lower than the share of credit exposure to goods industries, as well as business and social services industries, which both have generally been less affected by the pandemic than customer services.
The share of customer services industries in NFC credit is also smaller than their share of GDP in all countries other than Australia. Other things equal, this suggests that credit losses will increase by less following an economic downturn concentrated in customer services industries than they would if an economic downturn was concentrated in goods industries, whose share of total credit is typically larger than their share of overall GDP.
Further reading
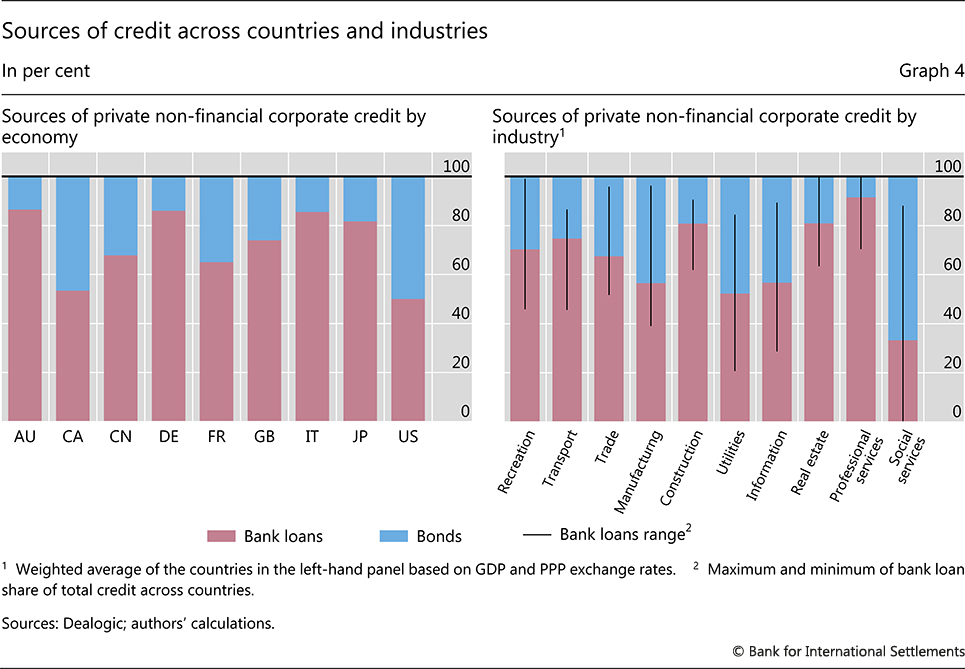
Our database also sheds light on the distribution of credit across financing instruments. With the exception of the United States and Canada, bank loans are the dominant source of NFC credit in the countries in our sample (Graph 4, left-hand panel). At the sectoral level, bank loans account on average for around 70% of financing for the recreation, transport and trade industries. This is larger than the share of bank loan financing for the manufacturing and utilities industries (below 60%), but lower than the shares for the construction and real estate industries (around 80%). However, there are large differences across countries within each industry.
Credit risk scenarios
We next assess the credit losses implied by our model's sectoral GDP paths. We base our calculations on estimates of the impact of economic activity on credit losses across a large sample of banking crises from the 1990s until the GFC by Hardy and Schmieder (2013) (see Box C for more information). That study documented that the GDP elasticities of credit loss rates (ie the percentage point change in credit loss rates for a 1 percentage point change in GDP paths during crises) increase with the depth of the recession. They also show that these elasticities tend to be fairly similar across advanced and emerging market economies. In this article, we assume that the elasticities are the same across industries.12
We take the average of two alternative GDP elasticities of credit loss rates put forth by Hardy and Schmieder (2013). The first purely reflects the depth of the Covid recession (ie the maximum drop of GDP relative to pre-pandemic levels, which is larger than during the GFC). The second also takes account of the cumulative deviation of growth from trend (Box C).13 As the Covid recession has been unusually deep but is likely to be fairly short-lived (conditional on policymakers (a) managing the distribution of vaccines and (b) containing the financial fallout), we balance the relative impact of depth and duration on the elasticity.14
Box C
Projecting credit losses
The credit loss projections are based on the estimates of the impact of output on credit loss rates reported in Hardy and Schmieder (2013, Table 4), applied to the sectoral output paths. These estimates are based on a sample of more than 10,000 banks from around 170 countries from 1990 to the GFC.
Hardy and Schmieder document that the effects of economic activity on credit loss rates are non-linear and can depend on both the depth of the recession and its cumulative severity. The following rule of thumb illustrates this non-linearity: in mild recessions (with a maximum drop of output growth of 2.4% relative to the baseline) each 1 percentage point drop in output growth implies roughly a 0.25 percentage point (ppt) increase in credit loss rates, while in severe recessions (with a maximum drop in output growth greater than 5 percentage points) this effect increases to around 0.5 ppt. The equivalent elasticities when applied to the cumulative change in GDP growth over four years are 0.125 ppt for a mild recession and 0.25 ppt for a severe recession. We apply the same elasticity of credit losses to both banks and bonds as well as to all sectors, using sector-specific output.
We use the depth of the recession to measure credit loss rates and set the elasticities on a continuous scale based on the change in output growth. To account for an unusually sharp bounce-back in activity of the Covid recession, in conjunction with substantial government support measures, we lower the elasticity to half way between the elasticities for the maximum drop in GDP growth and its cumulative deviation (eg around 0.375 for severe recessions). The resulting equation for the change in the credit loss rate is given by:
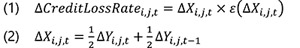
where 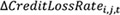 is the change in the credit loss rate in sector i in country j in year t,
  it the measure of output growth in the corresponding sector and
  is the elasticity of credit loss rates, which is a function of output growth. Deeper drops in activity imply a higher elasticity. Equations (1) and (2) state that we project credit losses on the basis of the average growth rate of GDP (in a given sector and country) over the current and preceding year. This accounts for the observation that credit losses typically lag GDP by six to 12 months.
We calculate the change in credit losses by multiplying the projections of the change in credit loss rates by sectoral credit exposures. In addition to the sectoral credit loss rates, we calculate aggregate credit loss rates for each economy based on the aggregate output projections to put the sectoral data into perspective (Graph 6, right-hand panel).
In the online appendix accompanying this article, we provide the full set of aggregate and industry growth projections for each economy in our sample.
Given sectoral output paths and loss rate elasticities, we proceed as follows. We assume that credit losses lag changes in GDP by six to 12 months, in line with evidence for bonds (eg Graph 6, left-hand panel) and bank credit (Hardy and Schmieder (2013)). We model the changes in sectoral credit loss rates that result from our projections of economic activity rather than the absolute levels of credit loss rates, as we do not have robust data on pre-pandemic credit loss rates at the sector level.
Based on this method, the sectors whose activity contracts the most suffer the largest increases in credit loss rates. Credit loss rates in the recreation industry are projected to increase by more than 8 percentage points on average during 2020–22 compared with the pre-crisis period, while the trade, transport and social services industries are expected to see increases in loss rates of between 1.5 and 3 percentage points (Graph 5, left-hand panel, blue bars). In contrast, loss rates in the information & communications, real estate15 and utilities industries are projected to increase by less than 0.2 percentage points.
The projected dispersion of credit losses across sectors is wider than our approach would have predicted during the GFC (given actual changes in sectoral output growth in that episode), when NFC credit losses were more balanced across industries (Graph 5, left-hand panel, red bars). Also, because credit losses increase more than proportionally with output shortfalls, the dispersion of loss rates by industry is projected to be wider than the dispersion in sectoral output growth.
For individual countries, the unevenness of the crisis in terms of depth, timing and cumulative impact at the sectoral level (Graph 2) leads to different patterns of credit losses. Country-level credit losses as a share of GDP peak in 2021 at between 0.4 and 2.4 percentage points above their pre-Covid levels (Graph 5, right-hand panel) with an average increase of 1 percentage point. The estimated increase in credit losses is largest in the United Kingdom, followed by Italy and France, in line with their more adverse GDP paths (Graph 2, left-hand panel) and their high share of severely impacted sectors. The increase in credit losses is most contained in China. Cumulated over the 2020–22 period, the increases in credit losses due to the pandemic amount to between 0.7% of annual GDP in China and 5.1% in the United Kingdom.
Cross country variation in credit losses reflects differences in sectoral output paths and pre-existing credit exposures. For example, aggregate credit losses as a share of GDP are projected to be lower in Germany than in the US despite similar GDP paths, because credit exposures to customer service industries are smaller in Germany. Similarly, projected credit losses in the UK are larger than in France and Italy, despite similar initial sectoral credit exposures, because of the UK's less favourable output trajectory.
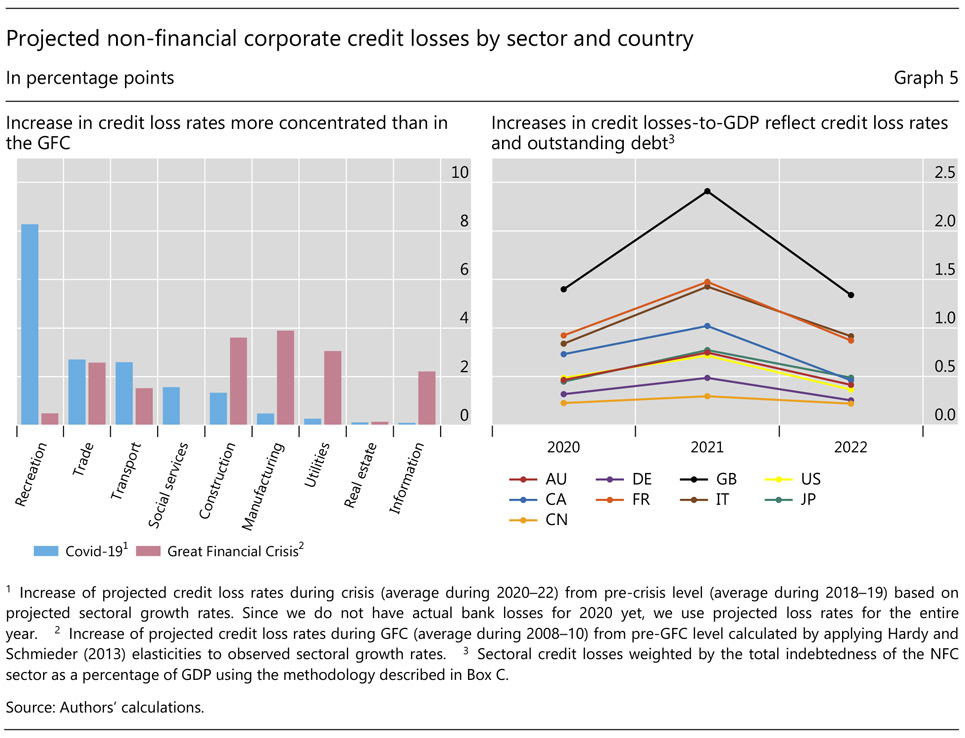
Despite the substantial increases in credit losses for some countries and industries, we estimate that aggregate credit loss rates could rise by less than during the GFC.16 Graph 6 (left-hand panel) illustrates this, showing projected global aggregate credit losses for bonds17 (for which we have a long time series, unlike for sectoral bond and bank credit). We project that credit loss rates for bonds will peak at 1.9% in 2021. These are below the levels that occurred at the height of the GFC (2.9%). Loss rates increase by less than during the GFC because the industries affected by the pandemic account for a relatively small share of total corporate borrowing18 and because public support measures are likely to translate into a smaller increase in credit losses than is typically the case (Graph 3, right-hand panel) (Box C).19
Our estimates, which take sectoral developments into account, are larger than the ones obtained on the basis of country-level GDP forecasts (Graph 6, right-hand panel). This is because of the uneven nature of the recession at a sectoral level combined with the fact that credit losses increase more than proportionately with the depth of the recession. The use of aggregate numbers would hide potential vulnerabilities, particularly for Australia, Germany and the United States. These differences may be even more important at the level of individual banks or asset managers with particularly large exposures to the most severely hit sectors.
As with the sectoral output projections, our projected credit losses, which amount to about $1 trillion above what would have been expected in the absence of the pandemic, are subject to considerable uncertainty.20 Because credit losses increase more than proportionally with GDP shortfalls, differences in macroeconomic outcomes could cause credit losses to be materially higher or lower than our estimates. There is also uncertainty about how economic outcomes will translate into credit losses, particularly given the substantial public support measures introduced early in the pandemic to limit business failures. We acknowledged these support measures,21 as well as the unusually rapid recovery in activity in the second half of 2020, by applying lower GDP elasticities of credit losses (Box C). Without this adjustment, our credit loss projections would be roughly 50% greater.
Conclusion
Our analysis suggests that the effects of the Covid pandemic on corporate insolvencies and resulting credit losses are only starting to be felt. Based on our sectoral GDP projections, in a plausible central scenario we find that corporate credit losses during 2020–22 could be equivalent to about three times the pre-crisis level on average across the G7, China and Australia. The additional credit losses emerging from the crisis during the three-year period would cumulate to slightly above 2% of annual GDP or $1 trillion. Any such losses would be borne by financial intermediaries, investors or taxpayers.
Our scenario also suggests that, conditional on the assumptions underlying our analysis and abstracting from the fiscal support costs, corporate credit loss rates could remain below those observed during the GFC. This is because the current downturn is concentrated in corporate sectors that account for a smaller share of output and debt than those most affected by the GFC.
As is natural in any exercise of this type, our estimates come with a number of caveats, as they are based on some constraining assumptions, notably due to data limitations. The only variable assumed to influence credit losses is GDP, so that the analysis does not consider factors such as the creditworthiness of firms, eg related to their leverage, or the structure of their debt, eg related to maturity (debt is purely a scaling factor), or the degree of possible overvaluation in asset prices, eg commercial real estate. Indeed, in contrast to the GFC, when household debt was at the core of the problems, on this occasion the signs of overstretched balance sheets are in the corporate sector, with strong increases in corporate indebtedness in conjunction with declining credit ratings in many key jurisdictions pointing to a reduction in creditworthiness (BIS (2020)). In addition, the estimates abstract from possible amplifying mechanisms within the financial sector: while banks are in better shape than at the time of the GFC, greater signs of risk-taking have been evident in market-based finance (eg Aramonte and Avalos (2019)). Relatedly, even though our estimates of the effect of GDP shortfalls on credit loss rates are applied to all forms of credit, they are based only on historical evidence from bank loss data. These limitations naturally make it harder to draw inferences.
The most important lesson of our exercise is that the design of top-down stress tests should take account of the sectoral profile of the recession. This is because credit exposures differ across industries and credit loss rates increase more than proportionately with output declines, our industry-based credit loss estimates are larger than estimates based on aggregate GDP data alone. The sectoral macroeconomic projections used in this article, which are available in an online appendix, could be useful inputs in this regard, and inform the level of loss projections. We intend to revise them periodically to account for economic developments as well as the ongoing race between vaccines and mutations of the virus. Our framework, which is straightforward to implement and update as new information arises, could be a useful complement to existing public stress testing exercises carried out periodically. It allows running sensitivity analyses that can account for both the dynamic nature of the crisis and for alternative policies that handle weaknesses in the corporate sector. Using better data, the approach could also be extended in a number of dimensions, along the lines mentioned above.
References
Alfonso, V, C Boar, J Frost, L Gambacorta and J Liu (2021): "E-commerce in the pandemic and beyond", BIS Bulletin, no 36, 12 January.
Aramonte, S and F Avalos (2019): "Structured finance then and now: a comparison of CDOs and CLOs", BIS Quarterly Review, September, pp 11–14.
Banerjee, R, G Cornelli and E Zakrajšek (2020): "The outlook for business bankruptcies", BIS Bulletin, no 30, 12 October.
Banerjee, R, A Illes, E Kharroubi and J Serena (2020): "Covid-19 and corporate sector liquidity", BIS Bulletin, no 10, 28 April.
Bank for International Settlements (BIS) (2020): "A global sudden stop", Annual Economic Report 2020, Chapter 1, June.
Baqaee, D and E Farhi (2020): "Supply and demand in disaggregated Keynesian economies with an application to the Covid-19 crisis", NBER Working Papers, no 27152, August.
Broadbent, B (2021): "Covid and the composition of spending", Bank of England webinar, 12 January 2021.
Dembiermont, C, M Drehmann and S Muksakunratana (2013): "How much does the private sector really borrow – a new database for total credit to the private non-financial sector", BIS Quarterly Review, March, pp 65–81.
Deutsche Bundesbank (2020): "Risk of a sharp rise in insolvencies", Financial Stability Review 2020, pp 35–42.
Greenwood, R, B Iverson and D Thesmar (2020): "Sizing up corporate restructuring in the Covid crisis", NBER Working Papers, no 28104, November.
Gourinchas, P-O, S Kalemli-Ӧzcan, V Penciakova and N Sander (2020): "Covid-19 and SME failures", NBER Working Papers, no 27877, September.
Guerrieri, V, G Lorenzoni, L Straub and I Werning (2020), "Macroeconomic implications of COVID-19: can negative supply shocks cause demand shortages?", NBER Working Papers, no 26918, April.
Hardy, D and C Schmieder (2013): "Rules of thumb for bank solvency stress testing", IMF Working Papers, no 13/232, November.
International Monetary Fund (IMF) (2020a): "Corporate liquidity and solvency in Europe during the coronavirus disease pandemic: the role of policies", Regional Economic Outlook: Europe, October.
----- (2020b): "Dissecting the economic effects", World Economic Outlook, chapter 2, October.
Kohlscheen, E, B Mojon and D Rees (2020): "The macroeconomic spillover effects of the pandemic on the global economy", BIS Bulletin, no 4, 6 April.
Moody's (2020): Default Trends – Global: November 2020 Default Report, 8 December.
Organisation for Economic Co-operation and Development (OECD) (2020): "Issues Note 2. Insolvency and debt overhang following the COVID-19 outbreak: assessment of risks and policy responses", Economic Outlook, vol 2020, no 2, pp 60–72.
Rees, D (2020): "What comes next?", BIS Working Papers, no 898, November.
Sédillot, F (2013): "How reliable and comparable are private debt measures: the French case", IFC Bulletin, no 36, pp 366–76.
S&P (2021): "Lower and later: the shifting horizon for bank credit losses", S&P Global Ratings, 2 February.
Tulip, P and D Reifschneider (2019): "Gauging the uncertainty of the economic outlook using historical forecasting errors: the Federal Reserve's approach", International Journal of Forecasting, vol 35, no 4, pp 1564–82.
World Bank (2020): Global Economic Prospects, June 2020.
1 The Great Financial Crisis of 2007–09, which saw substantial losses on household credit in many countries, was unusual in this regard.
2 Hardy and Schmieder (2013) estimate that recognised credit losses typically lag declines in economic activity by six to 12 months.
3 Throughout this article, we use the terms "sector" and "industry" interchangeably.
4 On its demand side, the model allows for cross-industry substitution in consumption and investment. On its production side, the model allows for cross-industry spillovers through input-output linkages.
5 According to World Bank (2020), a larger share of economies experienced contractions in per capita GDP in 2020 than in any year since at least 1870.
6 We construct economic projections for 12–15 sectors per country, with the exact number depending on data availability. The sectors broadly correspond to one-digit International Standard Industrial Classification (ISIC) categories. Where it aids presentational clarity, we combine our detailed sectoral projections into three broad categories: consumer services (eg recreation, trade and transport), goods (eg manufacturing, construction and utilities) and business & social services (eg information & communication, real estate, and professional and social services). Because our focus is on non-financial corporate credit, we exclude the finance sector from the credit loss analysis, although it is included in the economic projections.
7 Much of the effect of the pandemic on the retail sector came through shifts in spending patterns among retailers, rather than changes in overall retail spending or shifts in spending patterns between retail trade and other industries (eg Alfonso et al (2021), Broadbent (2021)).
8 We impose additional disturbances on economies in Europe and North America to account for the second wave of infections and lockdowns that occurred in late 2020 and early 2021. While the "end" date of the pandemic could be further out than we assume, notably because of the challenges of eradicating the virus globally (IMF (2020b)) and the persistent effects of economic spillovers across economies (Kohlscheen, Mojon and Rees (2020)), shifting the date on which all constraints relax by one or two quarters has a negligible effect on our results.
9 Because our database is unlikely to capture lending within the NFC sector, in Graph 3 we compare our estimates with financial accounts aggregates calculated on a consolidated basis (ie comprising only lending between the financial sector and the NFC sector), where such data are available. The volume of lending within the NFC sector is equivalent to less than 10% of GDP for most of the countries in our sample. In France, however, lending between NFCs appears to exceed 60% of GDP according to national financial accounts data, although this encompasses intragroup trade credit and may therefore reflect a degree of double-counting (Sédillot (2013)).
10 There is no clear pattern to the discrepancies. For example, the omission of some lending by NBFIs could explain why we understate NFC credit in China. However, for the United States, where NBFIs are also an important source of credit, the estimate of total NFC credit in our database is similar to that from the US financial accounts.
11 In this graph, we separate "customer services industries" into recreation industries, which have been most severely affected by the pandemic, and tourism and trade, whose output declines have been smaller.
12 Our calculations link sectoral credit loss rates exclusively to sectoral GDP paths and then use sectoral debt to transform these loss rates into aggregate credit losses. An alternative approach to account for the country- and sector-specific leverage of firms would be to use proportional changes of credit loss rates conditional on the changes in GDP growth, rather than using absolute changes (as we have in this study). While the two approaches deliver broadly similar estimates of credit losses at the aggregate level, some of the country and sectoral estimates differ. However, this alternative approach puts more emphasis on pre-crisis sectoral credit loss rates, for which no robust data are available (Box C).
13 Hardy and Schmieder (2013) note that these two estimates are fairly aligned for many previous crises, since the depth of a recession is typically correlated with the cumulative deviation of growth from trend. The Covid recession is unusual in this regard, as much of the decline in activity that occurred in Q2 2020 was reversed in Q3 2020.
14 Using a lower elasticity is also a way to account for the cushioning effects of public policies that aim to support corporates and limit their financial distress.
15 In our analysis, the real estate sector captures the activities of firms involved in the sale, rental or management of real estate. Credit losses related to falls in real estate prices will be attributed to the sectors of the firms that own the property.
16 Our estimates suggest that total corporate credit losses as a share of GDP in the current episode could rise by less than during the GFC, although the difference is smaller than for loss rates because total corporate debt has increased over the intervening period.
17 We refer to defaulted bonds rather than mark-to-market losses.
18 The GFC saw large credit losses in industries such as manufacturing with relatively large credit exposures. In contrast, the industries most affected by the Covid pandemic have smaller credit exposures.
19 We account for the effect of public support measures by lowering the elasticities of credit loss rates with respect to GDP.
20 Our estimates of aggregate credit losses are broadly consistent with other studies that have estimated pandemic-induced increases in corporate losses, after accounting for differences in scope, timing and concept. S&P (2021) estimates global bank credit losses of about $1.8 trillion for 2020 and 2021 (ie about $0.4–0.5 trillion per year in aggregate for the countries in our sample), and Moody's (2020) projects similar corporate bond default rates to our estimates in Graph 6.
21 The assessment of the cost and benefit of such measures and their legacy on public debt is beyond the scope of this article.